Last week’s results show that confounding is possible for correlations of Household and Nonprofit Organization (HNO) Credit changes and Nonfinancial Corporate (NFC) Debt changes with subsequent CPI inflation changes.1 This post adds some detail to those observations.

Image by Arvid Olson from Pixabay
Introduction
We previously2 proposed two hypotheses related to the possible feedthrough of correlations from NFC (due to NFC correlation with HNO) when the correlation of HNO with CPI is measured empirically—and vice versa:
- The correlations between HNO and NFC are not spurious; there is cause and effect. In that case, the summation of the weighted associations with CPI for the two variables will equal the association between CPI and the sum of the two variables, changed only by the occurrence of new spurious correlations.
- Suppose spurious association contributions are within one or both HNO and NFC associations. In that case, the summation of the weighted associations with CPI for the two variables will be greater than the association between CPI and the sum of the two variables unless new spurious associations of sufficient magnitude arise.
Last week, the following graphic displayed the four variables and combinations of variables involved in the inflation surge of 1977-80:
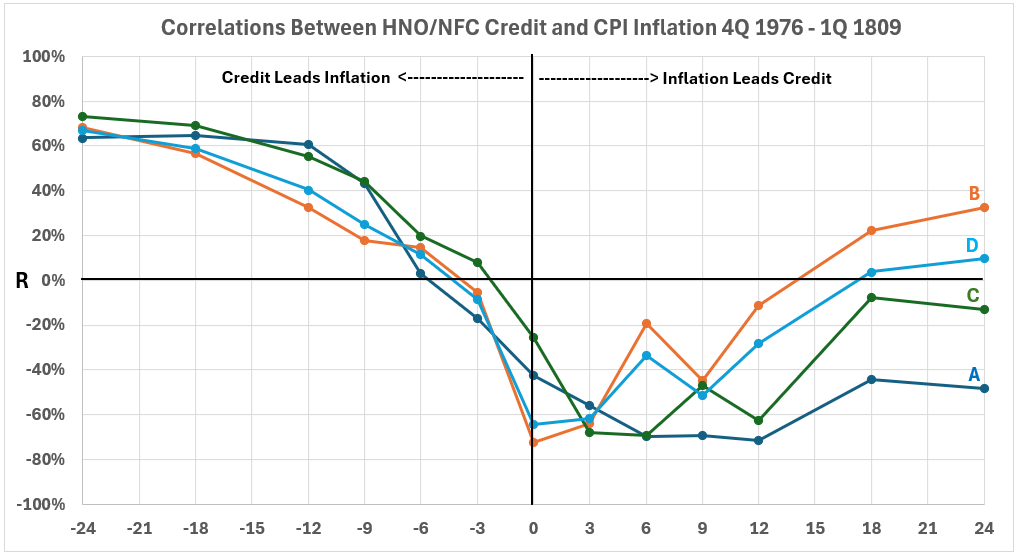
Figure 7 shows the various correlation plots involved in the current confounding assessment.
Figure 7. Looking for Confounding – HNO and NFC Associated With CPI
In Figure 7, the correlation plots are:
A = HNO
B = NFC
C = (HNO + NFC)
D = 0.28HNO + 0.72NFC
Last week, we dismissed further analysis with the statement:
The differences between the four plots are relatively small on the left side of the graph. According to the hypothesis, if confounding exists, it is not a dominant factor.
After further consideration, we have decided to examine the results further.
Data
There is no new data. We continue to work with the previous data.
Analysis
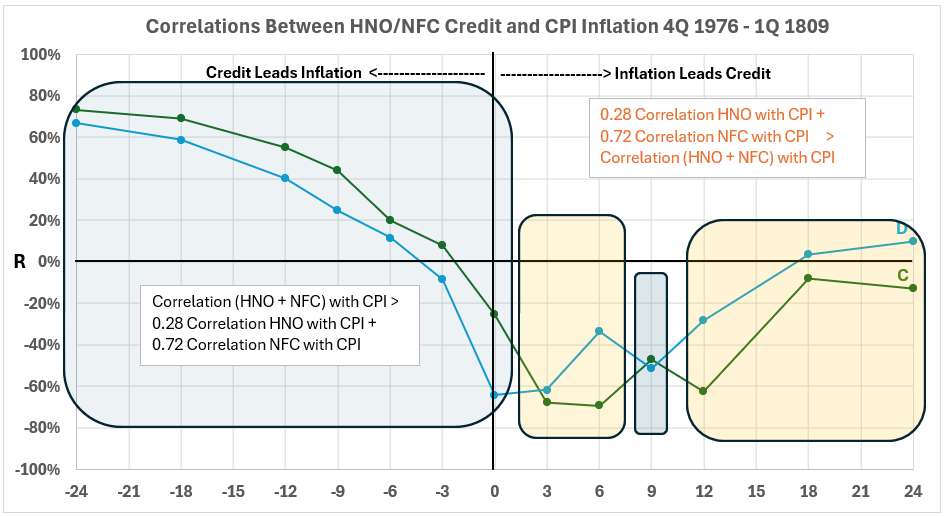
To take a closer look at how the two data organizations compare in the graph above from last week, we remove plots A and B. Figure 1 shows that the results for the various timeline offsets fall into two groups:
Correlation (HNO + NFC) with CPI >
The sum of 0.28 Correlation HNO with CPI + 0.78 Correlation NFC with CPI
and
The sum of 0.28 Correlation HNO with CPI + 0.78 Correlation NFC with CPI >
Correlation (HNO + NFC) with CPI
Figure 1. Data Combinations for HNO/NFC Credit Correlations with CPI Inflation 4Q 1976 – 1Q 1980
The data interpretation in Figure 1 is problematic. To be consistent with the two hypotheses, data points falling below R = 0 should recognize that when C is more negative than D, the situation is logically equivalent to C being more positive than D when R > 0.
This problem is resolved when absolute values are used:
|Correlation (HNO + NFC) with CPI| >
|The sum of 0.28 Correlation HNO with CPI + 0.78 Correlation NFC with CPI|
and
|The sum of 0.28 Correlation HNO with CPI + 0.78 Correlation NFC with CPI| >
|Correlation (HNO + NFC) with CPI|
Figure 2. Alternative Data Treatment for HNO/NFC Credit Correlations with CPI Inflation 4Q 1976 – 1Q 1980
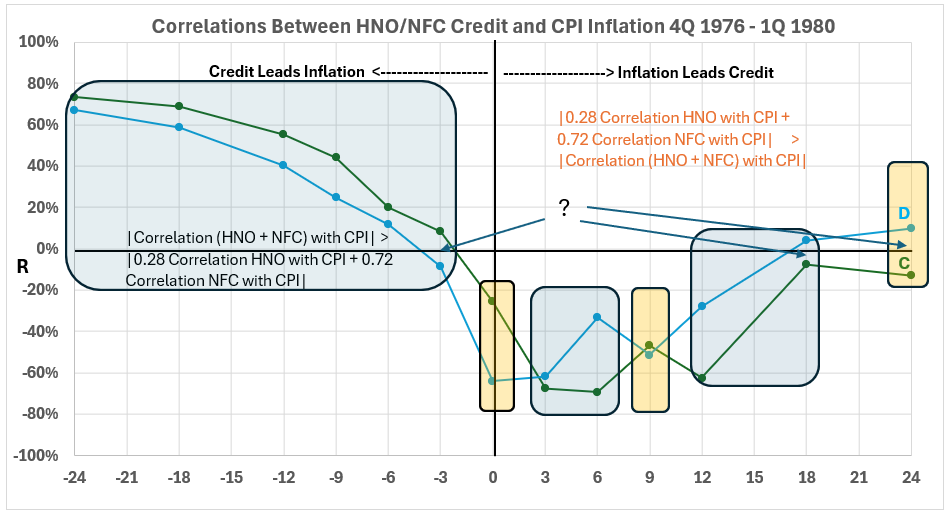
Now, there is a new problem. Three data pairs are straddling the zero line. How should these be handled? I have no suggestions at this point.
The data is summarized in Table 1.
Table 1. Correlation Comparisons HNO/NFC with CPI 4Q 1976 – 1Q 1980
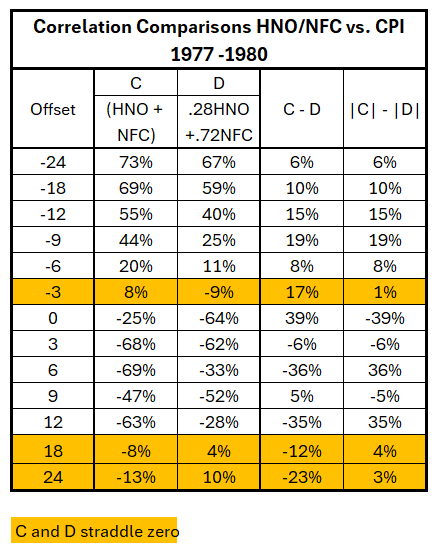
Six of the ten results for data pairs not straddling zero have double-digit differences. This suggests that there may be significant inflation of correlations of HNO and NFC with inflation via compounding the result for one with feedthrough from the other. This is a change from the analysis last week.
Conclusion
Further analysis requires calculating each element in each correlation determination and then sorting these for each of the combinations under study. Such a process could verify or reject our hypotheses, but the level of complexity is offputting at this point.3 We will continue to assess the relative magnitudes of various associations, recognizing that the associations are not of value in determining cause and effect. However, they do provide information about what cause and effect are not.
Next week, we will determine the relative magnitudes of the correlations between changes in quantities of money and subsequent changes in consumer inflation.
Footnotes
1. Lounsbury, John, “Quantity of Money and Inflation. Part 4. Confounding for HNO and NFC Associations with CPI”, EconCurrents, July 28, 2024. https://econcurrents.com/2024/07/14/quantity-of-money-and-inflation-part-2-confounding/.
2. Lounsbury, John, “Quantity of Money and Inflation. Part 3. More About Confounding”, EconCurrents, July 21, 2024. https://econcurrents.com/2024/07/21/quantity-of-money-and-inflation-part-3-more-about- confounding/.
3. Freedman, David, Pisani, Robert, Purves, Robert, “Statistics, Fourth Edition,” W.W. Norton & Company, New York; Viva Books, New Delhi, 2009. Chapter 8, Correlation, pp 132-4.