Previous results1 show that during a specific inflation surge, Household and Nonprofit Organization (HNO) Credit changes and Nonfinancial Corporate (NFC) Debt changes are correlated with each other and with subsequent CPI inflation changes. In such situations, confounding of associations are possible.

Introduction
Confounding of associations2 can occur when a factor in addition to the factor studied for correlation with a result is correlated to both the study factor and the result. Such a situation is possible for measured associations for HNO and NFC with CPI.3
Figure 1. Three Variable Correlations for HNO, NFC, and CPI 1976-80
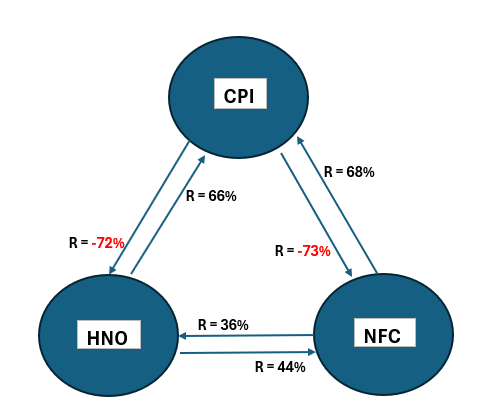
Figure 1 from last week3 shows that a positive correlation of NFC with HNO might “feed through” to increase the correlation with CPI due to HNO only. The same “feed through” effect might occur for HNO when measuring the correlation of NFC with CPI. If such confounding effects occur, the calculated association total for HNO and NFC would have a double counting of associations. To wit:
- Due to NFC’s correlation with HNO, the association calculated for HNO with CPI could increase.
- Due to HNO’s correlation with NFC, the association calculated for NFC with CPI could increase.
Thus, when adding the two associations, the total could double-count contributions from either HNO or NFC (or both).
To show if such confounding might occur for the inflation surge 4Q 1976 to 1Q1980, we propose the following hypothesis:
- The correlations between HNO and NFC are not spurious, there is cause and effect. In that case, the summation of the weighted associations with CPI for the two variables will equal the association between CPI and the sum of the two variables, changed only by the occurrence of new spurious correlations.
- Suppose spurious association contributions are within one or both HNO and NFC associations. In that case, the summation of the weighted associations with CPI for the two variables will be greater than the association between CPI and the sum of the two variables unless new spurious associations of sufficient magnitude arise.
Data
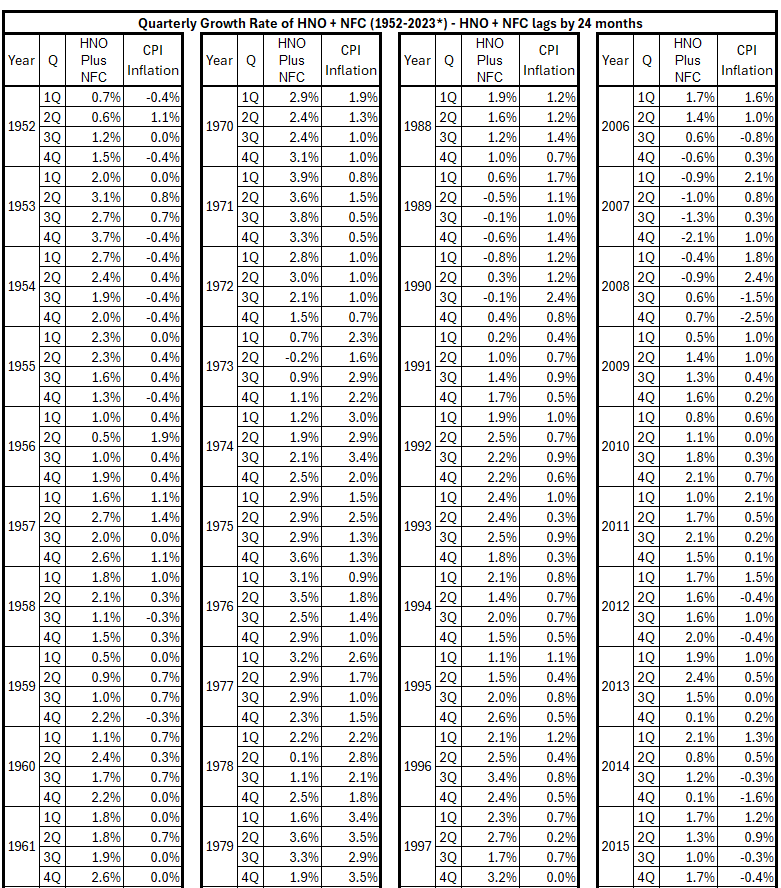
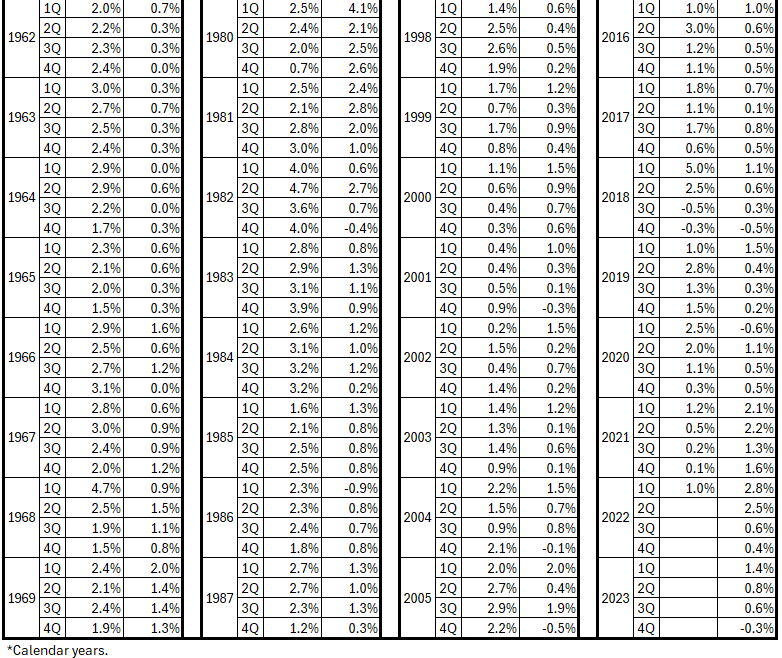
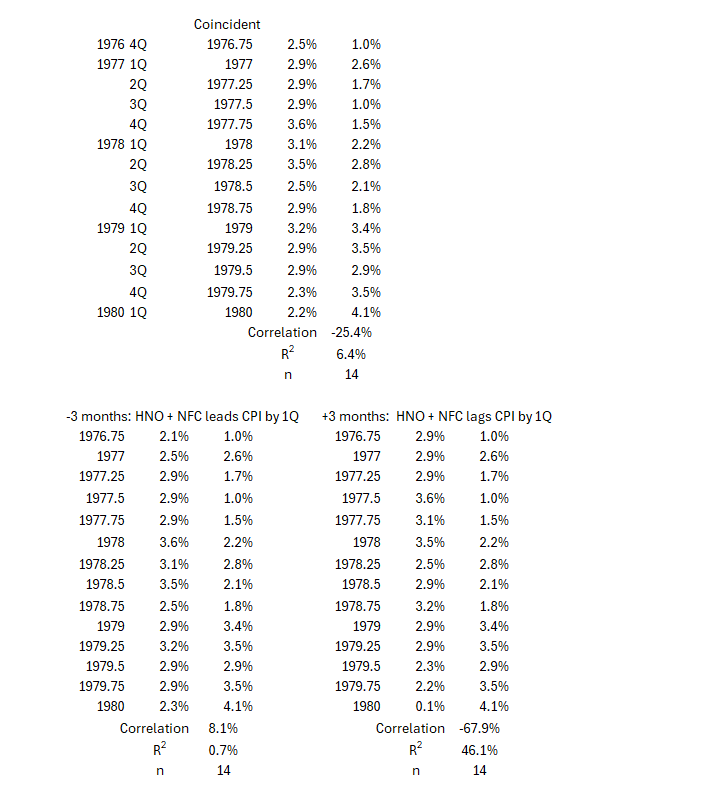
Last week,3 the timeline table was shown for the coincident timelines between (HNO + NFC) changes and CPI. Below are the timeline tables with offsets of ±3, ±6, ±9, ±12, ±18, ±24 months.
Table 1. (HNO+NFC) Changes and Inflation (CPI), (HNO+NFC) Leads by 3 Months, 1952-2023*
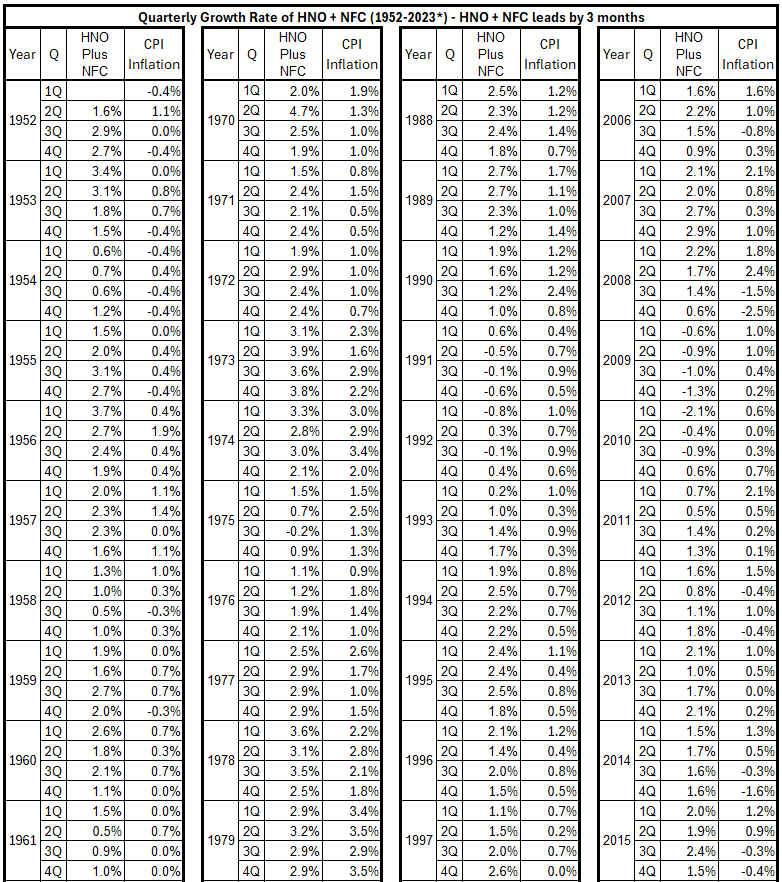

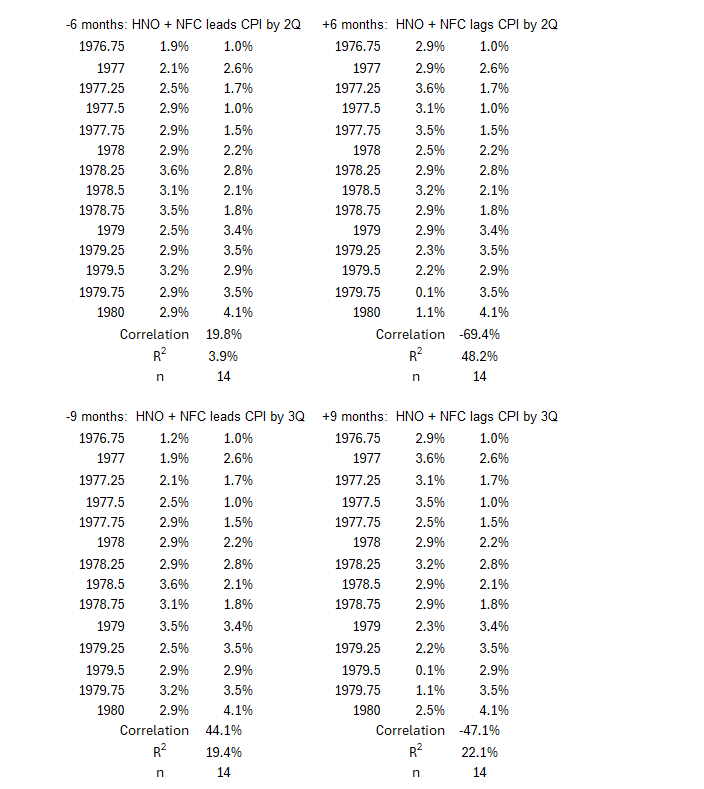
Table 2. (HNO+NFC) Changes and Inflation (CPI), (HNO+NFC) Leads by 6 Months, 1952-2023*
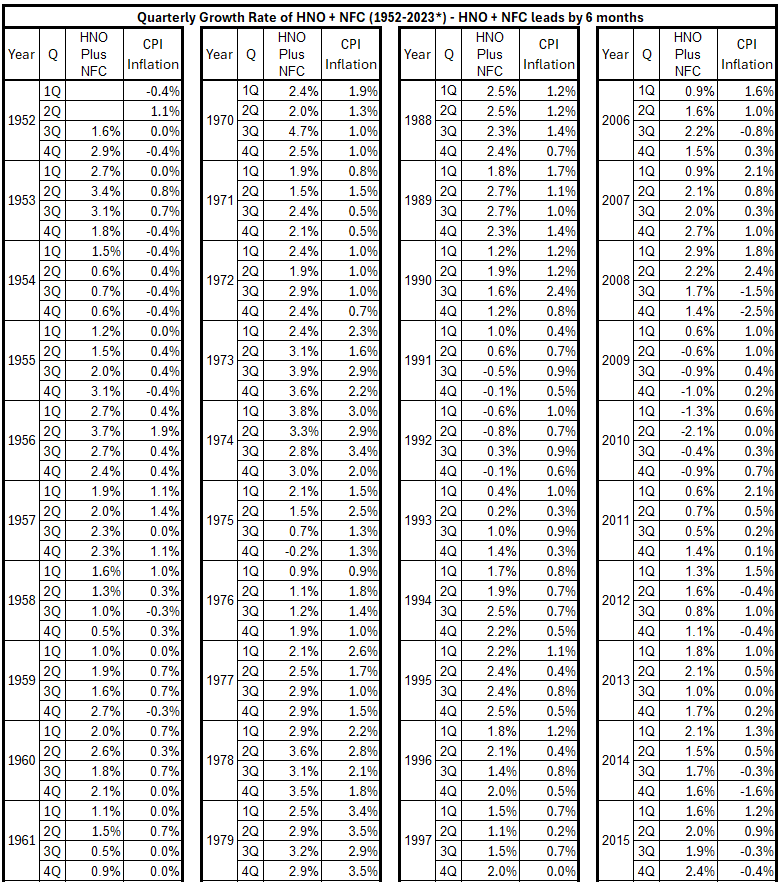
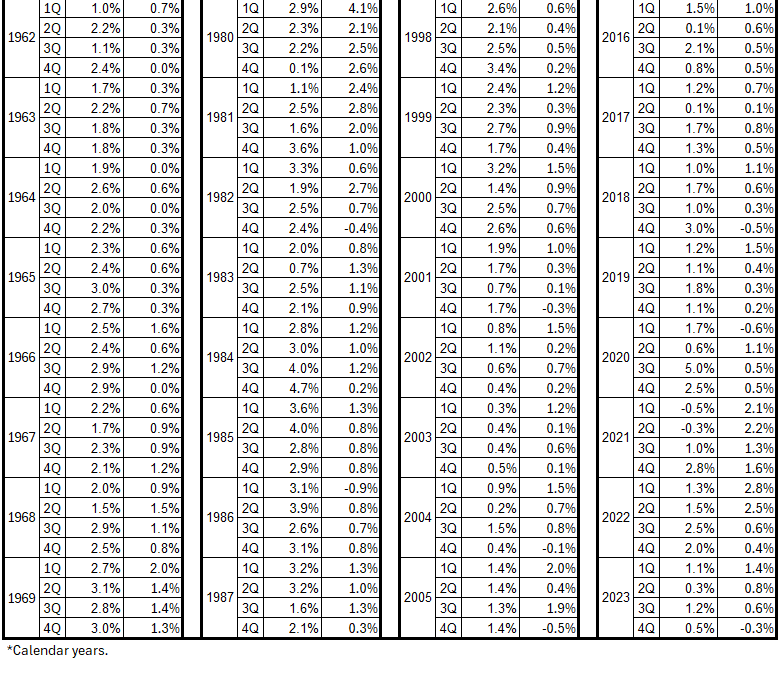
Table 3. (HNO+NFC) Changes and Inflation (CPI), (HNO+NFC) Leads by 9 Months, 1952-2023*
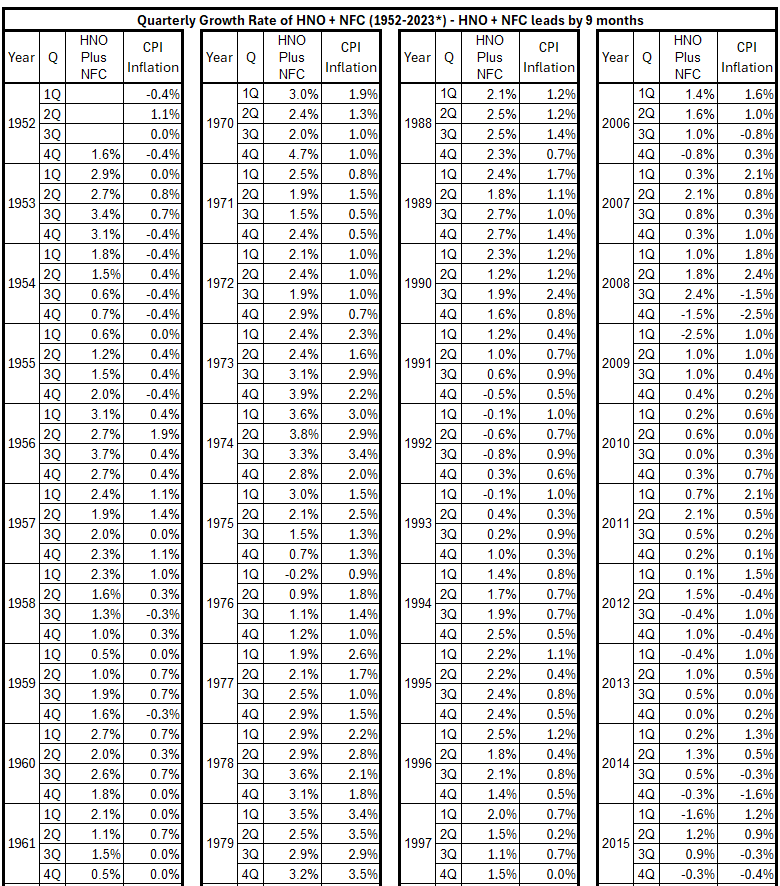
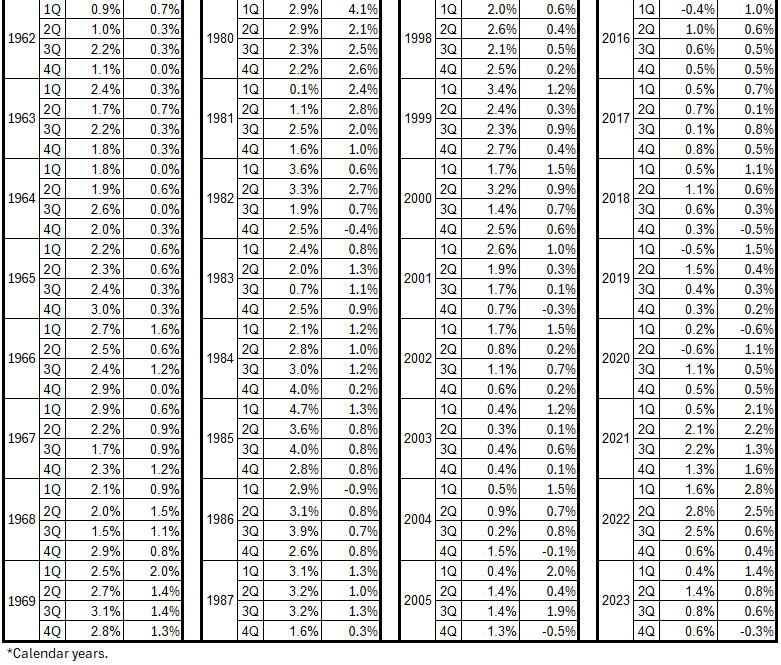
Table 4. (HNO+NFC) Changes and Inflation (CPI), (HNO+NFC) Leads by 12 Months, 1959-2023*
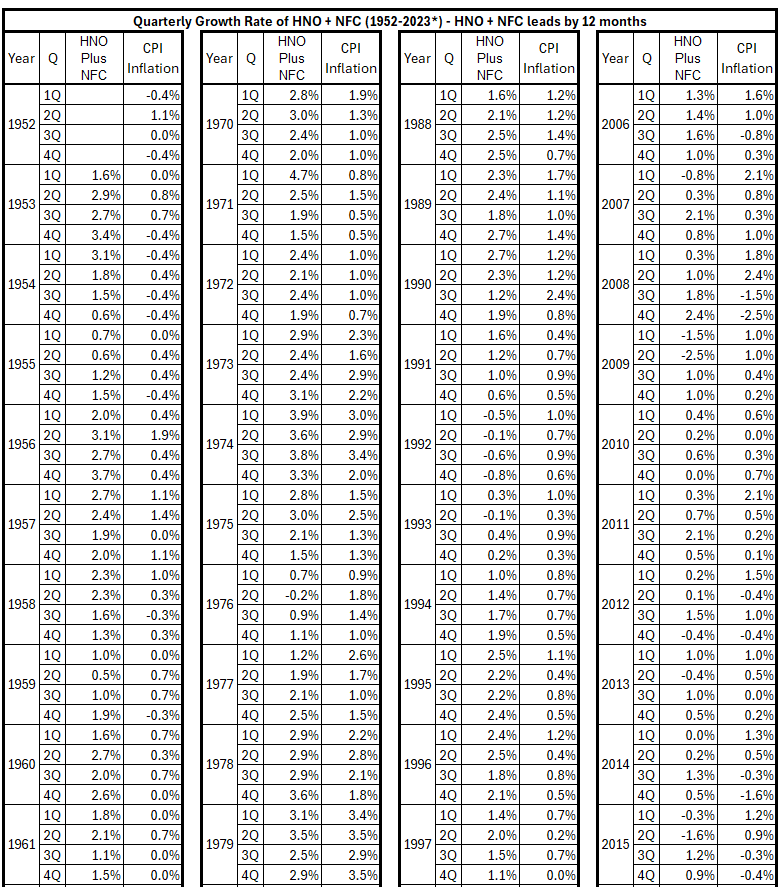

Table 5. (HNO+NFC) Changes and Inflation (CPI), (HNO+NFC) Leads by 18 Months, 1959-2023*
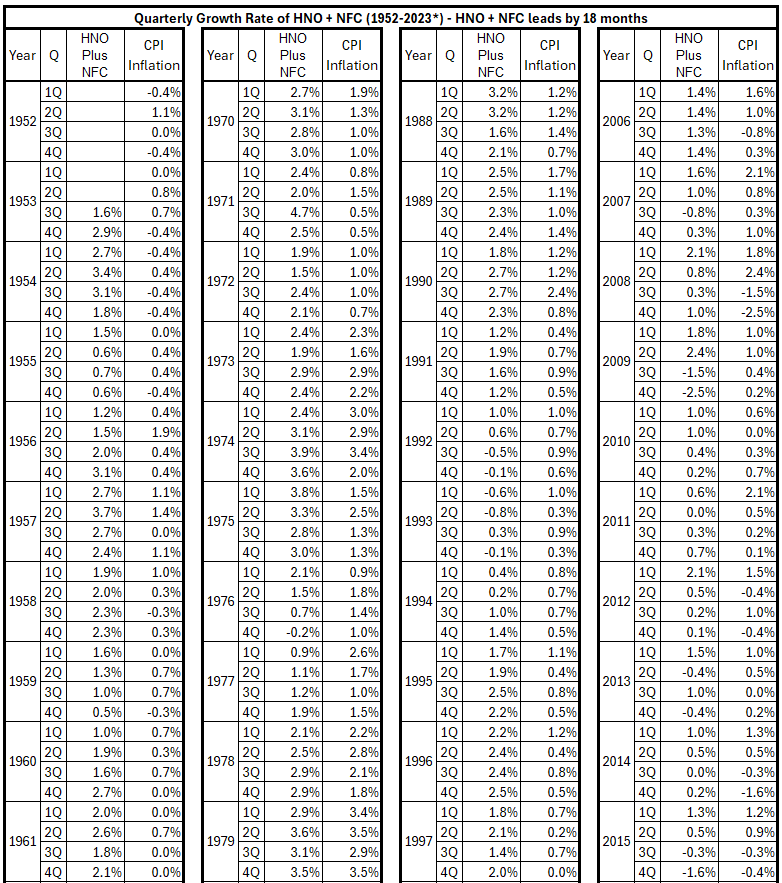

Table 6. (HNO+NFC) Changes and Inflation (CPI), (HNO+NFC) Leads by 24 Months, 1959-2023*
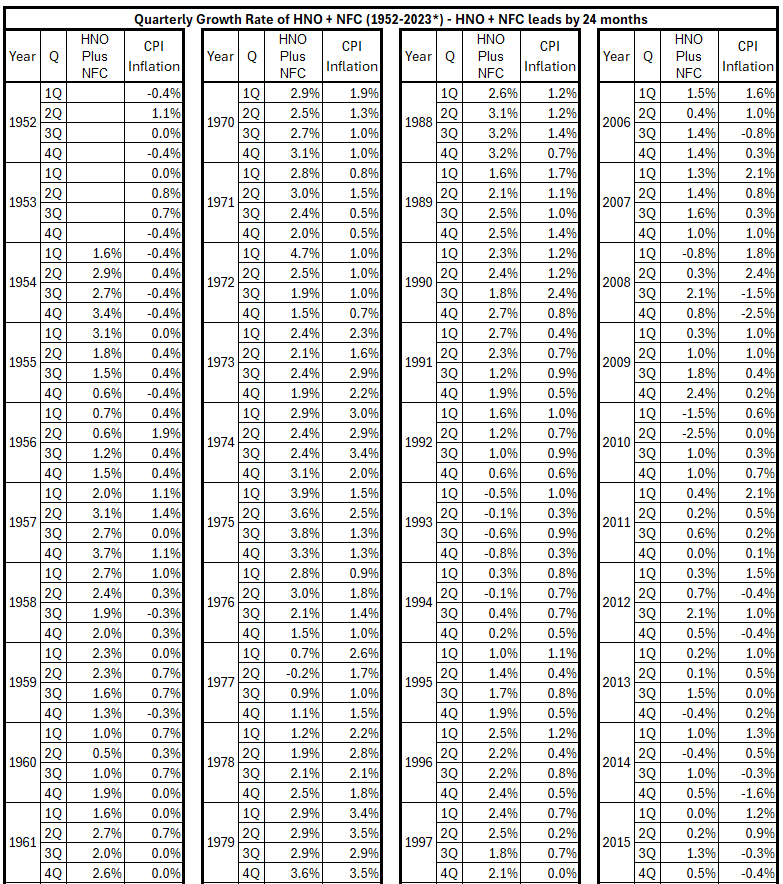

Table 7. (HNO+NFC) Changes and Inflation (CPI), (HNO+NFC) Lags by 3 Months, 1959-2023*
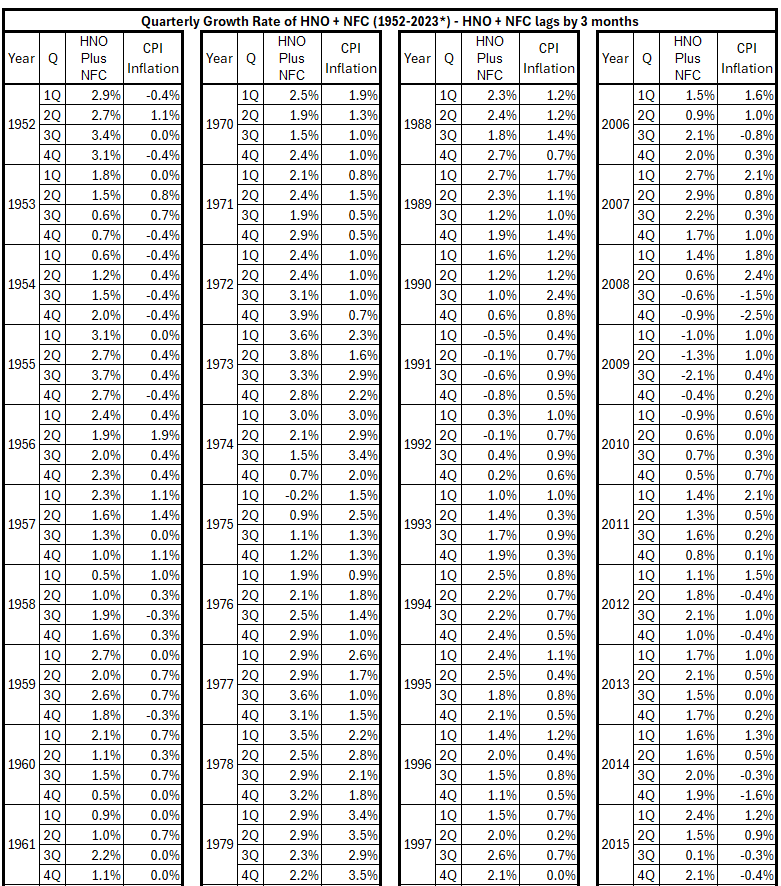

Table 8. (HNO+NFC) Changes and Inflation (CPI), (HNO+NFC) Lags by 6 Months, 1959-2023*
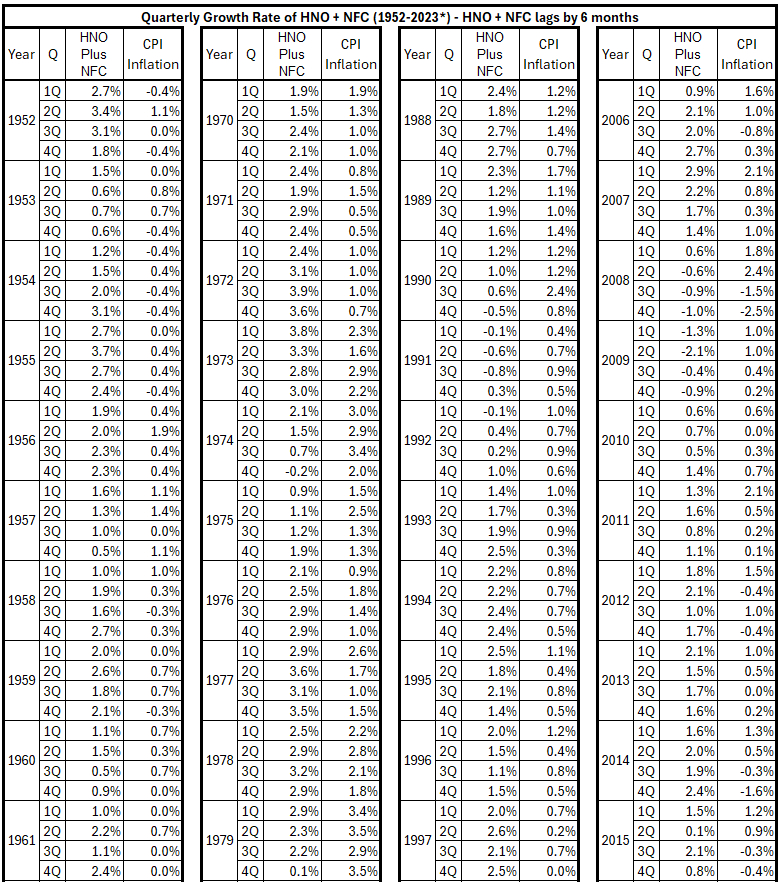

Table 9. (HNO+NFC) Changes and Inflation (CPI), (HNO+NFC) Lags by 9 Months, 1959-2023*
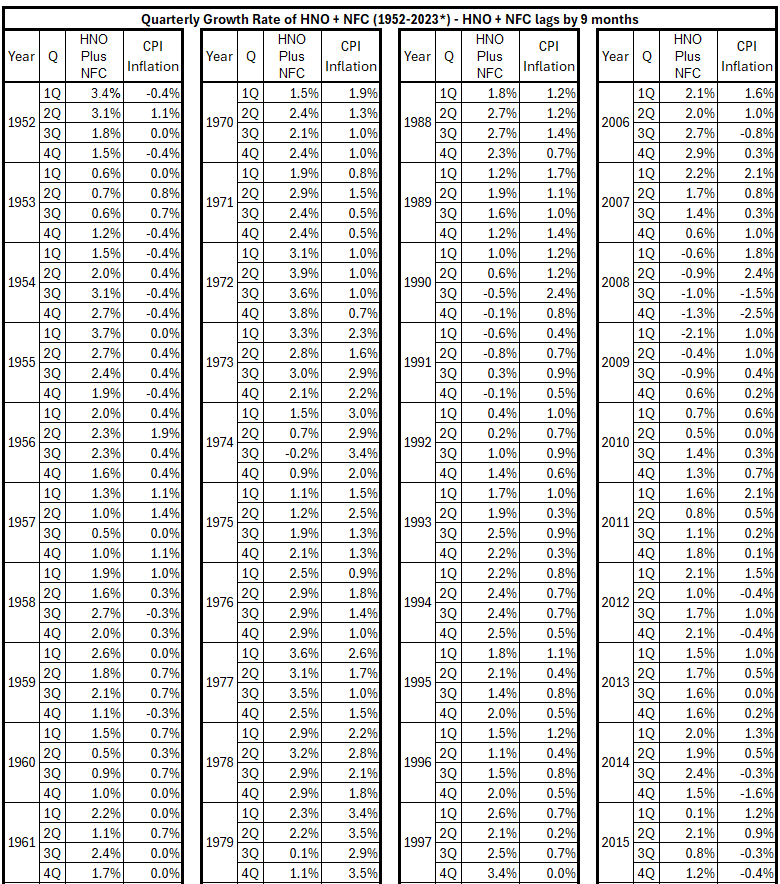
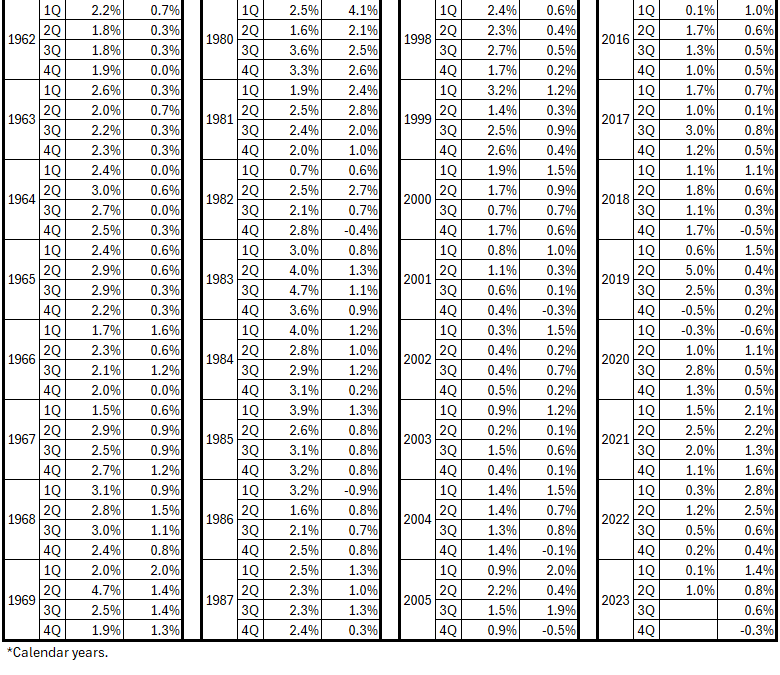
Table10. (HNO+NFC) Changes and Inflation (CPI), (HNO+NFC) Lags by 12 Months, 1959-2023*
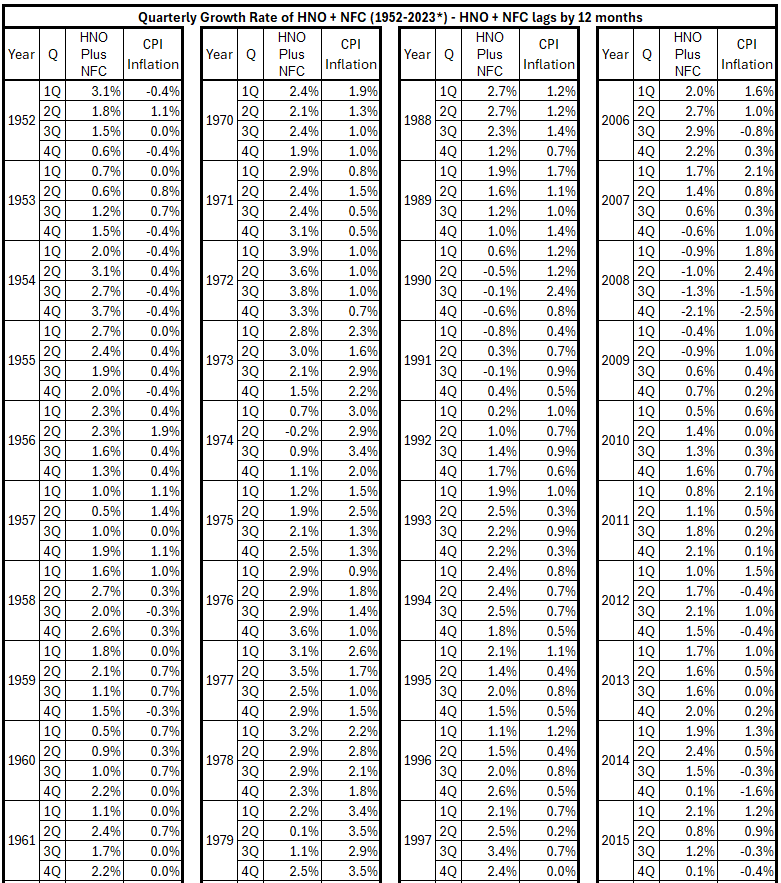
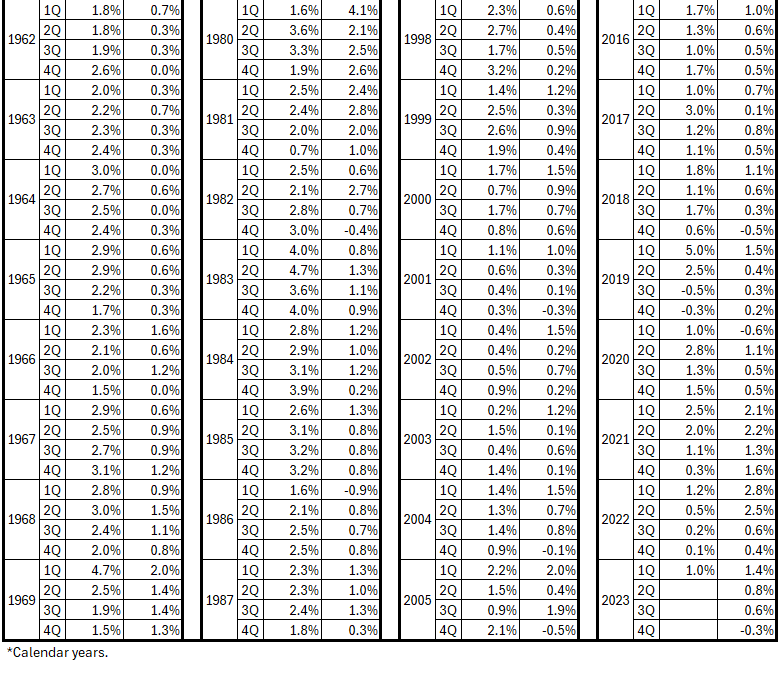
Table 11. (HNO+NFC) Changes and Inflation (CPI), (HNO+NFC) Lags by 18 Months, 1959-2023*
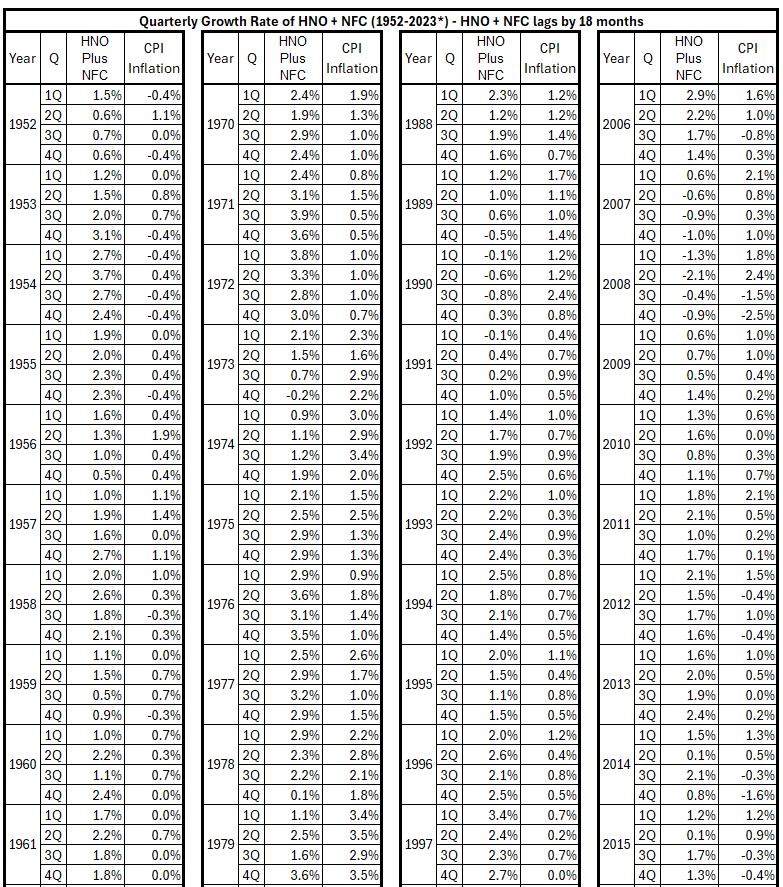
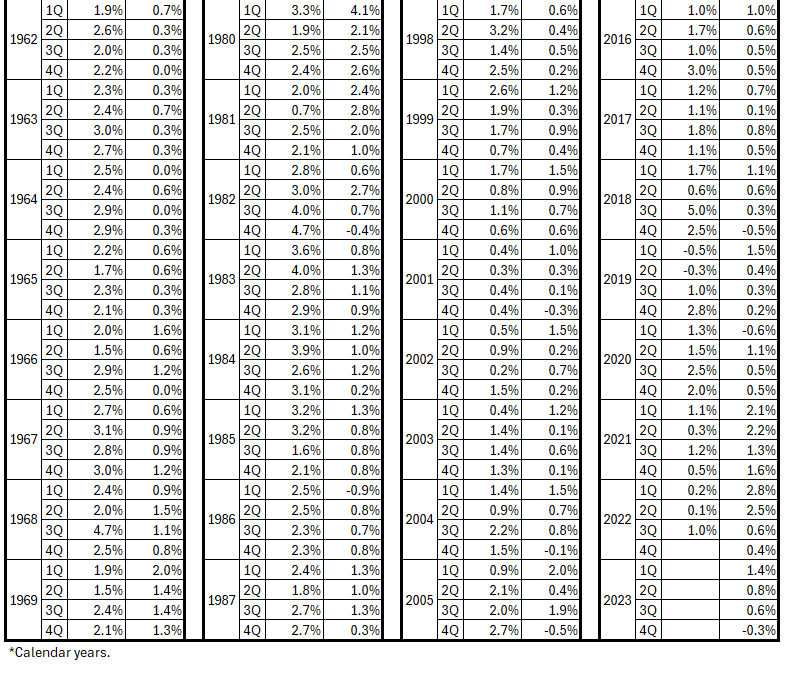
Table 12. (HNO+NFC) Changes and Inflation (CPI), (HNO+NFC) Lags by 24 Months, 1959-2023*
Analysis
The inflation surge from 4Q 1976 to 1Q1980 produces the following results:
Figure 2. (HNO + NFC) Credit and Inflation 4Q 1976 – 1Q 1980
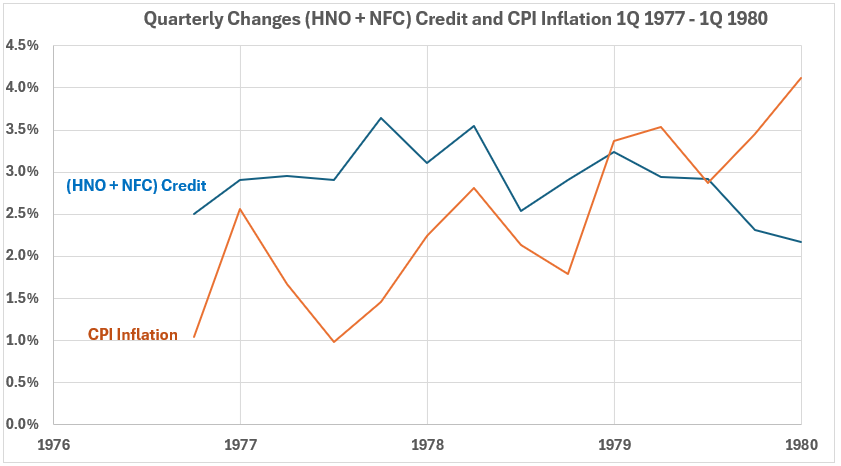
Figure 3. Quarterly Changes in (HNO + NFC) Credit (x) vs. CPI Inflation (y) 4Q 1976 – 1Q 1980
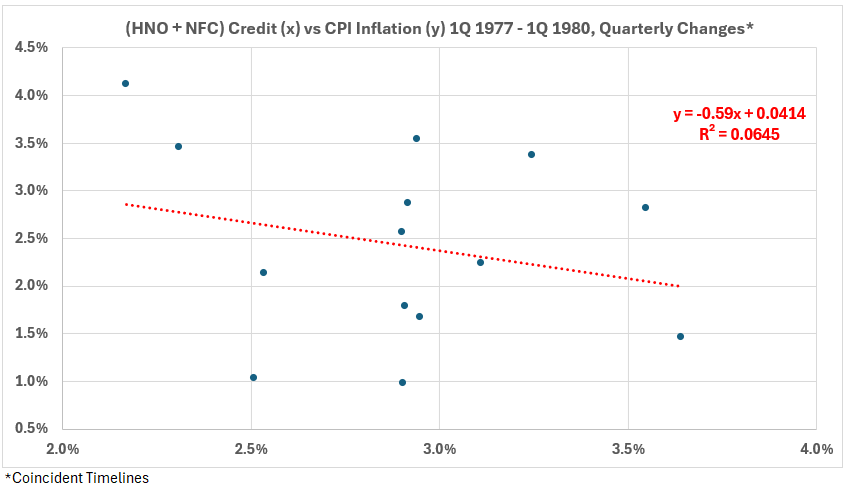
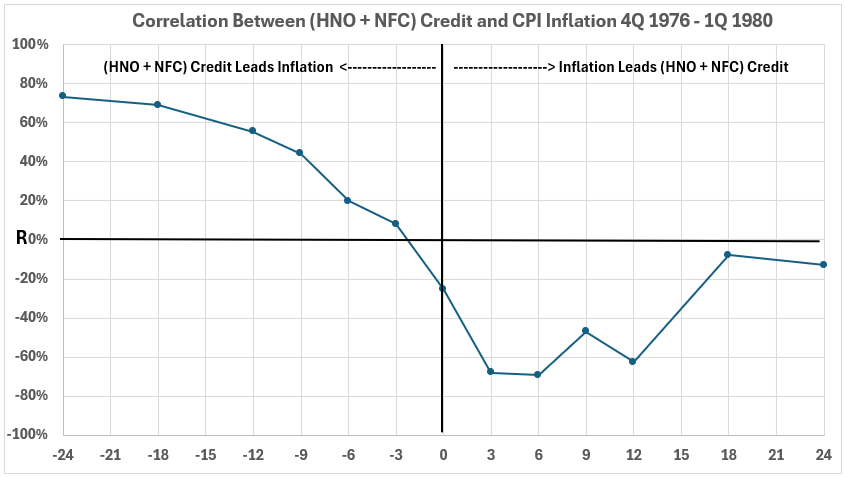
Figure 4. Correlation Between (HNO + NFC) Credit and CPI Inflation 4Q 1976 – 1Q 1980
The correlation charts for HNO and FNC are below for comparison.
Figure 5. Correlation Between HNO Credit and CPI Inflation 4Q 1976 – 1Q 1980
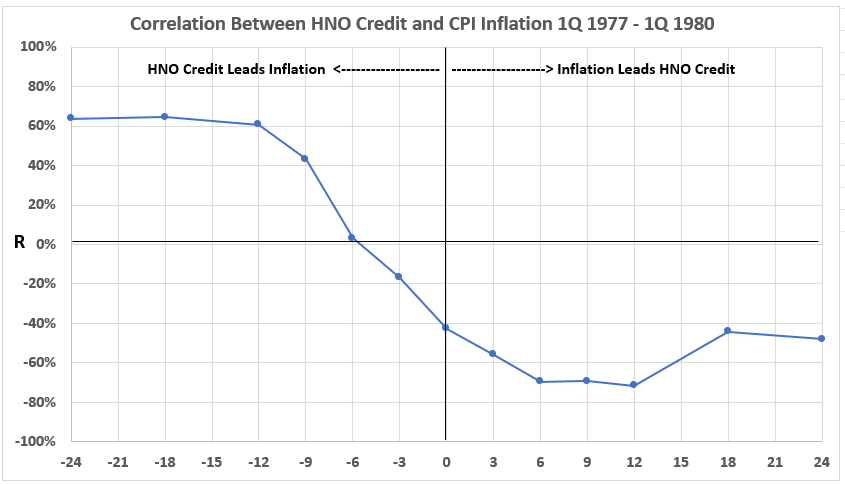
Figure 6. Correlation Between NFC Debt and CPI Inflation 4Q 1976 – 1Q 1980
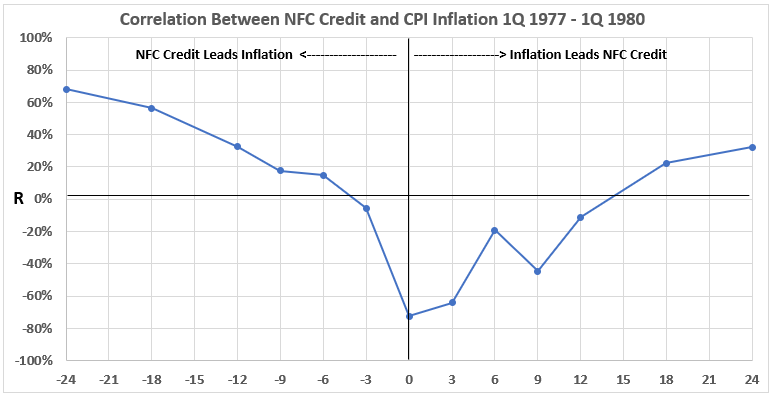
The comparison of Figures 4, 5, and 6 shows that the correlation diagram for (HNO + NFC) appears to be an average of the diagrams for HNO and NFC.
Table 13 shows the weighted sums3 of the individual correlations for HNO and NFC with CPI.
Table 13. Weighted Sums of HNO and NFC Correlations With CPI
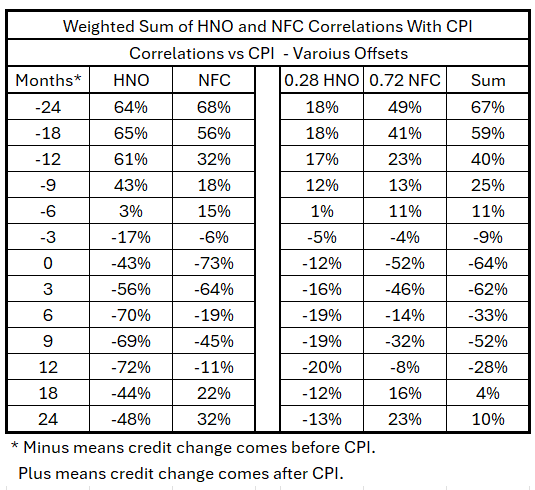
Figure 7 shows the various correlation plots involved in the current confounding assessment.
Figure 7. Looking for Confounding – HNO and NFC Associated With CPI
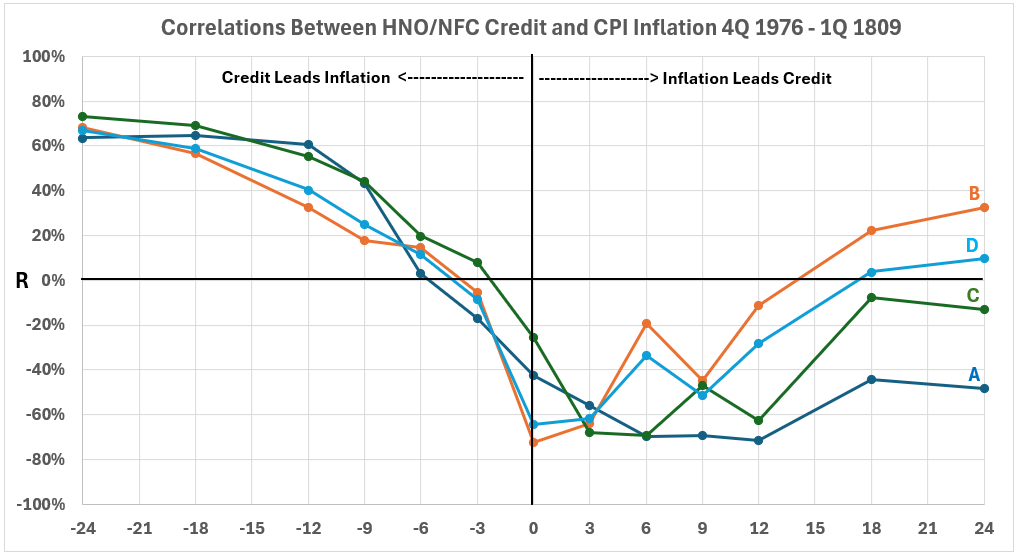
In Figure 7, the correlation plots are:
A = HNO
B = NFC
C = (HNO + NFC)
D = 0.28HNO + 0.72NFC
The differences between the four plots are relatively small on the left side of the graph. According to the hypothesis, if confounding exists, it is not a dominant factor.
The story is different on the right side of the graph. Confounding may be more significant for the association of CPI with subsequent credit changes. We will not consider that further at this time since our focus is the association of credit changes with subsequent inflation.
Conclusion
This example did not reveal major confounding for household and nonprofit organization (HNO) credit and nonfinancial corporate (NFC) debt associations with subsequent CPI inflation during the 1976-1980 inflation surge. That does not mean confounding cannot occur for other sources of money creation and at other times. However, for the time being, we will proceed to assessments of the relative stengths of associations with subsequent infation for the various categories of money creation.
Appendix
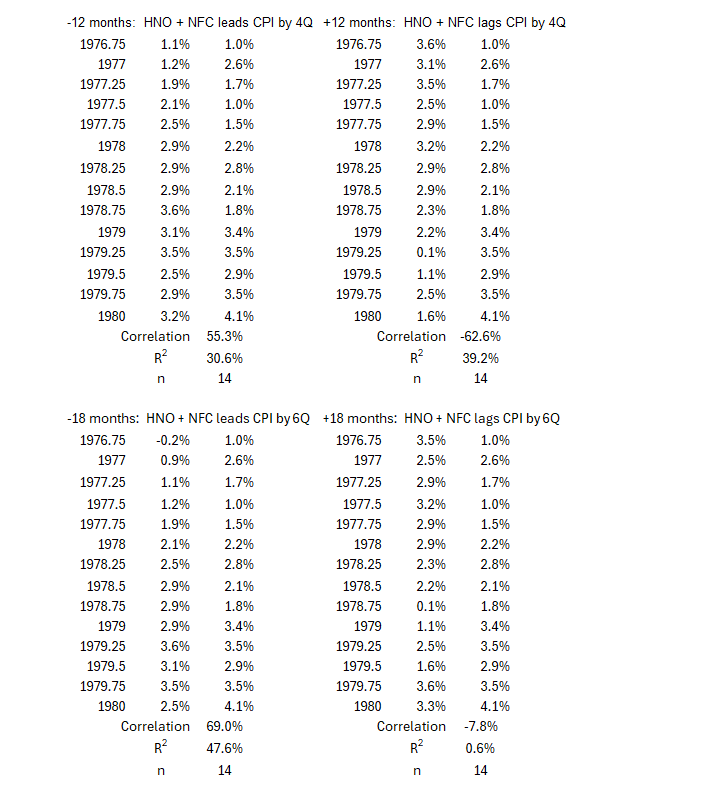
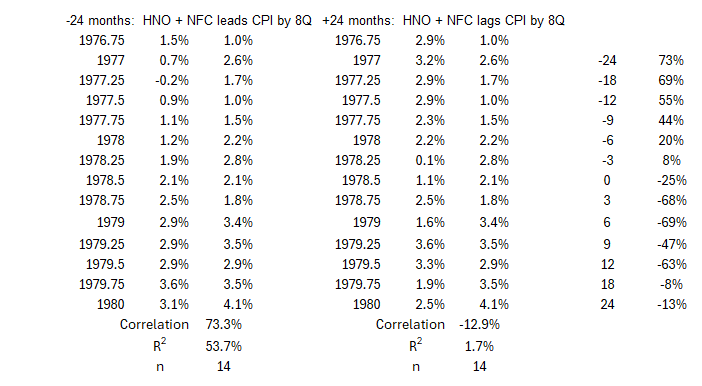
The following data is from the timeline tables in the article for the inflation surge from 4Q 1976 to 1Q 1980.
Footnotes
1. Lounsbury, John, “Quantity of Money and Inflation. Part 2. Confounding”, EconCurrents, July 14, 2024. https://econcurrents.com/2024/07/14/quantity-of-money-and-inflation-part-2-confounding/.
2. Freedman, David, Pisani, Robert, Purves, Robert, “Statistics, Fourth Edition,” W.W. Norton & Company, New York; Viva Books, New Delhi, 2009. Chapter 2, Observational Studies.
3. Lounsbury, John, “Quantity of Money and Inflation. Part 3. More About Confounding”, EconCurrents, July 21, 2024. https://econcurrents.com/2024/07/21/quantity-of-money-and-inflation-part-3-more-about- confounding/.