Confounding can be an issue when analyzing the association between quantities of money and inflation. Last week, we looked closely at a possible example of confounding. This week, we consider that example further.

Image by Richard Reid from Pixabay.
Introduction
Previously,1 we suggested that two possible examples of confounding existed:
- The correlation of changes in nonfinancial corporate debt (NFC) with CPI inflation during the inflation surge of 1976-80 might be confounded by changes in household and nonprofit organization debt (HNO).
- The correlation of changes in household and nonprofit organization debt (HNO) with CPI inflation during the inflation surge of 1976-80 might be confounded by changes in nonfinancial corporate debt (NFC).
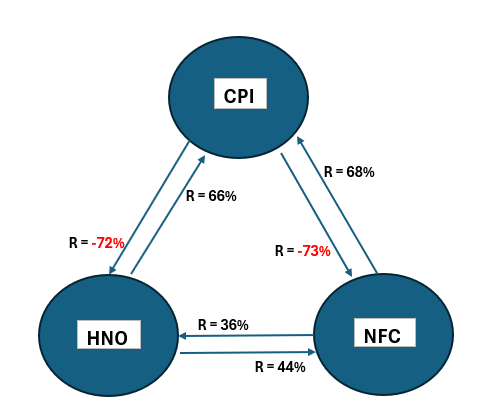
Last week,2 we examined how this confounding might be characterized. The data obtained are summarized in Figure 1.
Figure 1. Three Variable Correlations for HNO, NFC, and CPI 1976-80
From last week:
- The associations displayed are from the analysis section of this post. They are the largest absolute value associations. The directions of the arrows point from the leading data to the lagging data: The arrow from CPI to HNO indicates that CPI changes preceded HNO changes for that data set.
- The illustration here shows that confounding is possible for associations between quantity of money variables and CPI inflation. However, it does not prove that it happens. We are back to the old adage—correlation does not prove causation.
This week, we offer the following hypothesis:
- If the correlations between HNO and NFC are not spurious, there is cause and effect. In that case, the summation of the weighted associations with CPI for the two variables will equal the association between CPI and the sum of the two variables, changed only by the occurrence of new spurious correlations.
- Suppose spurious association contributions are within one or both HNO and NFC associations. In that case, the summation of the weighted associations with CPI for the two variables will be greater than the association between CPI and the sum of the two variables unless new spurious associations of sufficient magnitude arise.
Expressing the two conditions above with equations:
a * Correl (HNO, CPI) + b * Correl (NFC, CPI) = Correl({HNO + NFC}, CPI) + New SA (Eq. 1)
a * Correl (HNO, CPI) + b * Correl (NFC, CPI) > Correl({HNO + NFC}, CPI) (Eq. 2)
where
a = HNO/(HNO + NFC)
b = NFC/(HNO + NFC)
SA = Spurious Associations
Eq. 2 is valid when no new spurious associations arise but may not be valid when they do.
Note: This is a hypothesis because we have not yet proved the relationships from first principles. It is based on the fact that if there is causation, there must be a correlation. However, correlation can exist without causation (circumstantial or spurious correlation). Stated succinctly, correlation is a necessary but not a sufficient condition for causation. We cannot assume this hypothesis is valid without further analysis.
Data
The data used here has been updated as of July 7, 2024. The Fed Fred database is the source for HNO3, NFC4, and CPI.5
Table 1 shows the data for HNO, NFNC, the sum of HNO and NFC
Table 1. Quarterly Data for HNO + NFC 4Q 1951 – 1Q 2024
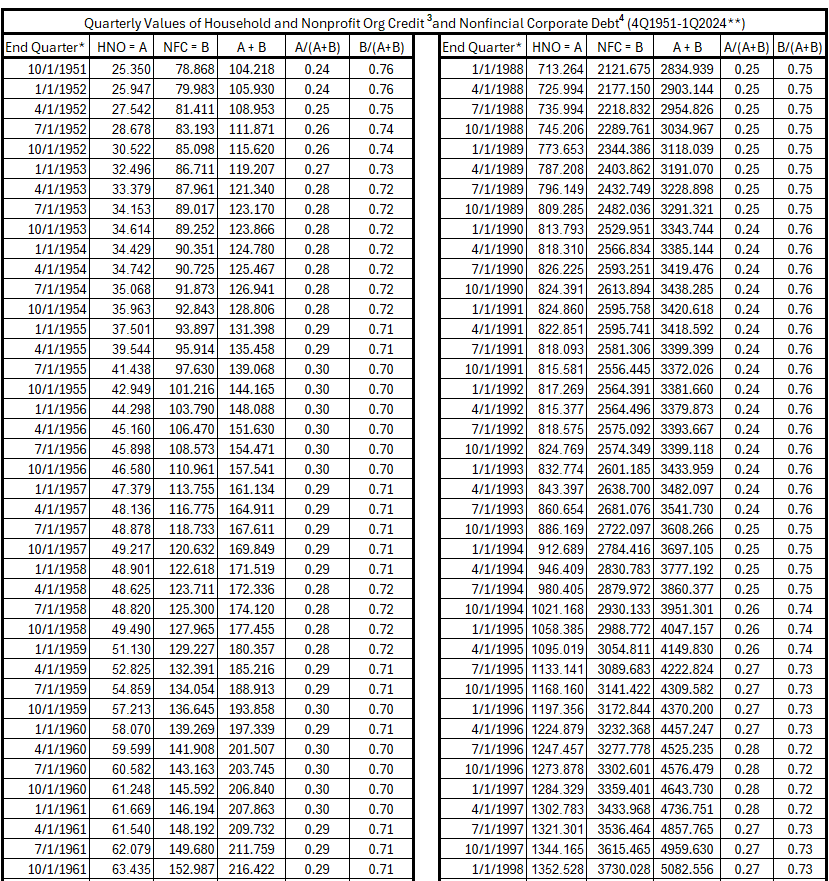
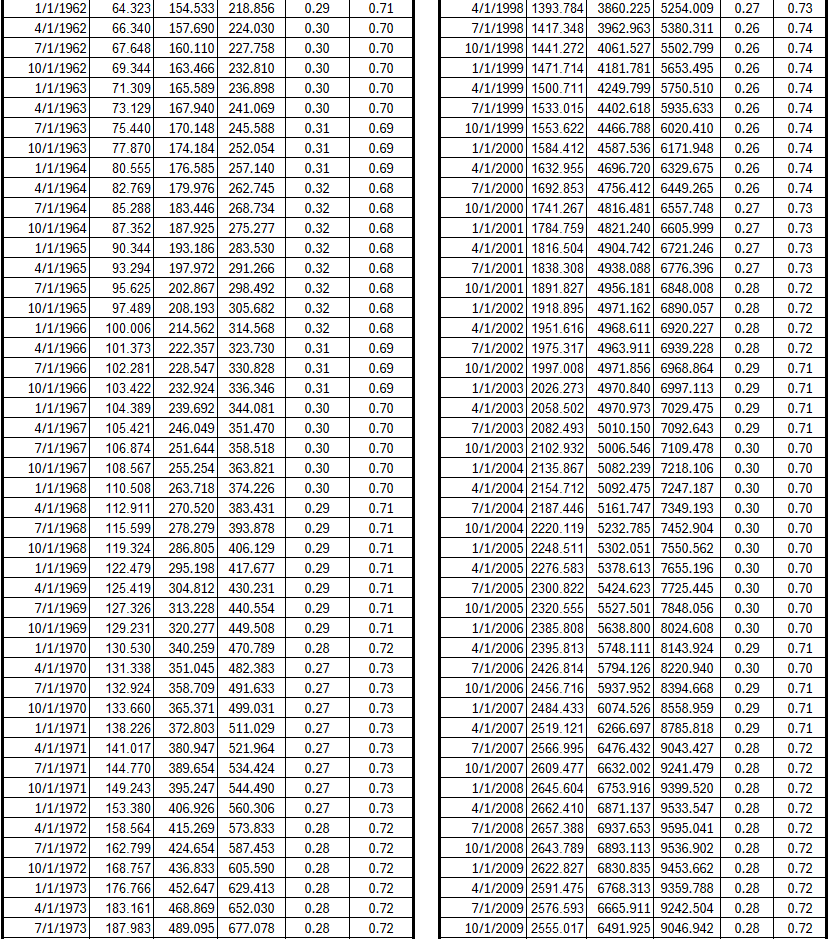
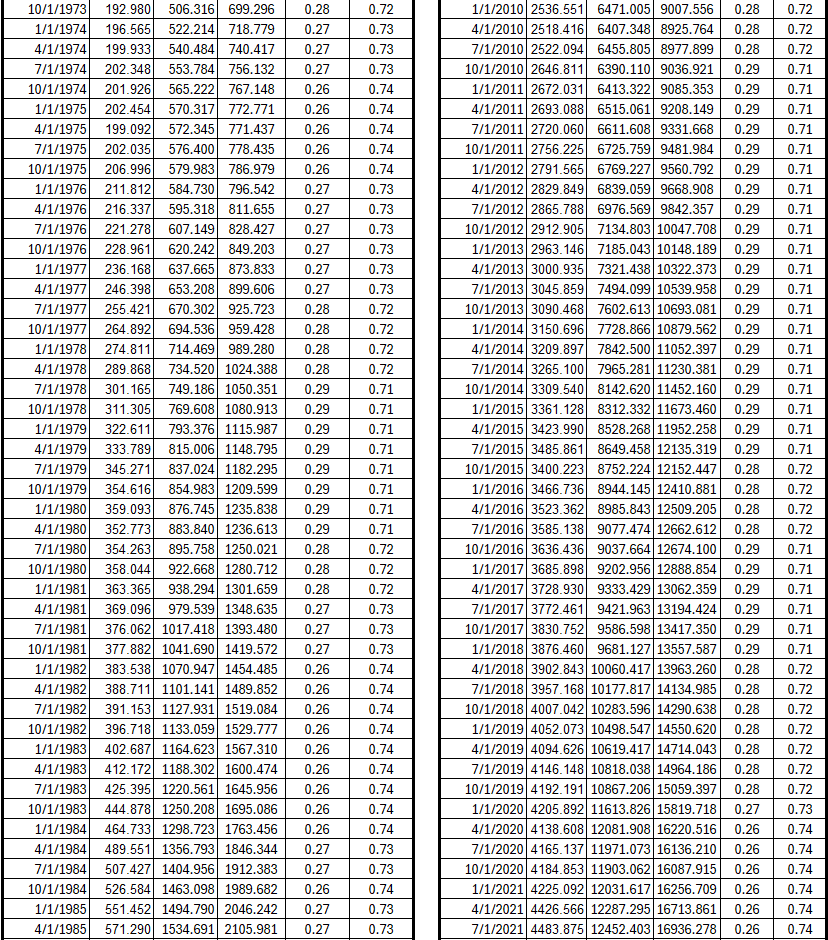

The ratio of each variable to the sum varies in what seems to be a remarkably narrow range over the 72 years. See Figure 2.
Figure 2. HNO as a Fraction of HNO + NFC (4Q 1951 to 1Q 2024)
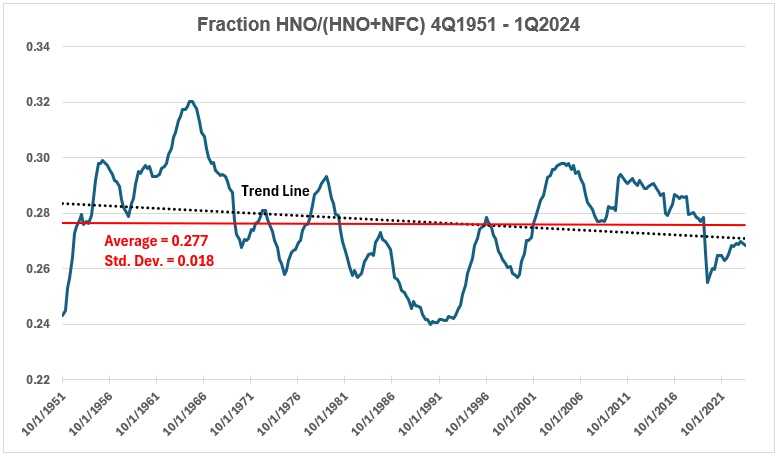
This may make it acceptable to use the average ratio for all inflation intervals to be examined.
Timeline Data
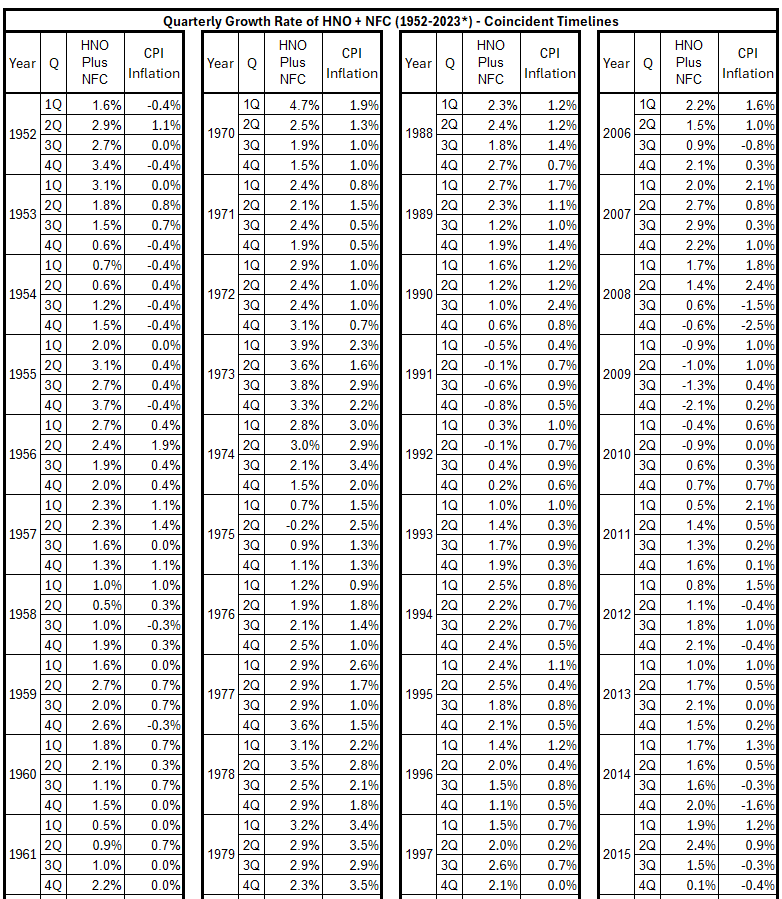
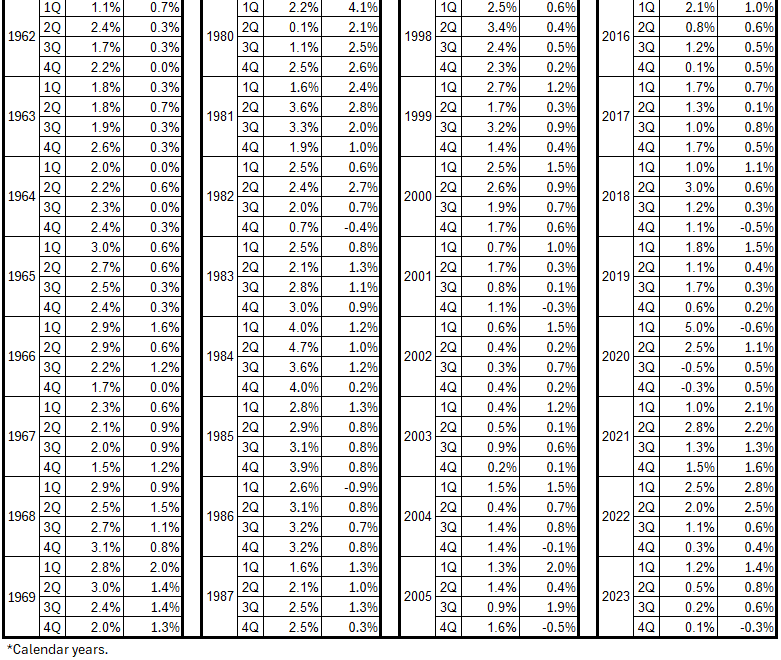
Table 2 below has the data for coincident HNO + NFC and CPI timelines.
Table 2. (HNO + NFC) Growth and Inflation (CPI), Coincident Data, 1952-2023*
Conclusion
The timeline offset data will be completed next week, and hopefully, a deeper look at the nature of confounding with HNO, NFC, and CPI will occur.
Footnotes
1. Lounsbury, John, “Quantity of Money and Inflation. Part 1. General Considerations”, EconCurrents, July 7, 2024. https://econcurrents.com/2024/07/07/quantity-of-money-and-inflation-part-1-general-considerations/.
2. Lounsbury, John, “Quantity of Money and Inflation. Part 2. Confounding”, EconCurrents, July 14, 2024. https://econcurrents.com/2024/07/14/quantity-of-money-and-inflation-part-2-confounding/.
3. Federal Reserve Economic Data, Households and Nonprofit Organizations; Consumer Credit; Liability, Level, HCCSDODNS, Data taken July 7, 2024. https://fred.stlouisfed.org/series/HCCSDODNS.
4. Federal Reserve Economic Data, Nonfinancial Corporate Business; Debt Securities and Loans; Liability, Level, Billions of Dollars, Quarterly, Seasonally Adjusted. Data taken July 7, 2024. https://fred.stlouisfed.org/series/BCNSDODNS.
5. Federal Reserve Economic Data, Consumer Price Index for All Urban Customer: All Items in U.S. City Average, Index 1982-1984 = 100, Monthly, Seasonally AdjustedNonfinancial Corporate Business; Debt Securities and Loans; Liability, Level, Billions of Dollars, Quarterly, Seasonally Adjusted. Data taken July 7, 2024. https://fred.stlouisfed.org/series/CPIAUCSL.