The full data sets for the 64 years from 1959 to 2022 show no discernable association patterns (correlations) for M2 money supply growth and consumer inflation changes.1 This post continues that analysis by looking specifically at the various regimes of inflation change during the 64-year timeline. This article analyzes the association of CPI with M2 during the four periods from 1959 to 2022 with negative inflation changes (disinflation/deflation) surges.

Image by Kevin Schneider from Pixabay
Introduction
The 71 years from 1952 to 2022 are divided into three types of inflationary behavior:1
- Significant inflation increases;
- Significant inflation decreases;
- No significant inflation changes.
An inflation change is significant if it is ≥4.0% with no intervening countertrend change >1.5%.
Previously, we defined the partitioning of inflation into the pattern in Table 1.
Table 1. Timeline of Inflation Data 1952-2022 (Previously Table 4*.1)
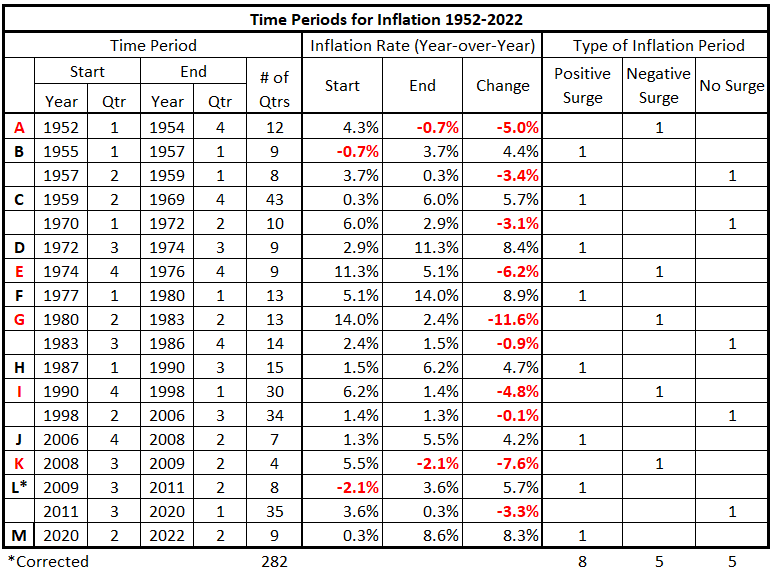
We will examine each category of inflation behavior separately. We previously2analyzed the periods with significantly positive inflation surges. In this piece, we analyze the significantly negative periods of inflation (disinflation and deflation surges).
Data
The data is from Tables 5-17, prepared previously.1
There are 13 quarterly timeline alignments:
- M2 Money Supply and CPI Inflation quarters are coincident.
- M2 Money Supply leads and lags CPI Inflation by one quarter (±3 months)
- M2 Money Supply leads and lags CPI Inflation by two quarters (±6 months)
- M2 Money Supply leads and lags CPI Inflation by three quarters (±9 months)
- M2 Money Supply leads and lags CPI Inflation by four quarters (±12 months)
- M2 Money Supply leads and lags CPI Inflation by six quarters (±18 months)
- M2 Money Supply leads and lags CPI Inflation by eight quarters (±24 months)
Analysis
4Q 1974 -4Q 1976
Figure 1. M2 Money Supply and Inflation 4Q 1974 – 4Q 1976
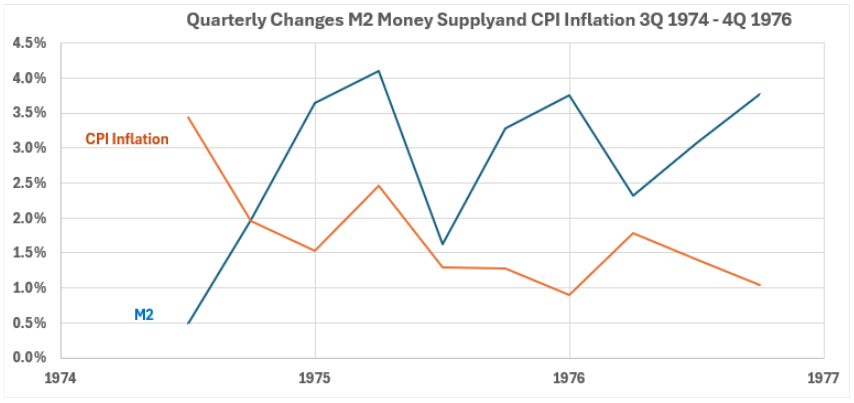
Figure 1 shows a trend of smaller CPI changes during this period. M2 changes increase initially and then are trendless, although with much more volatility than for CPI.
Figure 2. Quarterly Changes in M2 (x) vs. CPI Inflation (y) 4Q 1974 – 4Q 1976
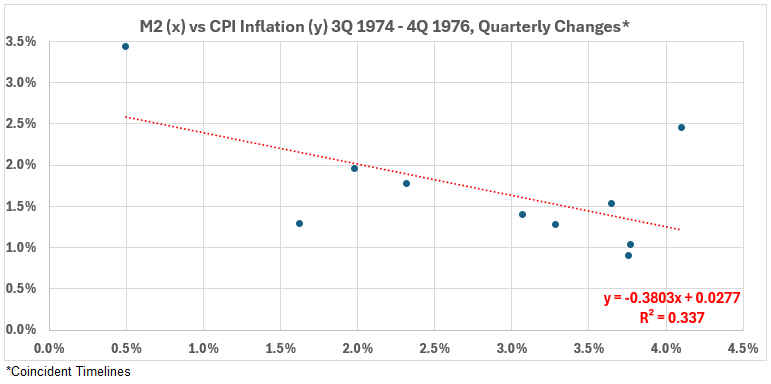
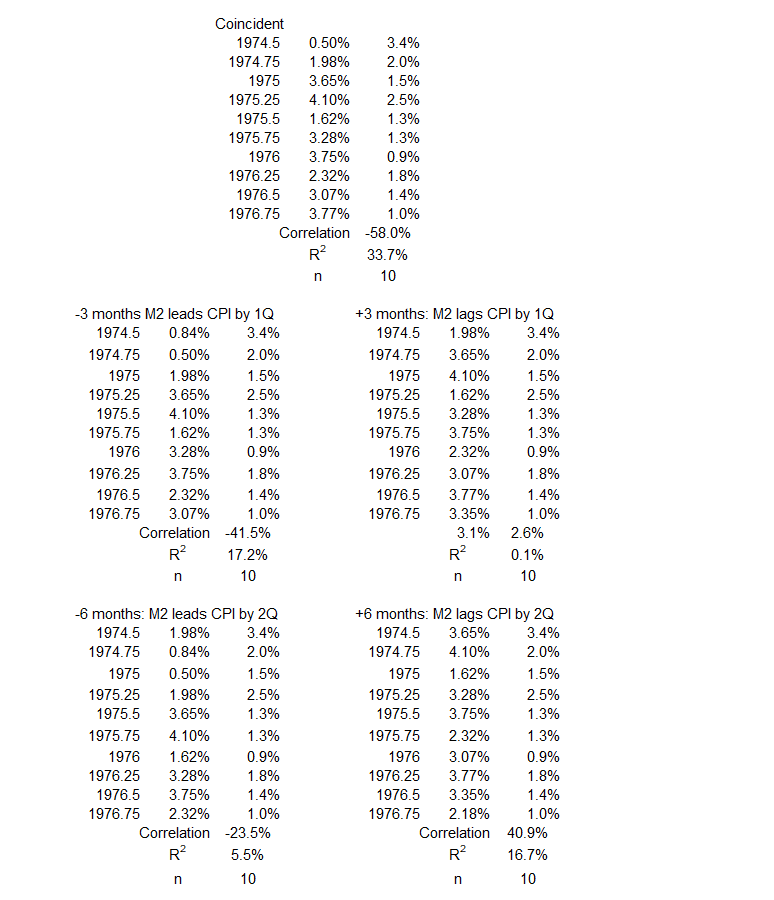
When the data timelines coincide, the overall association between these two variables is moderately negative, R = –58% and R2 = 34%.
Figure 3. Correlation Between M2 and CPI Inflation 4Q 1974 – 4Q 1976
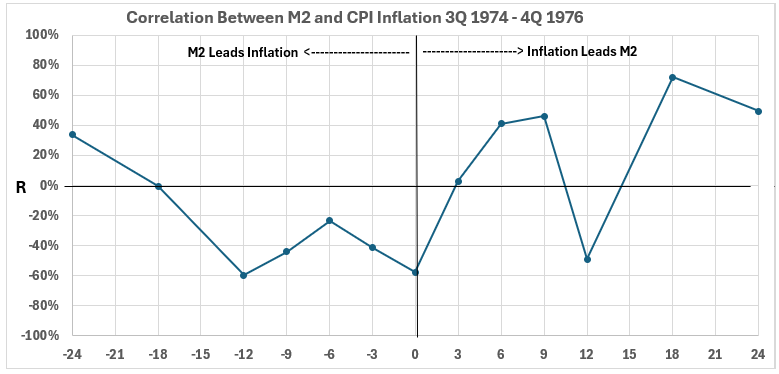
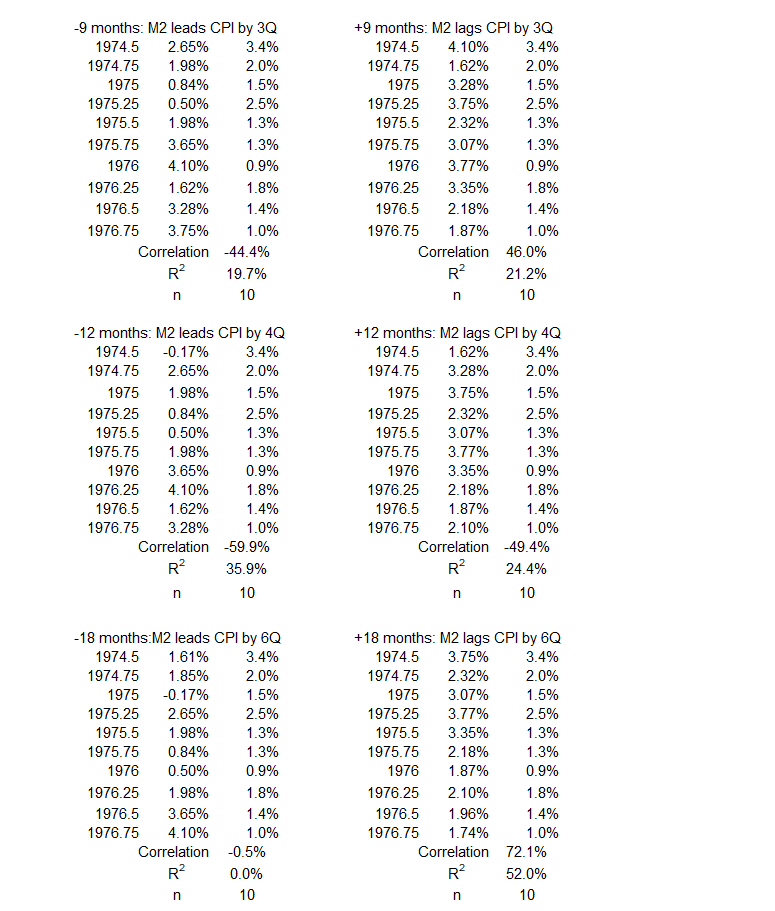
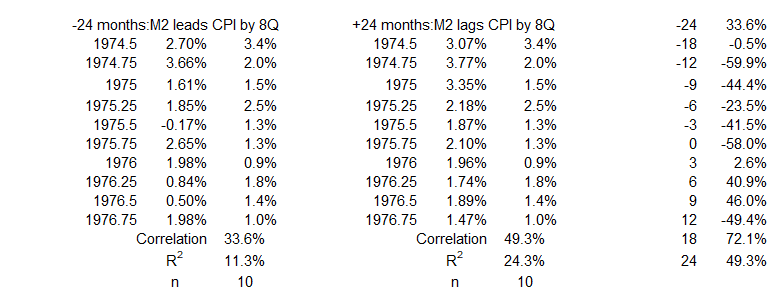
There is a weak to moderate negative association for CPI changes up to 12 months after M2 changes. The association is weakly positive for M2 changes two years before CPI. There is no reasonable mechanism for M2 to cause opposite changes in CPI. So unless the one data point for M2 changes two years before an inflation change is considered, there is no cause-and-effect relationship in this period for M2 changes causing CPI changes.
The right side of Figure 3 tells a mixed story. A negligible association exists between CPI changes and M2 changes three months later. For M2 changes following CPI changes by 6, 9, 18, and 24 months, there are weak, moderate, and strong associations. However, right in the middle, there is a weak (almost moderate) negative association for M2 changes following CPI changes. With this variability, we will not speculate about possible cause-and-effect relationships except to say that they might be possible for CPI changes preceding M2 changes.
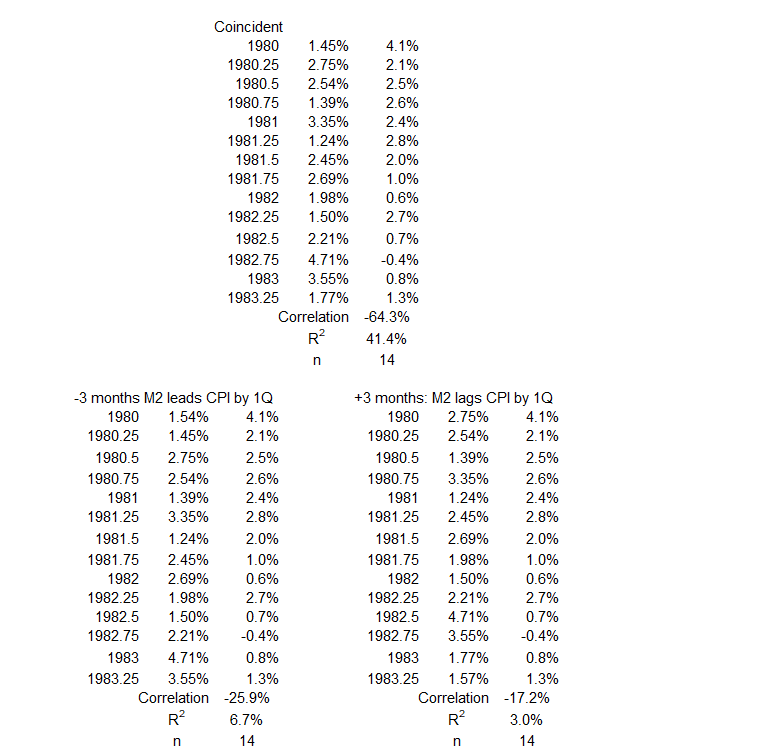
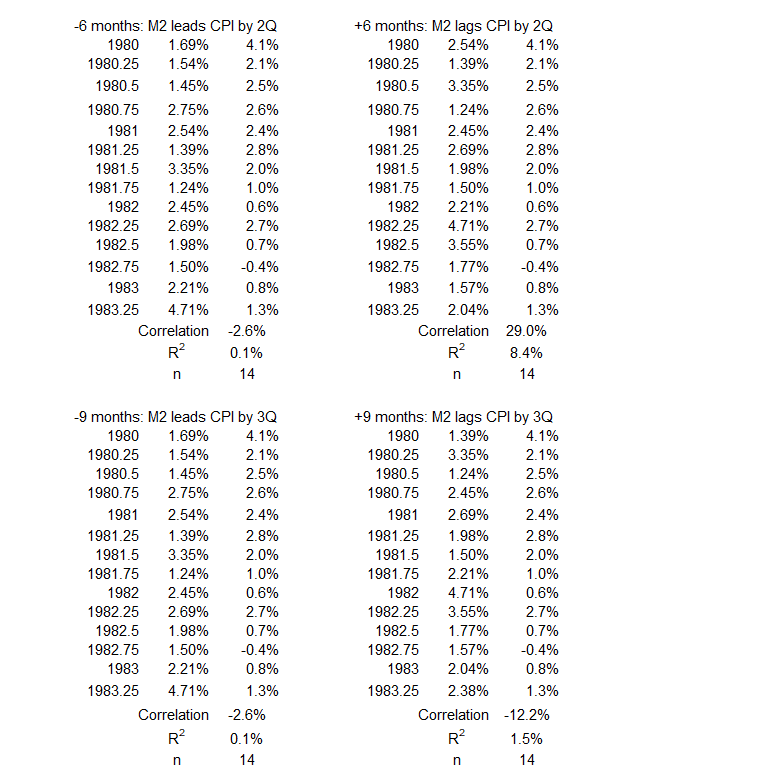
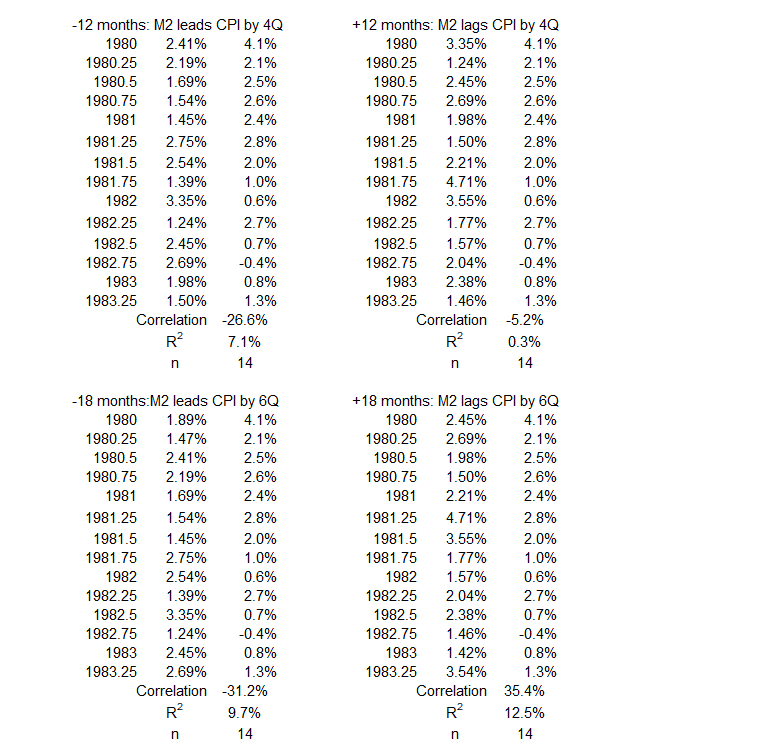
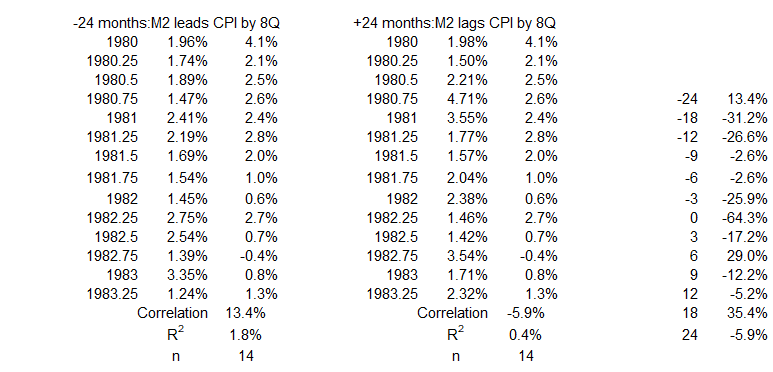
2Q 1980 – 2Q 1983
Figure 4. M2 Money Supply and Inflation 1Q 1980 – 2Q 1983
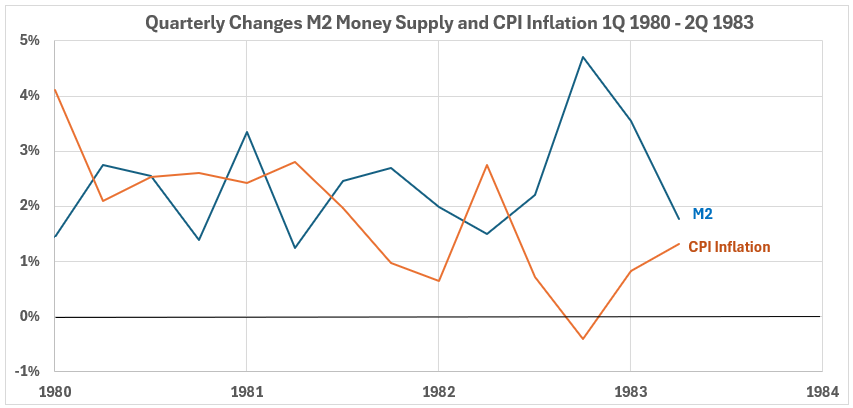
The trend for M2 money supply changes is essentially flat for this period, with a sharp spike up 3Q 1982. The trend for CPI inflation changes is downward, with sharp spikes up 2Q 1982 and down 3Q-4Q 1982. Volatilities for the two variables are relatively similar.
Figure 5. Quarterly Changes in M2 (x) vs. CPI Inflation (y) 1Q 1980 – 2Q 1983
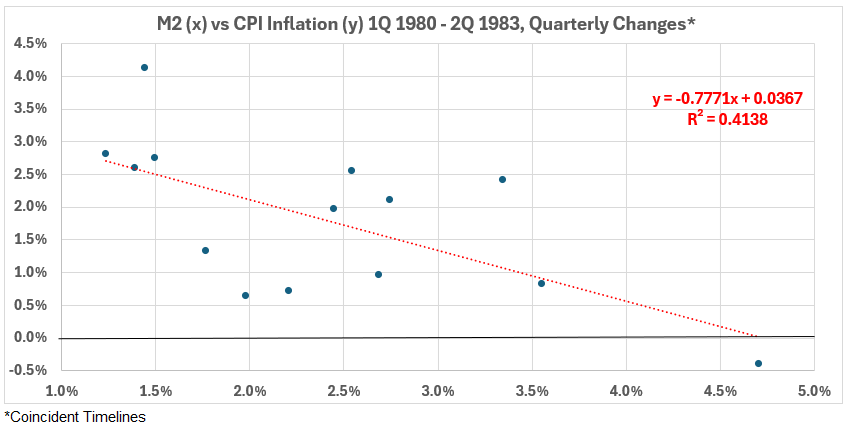
Correlation when the two data timelines coincide is moderately negative, R = –64% and R2 = 41%.
Figure 6. Correlation Between M2 and CPI Inflation 1Q 1980 – 2Q 1983
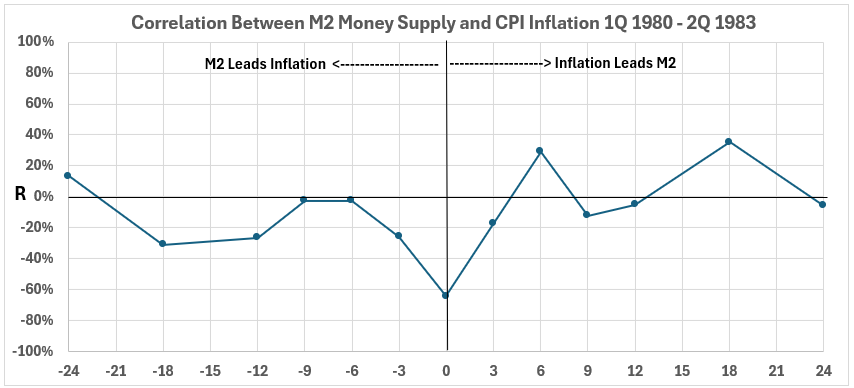
When M2 changes come before CPI changes (left side of Figure 6), all timeline offsets have negative associations, except for 24 months with R = 13% and R2 = 1.8%. This indicates that any possible cause and effect would be that a change in M2 would produce a nearly negligible or opposite change in inflation. Could an increase in M2 cause a decrease in inflation? Could a decrease in M2 cause an increase in inflation?
The answer to both questions is no. Therefore, associations for M2 changes occurring before inflation changes by up to two years must be considered coincidental.
On the right side of Figure 6 are two positive correlation points. The largest of these is for CPI changes occurring 18 months before M2 changes—R = 35% and R2 = 13%. Because there are four negative correlation points, it is speculative to suggest that previous CPI changes might have caused up to 13% of changes in MR.
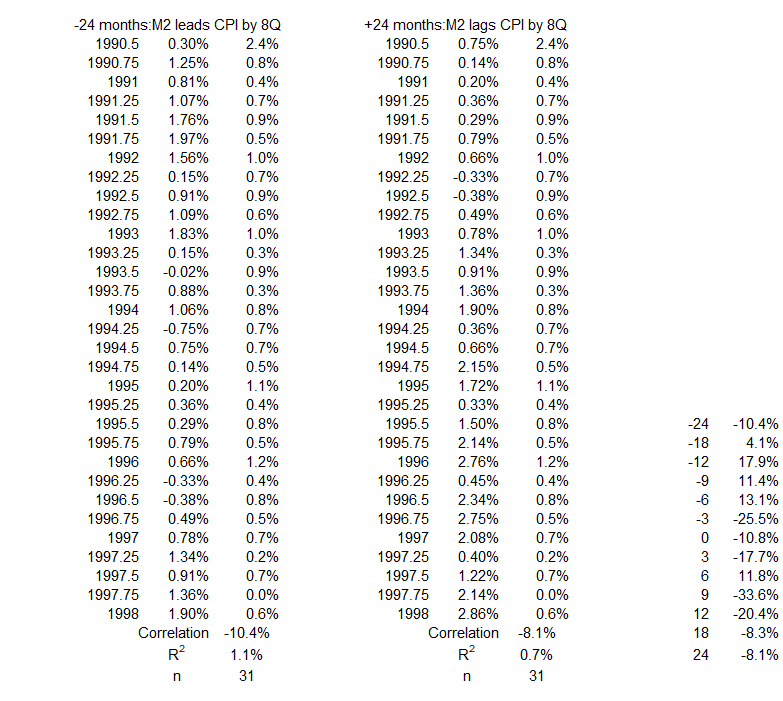
4Q 1990 – 1Q 1998
Figure 7. U.S. FSD and Inflation 3Q 1990 – 1Q 1998
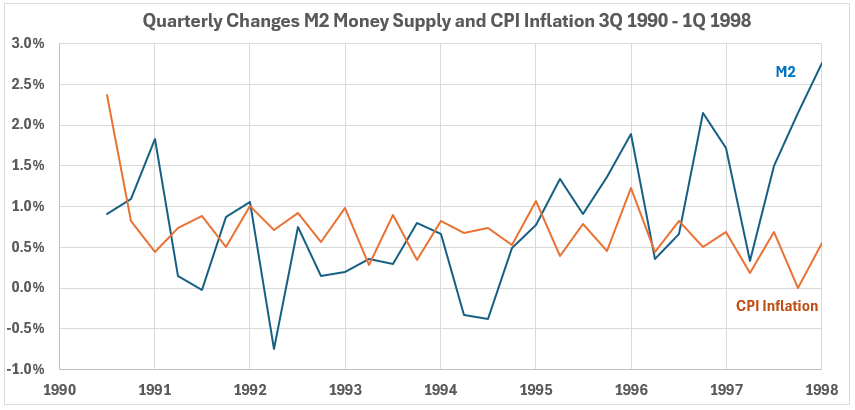
The M2 money supply changes trend down until 2Q 1992, then are flat until the end of 1994, and finally trend up to the beginning of 1998. CPI changes trend down until the end of 1993, then are flat until the middle of 1996, and finally trend down until the beginning of 1998. Volatility is greater for M2 changes than for CPI.
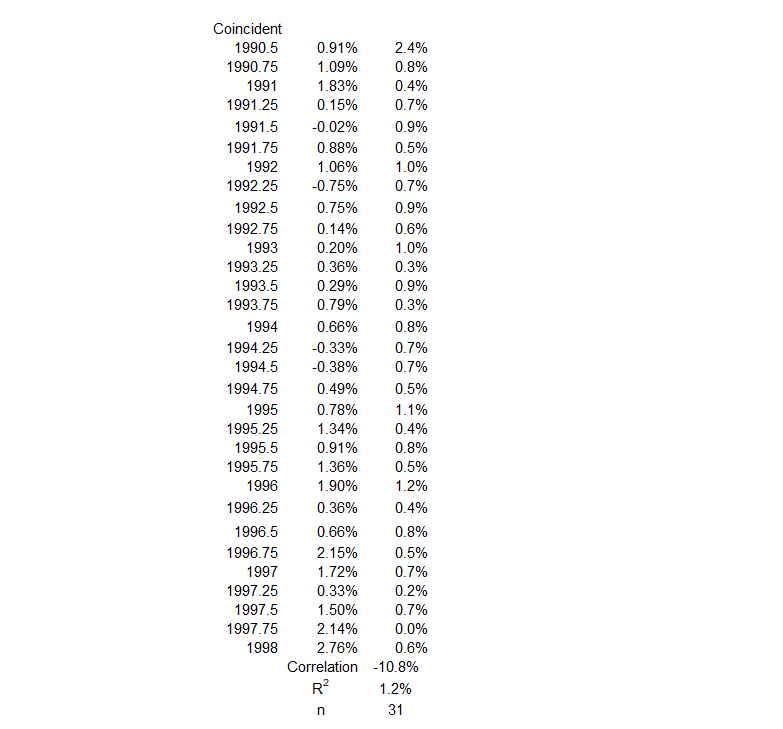
Figure 8. Quarterly Changes in M2 (x) vs. CPI Inflation (y) 3Q 1990 – 1Q 1998
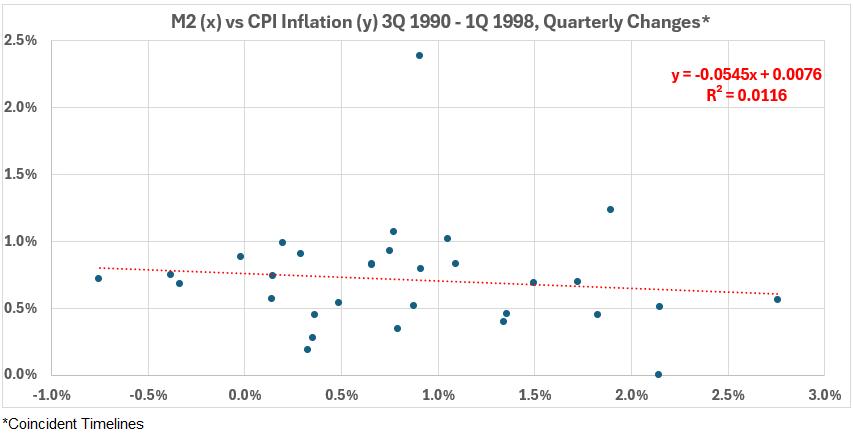
Figure 8 shows a very small negative correlation between the coincident timelines data. R = –11% and R2 = 1.2%.
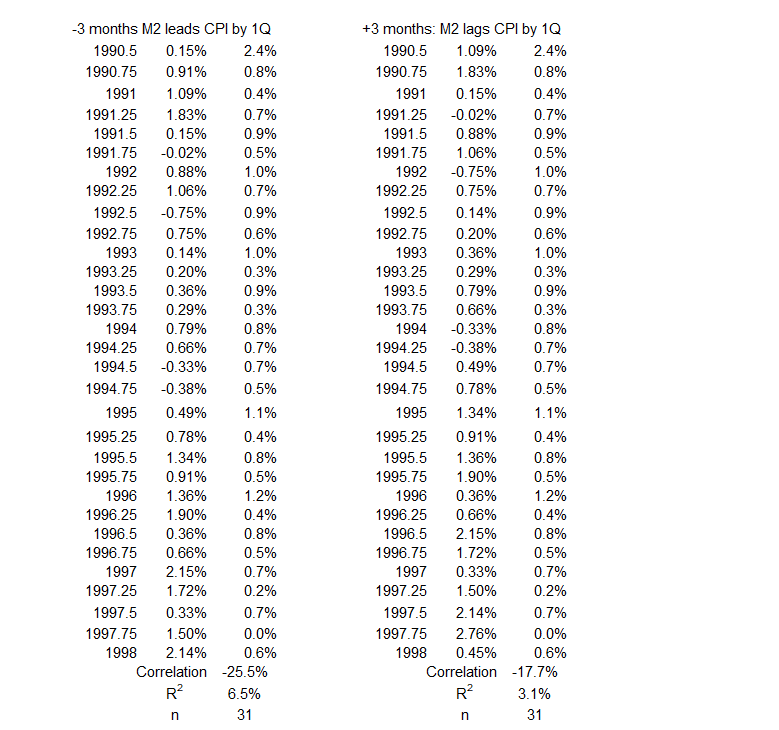
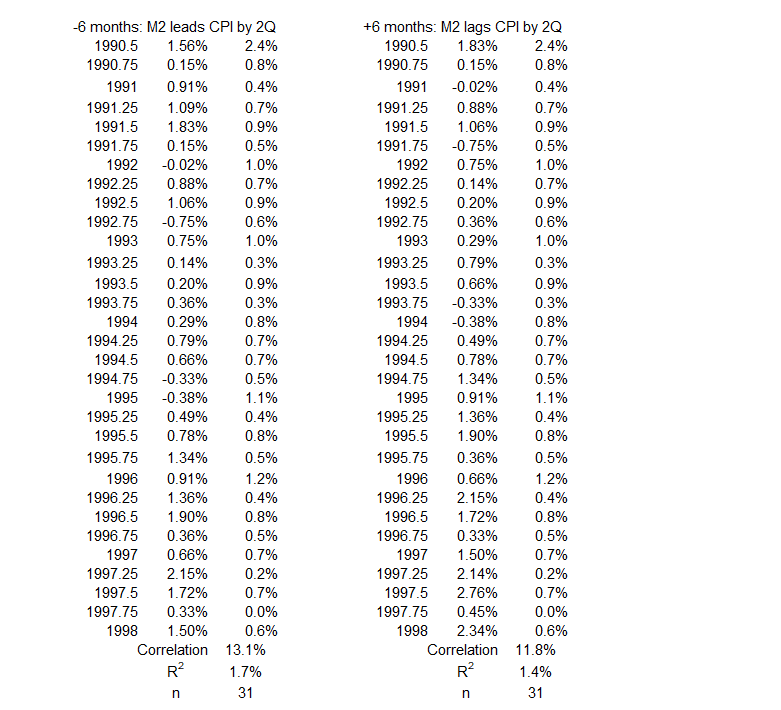
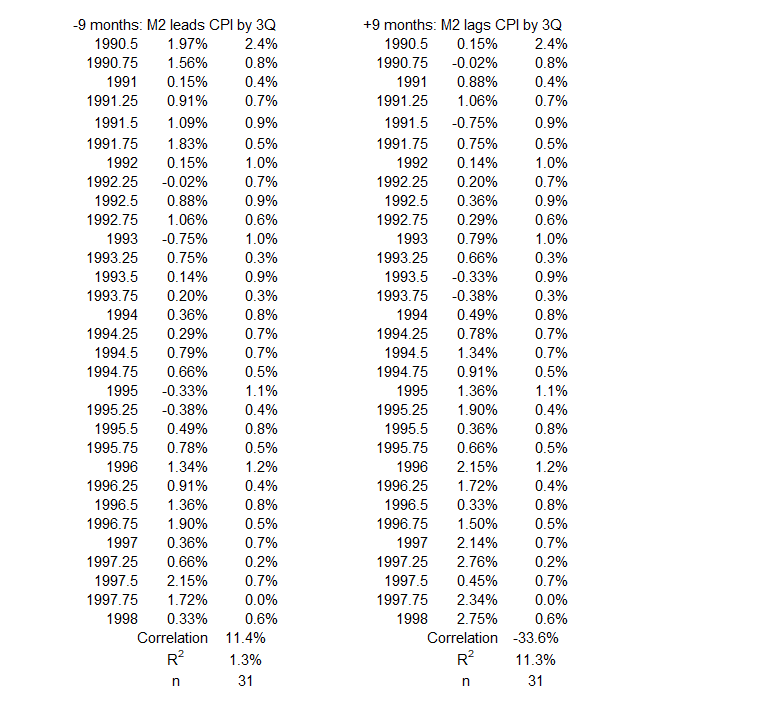
Figure 9. Correlation Between M2 and CPI Inflation 3Q 1990 – 1Q 1998
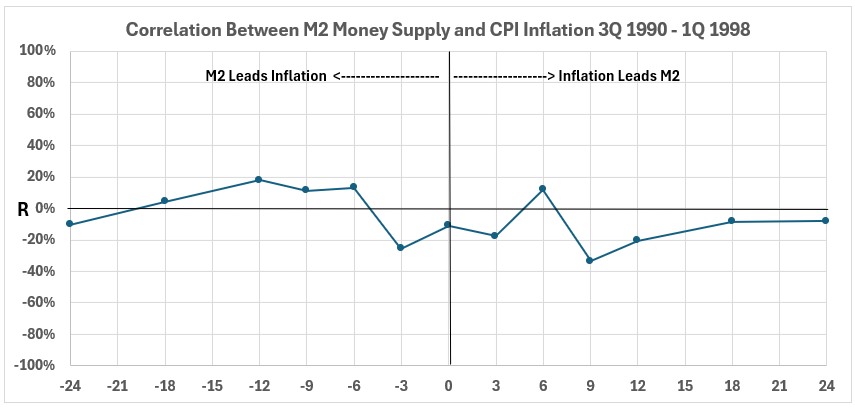
Figure 9 shows little opportunity for meaningful cause-and-effect relationships between M2 and CPI for the period from late 1990 to the beginning of 1998.
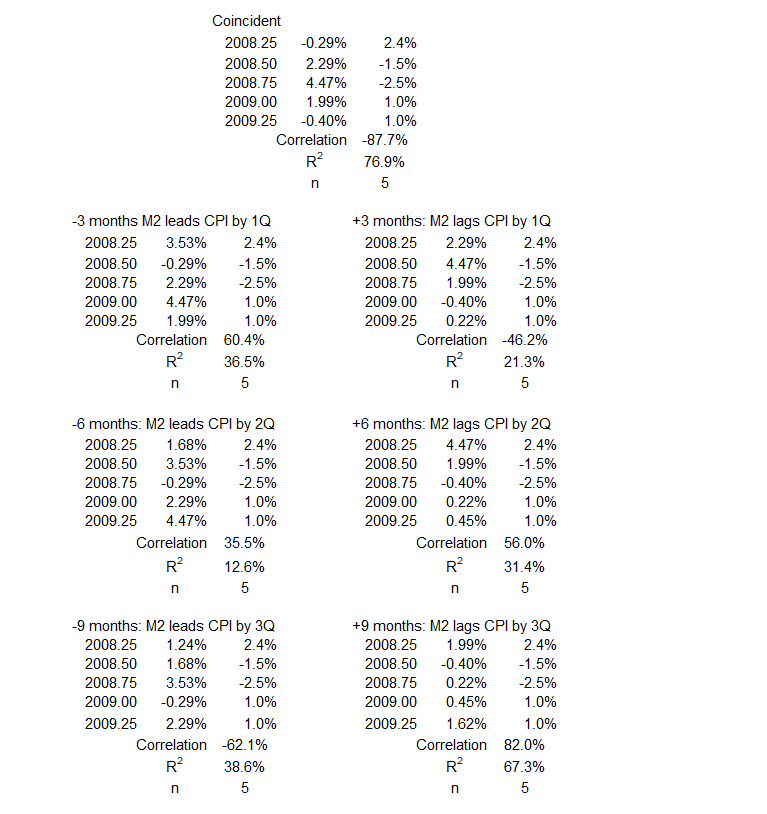
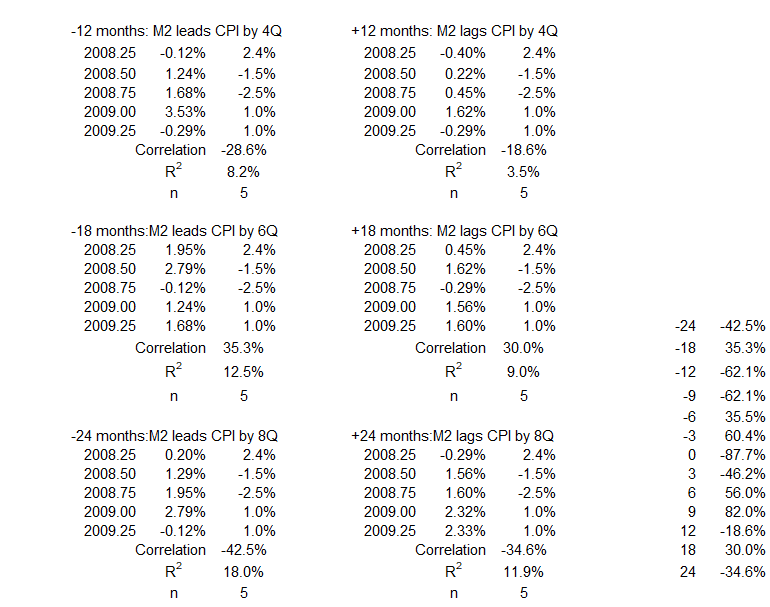
3Q 2008 – 2Q 2009
Figure 10. U.S. M2 and Inflation 3Q 2008 – 2Q 2009
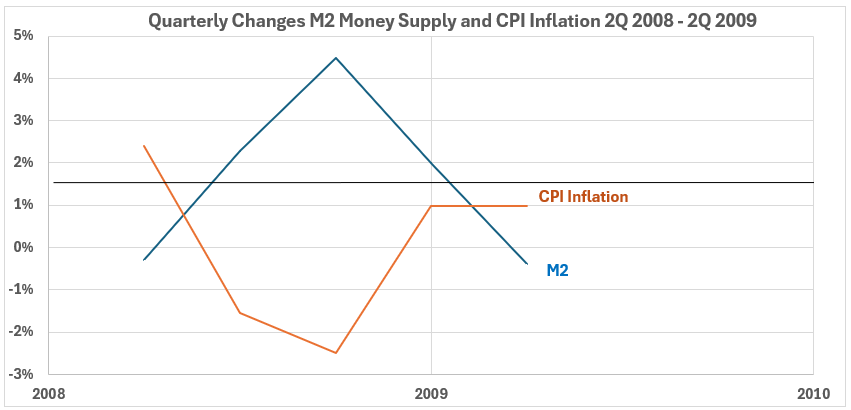
Figure 10 has too few data points to establish trends. M2 rises and falls, while CPI falls and rises.
Figure 11. Quarterly Changes in M2 (x) vs. CPI Inflation (y) 3Q 2008 – 2Q 2009
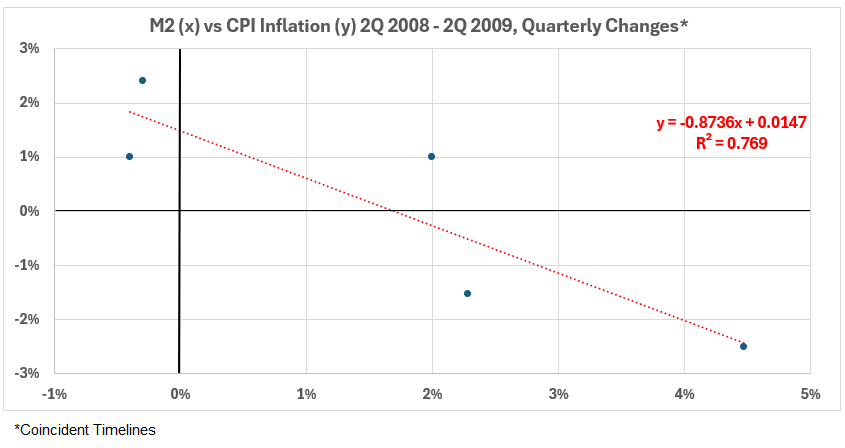
There is a lot of scatter in Figure 11, suggesting that analysis of this small data set may offer some problems. For a discussion, see this.3 The association here is strongly negative. R = –88% and R2 = 77%.
Figure 12. Correlation Between M2 and CPI Inflation 3Q 2008 – 2Q 2009
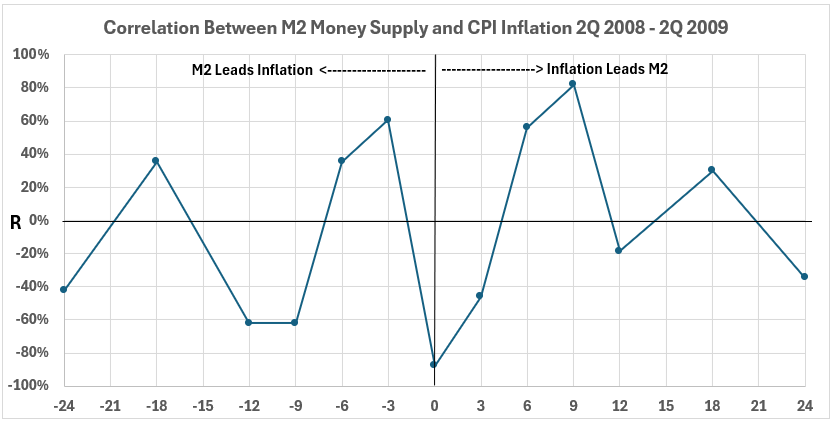
The two moderate positive correlations for M2 changes occurring three and six months before CPI changes (left side of Figure 12) suggest that cause-and-effect might be possible. There are two high positive correlations on the right side for CPI changes occurring before M2 changes. At six months, there is a moderate association and, at nine months, a strong association. This suggests that cause-and-effect might be possible. However, the very small data sample makes extracting any meaning from Figure 15 problematic.
Conclusion
There are no possible cause-and-effect relationships for M2 money supply possibly causing inflation changes during the four periods of disinflation surges since 1959.
There are two periods with a possibility that CPI changes might have contributed to M2 changes in the same direction:
- Up to 50% contribution might have occurred in the 1974-76 period.
- Up to 13% contribution might have occurred during the 1980-83 period.
After analyzing periods with no significant inflation changes, there will be more discussion of the results. That comes next week.
Appendix
Below are the data sets for each significant negative inflation (disinflation and deflation) period. They come from the tables of timeline aligments1 (M2 Money Supply and Inflation: Part 1).
4Q 1974 -4Q 1976
2Q 1980 – 2Q 1983
4Q 1990 – 1Q 1998


3Q 2008 – 2Q 2009
Footnotes
1. Lounsbury, John, “M2 Money Supply and Inflation, Part 1″, EconCurrents, May 26, 2024. https://econcurrents.com/2024/05/26/m2-money-supply-and-cpi-inflation-part-1/.
2. Lounsbury, John, “M2 Money Supply and Inflation, Part 2”, EconCurrents, June 9, 2024. https://econcurrents.com/2024/06/09/m2-money-supply-and-cpi-inflation-part-2/.
3. Hole, Graham, “Eight things you need to know about interpreting correlations,” Research Skills One, Correlation interpretation, Graham Hole v.1.0., October 5, 2015. https://users.sussex.ac.uk/~grahamh/RM1web/Eight%20things%20you%20need%20to%20know%20about%20interpreting%20correlations.pdf.