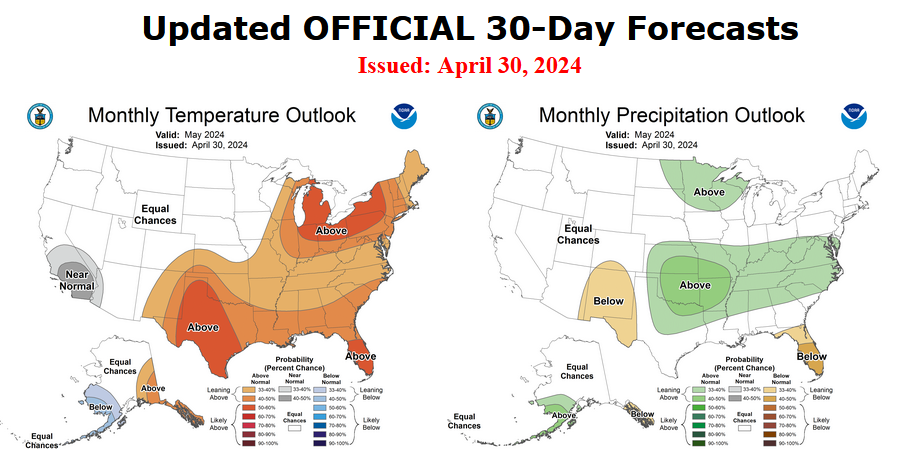
At the end of every month, NOAA updates its Outlook for the following month which in this case is May of 2024. We are reporting on that tonight.
There have been some significant changes in the Outlook for May and these are addressed in the NOAA Discussion so it is well worth reading. We provided the prior Mid-Month Outlook for May for comparison. It is easy to see the changes by comparing the Mid-Month and Updated Maps.
The article includes the Drought Outlook for May. NOAA also adjusted the previously issued Seasonal (MJJ) Drought Outlook to reflect the changes in the May Drought Outlook. We have included a map showing the water-year-to-date precipitation in the Western States. We also provide the Week 2/3 Tropical Outlook for the World. We also include a very interesting ENSO Blog Post.
The best way to understand the updated outlook for May is to view the maps and read the NOAA discussion. I have highlighted the key statements in the NOAA Discussion.
Here is the updated Outlook for May 2024.
For Comparison Purposes, Here is the earlier Mid-Month Outlook for May.
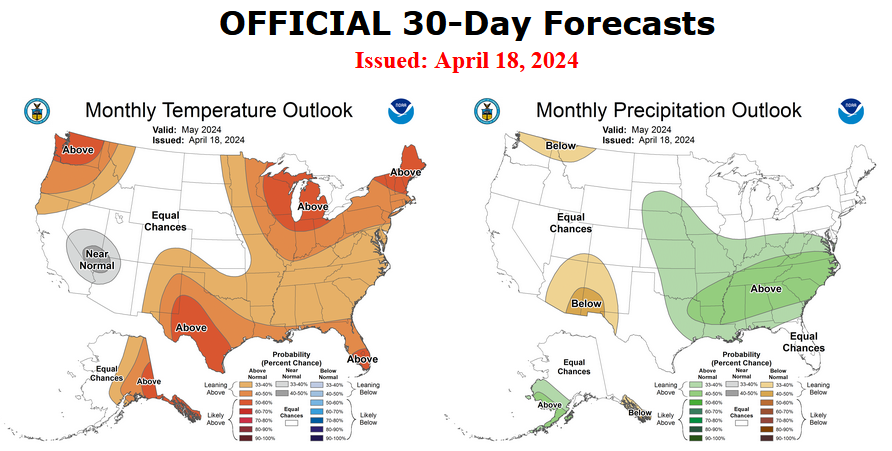
| It is important to remember that the maps show deviations from the current definition of normal which is the period 1991 through 2020. So this is not a forecast of the absolute value of temperature or precipitation but the change from what is defined as normal or to use the technical term climatology.
It is not totally changed from what was issued on April 18, 2024, but there have been some significant changes. Remember, it is the first set of maps that are the current outlook for May. One expects some changes 12 days later. However, the changes to the May Outlook are significant. This then gives us some reason to question the (April 18, 2024) three-month MJJ temperature and precipitation Outlooks which are shown in the following graphic. |
NOAA provided a combination of the Updated Outlook for May and the Three-Month Outlook. It was attractive but not easy to look at the difference between the current month and the three-month period that includes the current month. So I created my own. It is a little rough.
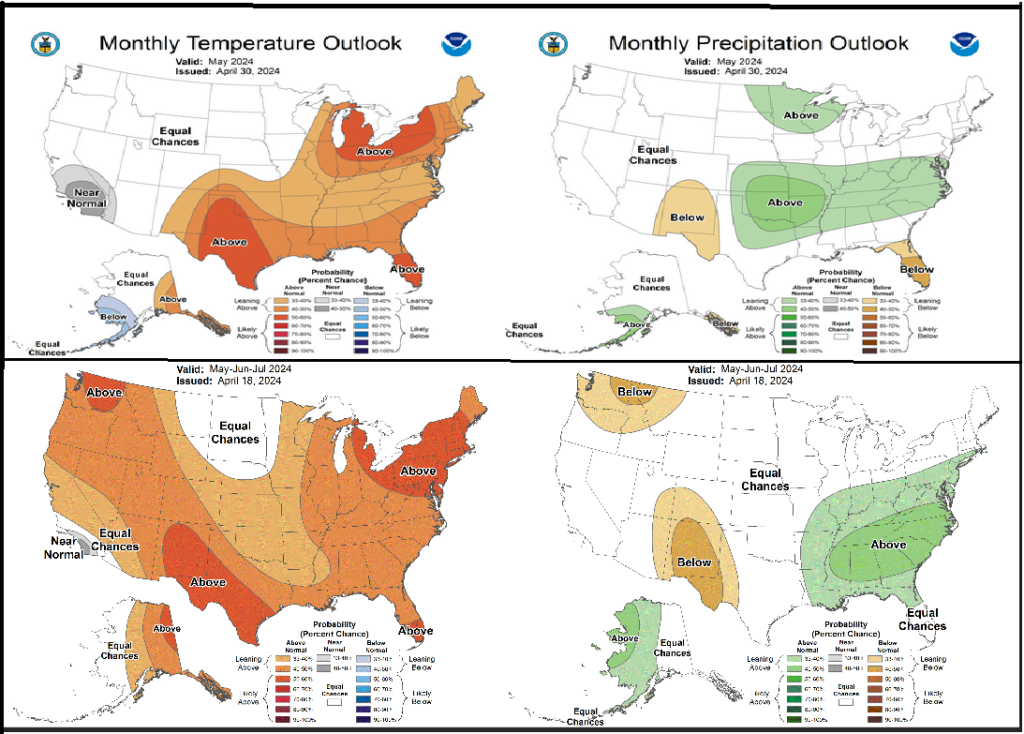
The top pair of maps are again the Updated Outlook for the new month. There is a temperature map and a precipitation map. The bottom row shows the three-month outlooks which include the new month. I think the outlook maps are self-explanatory.
To the extent that one can rely on a forecast, we would conclude that June and July will be very different than May, especially for temperature. You can basically subtract May from the three-month Outlook and divide by two to get a combined June-July Outlook. |
Some readers may need to click “Read More” to read the rest of the article. Some will feel that they have enough information. But there is a lot more information in the rest of this article.
| Our regular Daily Weather article can be found HERE. In addition to the short-term forecast it also provides the 6 – 10 day, 8 – 14 day, and Week 3 – 4 Outlooks. That is not a full month but close to it. So it is helpful if one wants to understand how the full-month forecast is expected to vary through the month. And the maps in the Daily Article update throughout the month. |
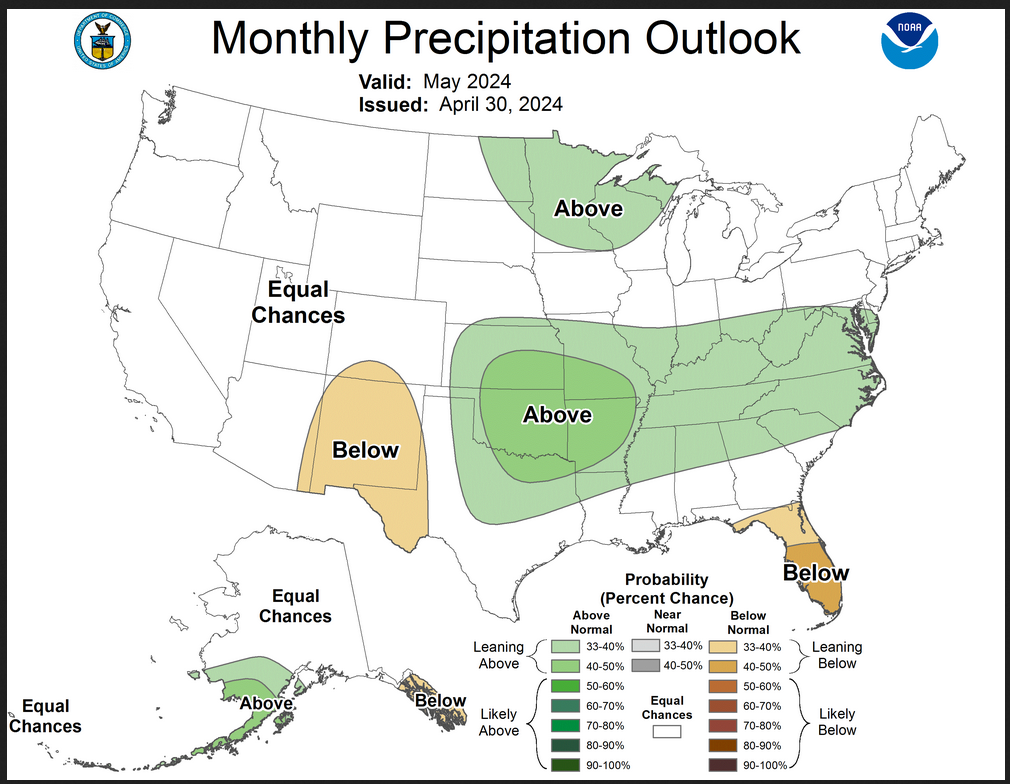
Here are larger versions of the May Temperature and Precipitation Outlook maps.

NOAA (Really the National Weather Service Climate Prediction Division CPC) Discussion. I have shown certain important points in bold type. My comments if any are in brackets [ ].
30-DAY OUTLOOK DISCUSSION FOR MAY 2024
The May 2024 Temperature and Precipitation Outlooks are updated considering current Weather Prediction Center (WPC) Outlooks for week 1, Climate Prediction Center (CPC) Extended Range and Subseasonal Outlooks, dynamical model guidance for week 2 and weeks 3-4, soil moisture, background climate states, and recent Climate Forecast System version 2 (CFSv2) monthly forecasts of temperature and precipitation. Currently, equatorial sea surface temperatures (SSTs) are above average across the central and east-central Pacific Ocean and El Niño conditions are observed. However, tropical Pacific atmospheric anomalies are weakening and a transition from El Niño to ENSO-neutral is likely by April-June 2024, with the odds tilted toward La Niña developing by June-August 2024. Despite the weakening of El Niño some lingering impacts are expected into May. The Madden Julian Oscillation (MJO) weakened during mid to late April, but dynamical model forecasts favor a re-emerging MJO across the eastern Indian Ocean, with propagation across the Maritime Continent and Western Pacific forecast during early May. Some weak impacts due to MJO are possible in early May, though teleconnections tend to be weak in spring.
CPC 6-10 Day Outlooks (early May) feature a 500 hPa trough over the Bering sea and Alaska and down the west coast, while ridging is forecast over the central and eastern Contiguous United States (CONUS). This pattern is persistent but less amplified in the CPC 8-14 Day Outlook period (through mid-May). By weeks 3-4, CFSv2, GEFSv12, and ECMWF 500 hPa predictions generally favor ridging over the western CONUS and troughing over the east, with differences in placement of ridge or trough axes and strength of the height pattern. This indicates a fairly transient pattern expected throughout the month of May, with troughing moving eastward and becoming less certain in terms of placement and amplitude by the end of the month.
Temperature
The updated Monthly Temperature Outlook remains similar to the previously released Outlook over the eastern CONUS where above normal temperatures are favored, though there are some changes to the spatial extent. Ridging over the eastern CONUS through mid-May supports the tilt toward above normal temperatures, and good model agreement exists over parts of the Southwest and Texas as well as the Great Lakes and parts of New England, thus probabilities remain similar to the previously released Outlook. Though short term forecasts through mid-May are overall warm over the eastern CONUS, model runs for week 3-4 begin to introduce troughing and cooler temperatures by the end of the month stretching from the Central Plains to the Mid-Atlantic. However, the below normal temperature probabilities are weak due to uncertainty in the forecasted mid-level height pattern. Given the warm beginning and middle of the month, but weaker and uncertain below normal probabilities by the end of May, 33 to 40% probabilities are maintained for much of the region. The largest change from mid-month is to the northwestern edge of the above normal probabilities. Shorter term forecasts favor below normal temperatures from the west coast overspreading through the Central and Northern Plains from early to mid-May beneath favored troughing that is forecasted to shift eastward with time. Given the forecasted cooler start to the month over the west that could stretch into the central and north central CONUS by mid-month, the western edge of above normal temperature probabilities is shifted eastward compared to the initial release. The forecasted cooler start and transition to above normal temperatures by the end of the month supports removal of the above normal probabilities over the Northwest in favor of Equal Chances of Above, Near, and Below Normal Temperatures (EC). Near normal is maintained over southern California and parts of the the Southwest where earlier North American Multi-Model Ensemble (NMME) and Copernicus Model Suite (C3S) forecasts were in good agreement, but is shifted toward the coast where we might see mixed temperatures throughout May due to the potential for marine layer intrusions.
Over Alaska, below normal temperatures are indicated over the southwest where EC was previously indicated due to persistent below normal sea surface temperature (SST) anomalies and better model agreement in updated runs.
Precipitation
Several changes are made in the updated May 2024 Precipitation Outlook. Given the transient pattern forecast throughout May, the Precipitation Outlook is relatively uncertain, and areas of EC are indicated where signals are weak and inconsistent in forecasts throughout May. EC is now favored in place of the weak tilt toward below normal precipitation previously indicated over northern Washington, Idaho, and Montana due to the potential for above normal precipitation in the beginning of May, and weak and inconsistent signals throughout the remainder of the month despite the expected below normal El Niño influence. A weak tilt toward below normal precipitation is still forecast over the Southwest where early to mid-May forecasts tilt toward below normal along with CFSv2 monthly forecasts, but probabilities are damped considering Weeks 3-4 Outlooks that indicate EC or above normal precipitation over parts of the region. Above normal precipitation is indicated from the Central and Southern Plains eastward to the Mid-Atlantic coast, but tilts toward EC along coastal areas of Gulf States where forecasts vary throughout the month of May, and models show weak or inconsistent signals . Below normal precipitation probabilities are favored over Peninsular Florida where below normal forecasts are more consistent in models, and where the CPC Week-2 Hazards Outlook indicates Rapid Onset Drought Risk. A weak tilt toward above normal precipitation is depicted over eastern North Dakota, Minnesota, and the western Great Lakes due to forecasted early to mid-May above normal precipitation and consistent signals in most recent CFSv2 runs. Precipitation probabilities over Alaska remain similar to the mid-month Outlook.
Drought Outlook
Here is the newly issued Drought Outlook for the month.

| You can see where drought development or reduction is likely. The summary and detailed discussions that accompany this graphic can be accessed HERE, but the short version is shown below. |
Here is the short version of the drought summary
Latest Monthly Assessment – The proportion of the United States in drought (as determined by the U.S. Drought Monitor [DM]) is roughly half of what it was at the beginning of the 2023-24 Water Year (Oct 1, 2023). Over 32 percent of the Nation was in drought at that time, compared to about 15 percent on the most recent DM (valid April 23, 2024). That percentage has been relatively stable since the last Monthly Drought Outlook (MDO) release on March 31, 2024, but there have been significant changes in intensity and some changes in location since then. The last 4 weeks brought improvement to areas of drought in most of the Rockies and Intermountain West, the northern Plains, the northern half of the Mississippi Valley, the Great Lakes Region, and western New York. Deterioration has been noted primarily from Kansas and northern Oklahoma eastward across southern Missouri and northern Arkansas and into areas immediately adjacent to the Mississippi/Ohio Rivers’ confluence. The Pacific Northwest and portions of south-central and west-central Texas also saw some deterioration over the past month.
Looking ahead through the end of May 2024, heavy rainfall from the last week of April into the second week of May should bring drought improvement or removal to drought areas in the Great Plains, Mississippi Valley, and western Great Lakes region. Heavy rainfall early in the period is also expected to remove the remaining drought in northwestern Puerto Rico. In contrast, most drought areas from the High Plains westward to the Pacific Coast are expected to persist or intensify, except in a few patches across the highest elevations of Washington, western Montana, and northern Wyoming. Conditions in the drought areas covering portions of Deep South Texas and the southeastern half of Hawaii are also expected to persist or intensify. In addition, drought is expected to develop by the end of May across the central Florida Peninsula, where antecedent short-term moisture deficits exist and unusually hot and dry weather is anticipated for at least the first half of May. Drought development is also anticipated in some parts of Hawaii, southeastern Montana, the southern High Plains, and the southeastern Rockies adjacent to current drought areas.
Somewhat below-normal precipitation, including deficient snowpack, has been observed in southeasternmost Alaska for the past several months. Drought development is not anticipated by the end of May at this time, but the region will need to be monitored for signs of deterioration.
We also have an updated Seasonal Drought Outlook (link).
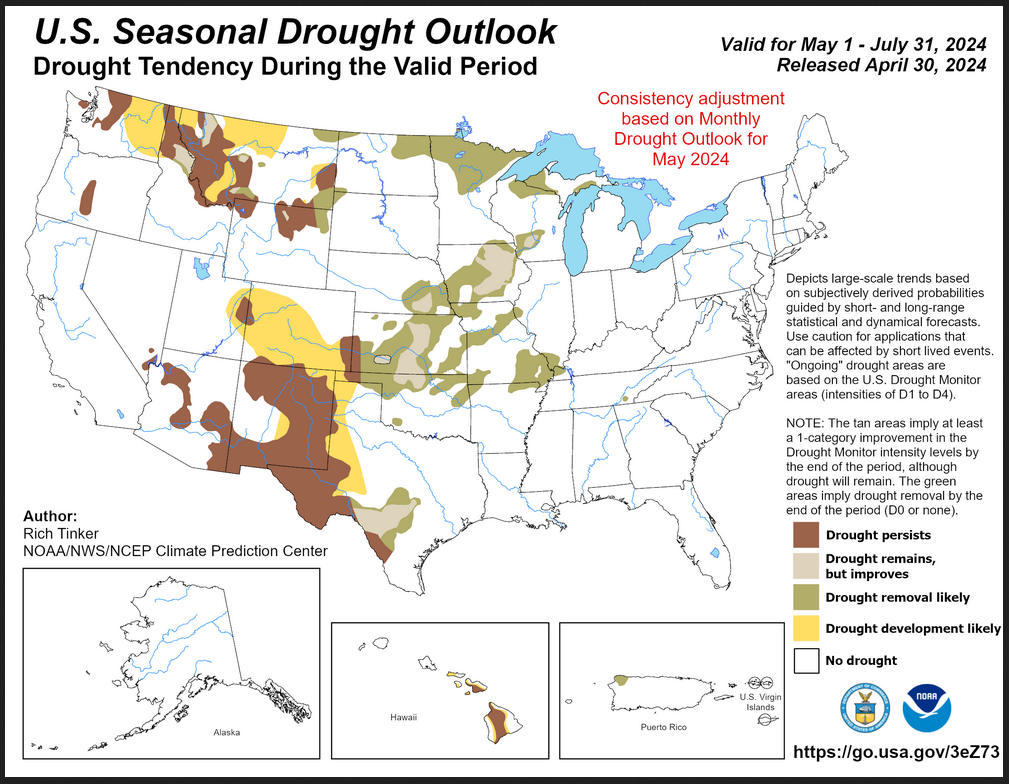
| This three-month outlook forecasts more drought than the single-month outlook and it covers a longer period of time. Unlike the one-month outlook. It shows both areas of drought reduction and development. |
| To update this forecast (which updates on Tuesdays), click HERE |
Month-to-date Temperature as the current month evolves can be found at https://hprcc.unl.edu/products/maps/acis/MonthTDeptUS.png
Month-to-date Precipitation as the current month evolves can be found at https://hprcc.unl.edu/products/maps/acis/MonthPNormUS.png
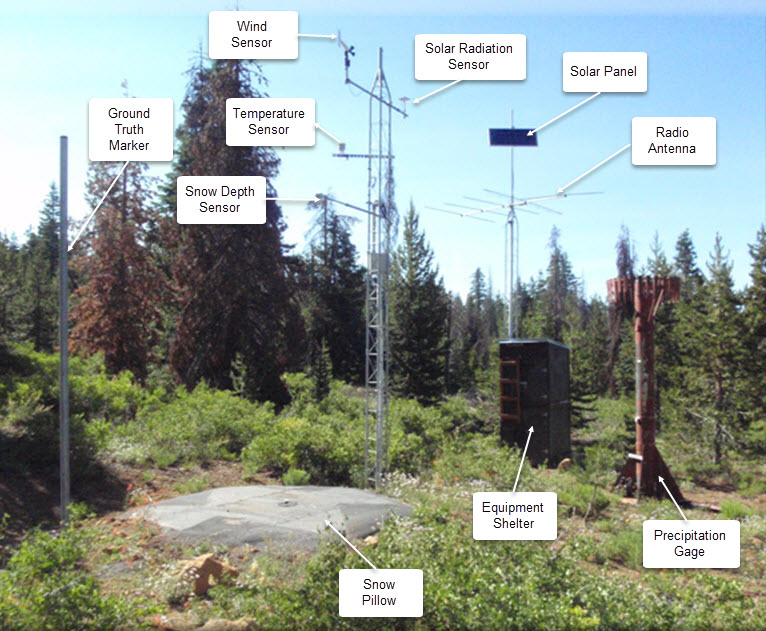
Current SWE (water contained in snow) is pretty much gone so I thought I would provide the water year-to-date precipitation. I will be reporting on the projected water supply soon probably in a separate article. For those who want continual updates, here is the LINK. You can select a variety of maps with the information provided by SNOTEL sites. Snow telemetry is mostly used in the West because in the winter most of the precipitation is in the form of snow and it is mostly in the mountains. That situation exists in Central and Eastern U.S. also but the ratio of precipitation in the mountains to precipitation at lower elevations is higher in the West. SNOTEL is useful but it has the problems that any system has which uses a small sample of measurement locations.
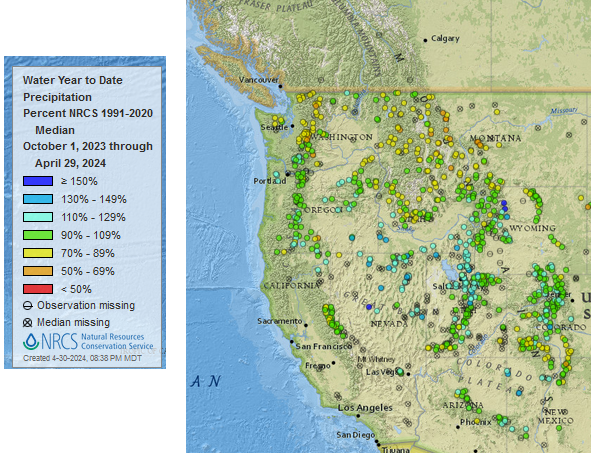
| This provides a very clear picture of the precipitation pattern since October 1, 2023. The pattern of where there is more precipitation than normal and where there is less than normal is pretty interesting. In Central and Eastern U.S. they mostly use a different method to keep track of precipitation. |
Interesting ENSO Blog Post
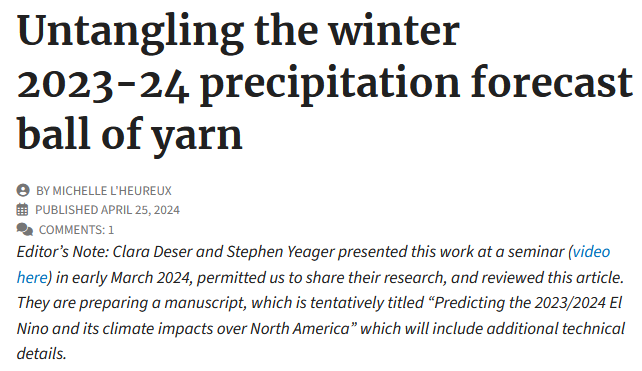
This is a pretty interesting post which is a review of what will be an article by the indicated authors. The blog post was created by Michell L’Heureux. It addresses what was expected from the El Winter we had. You can access that blog post HERE.
Fire Outlook (The Site has Moved and I have not figured out how to print images from the new site yet. The link is HERE.
| I hope you found this article interesting and useful |