
There were two presentations in this webinar. I am reporting on one of them in this article but I provide a link to the recording of both presentations. The second presentation also was of great interest.

| I watch or receive a large number of webinars each month. They are all great. I was just blown away by Gary’s graphics so I could not resist publishing them. Katie’s presentation is also great since it deals with a very important subject. I will probably write an article on her work also but there are only so many hours in the day and the number of interesting weather and climate topics is quite large. What follows in this article are many of Gary’s slides and one additional NOAA graphic that I added. My comments are in boxes like this. I provide a link to both presentations and if you watch that recording you will hear Gary’s comments on his slides. If I recall correctly, his presentation runs for about twenty-five minutes. |
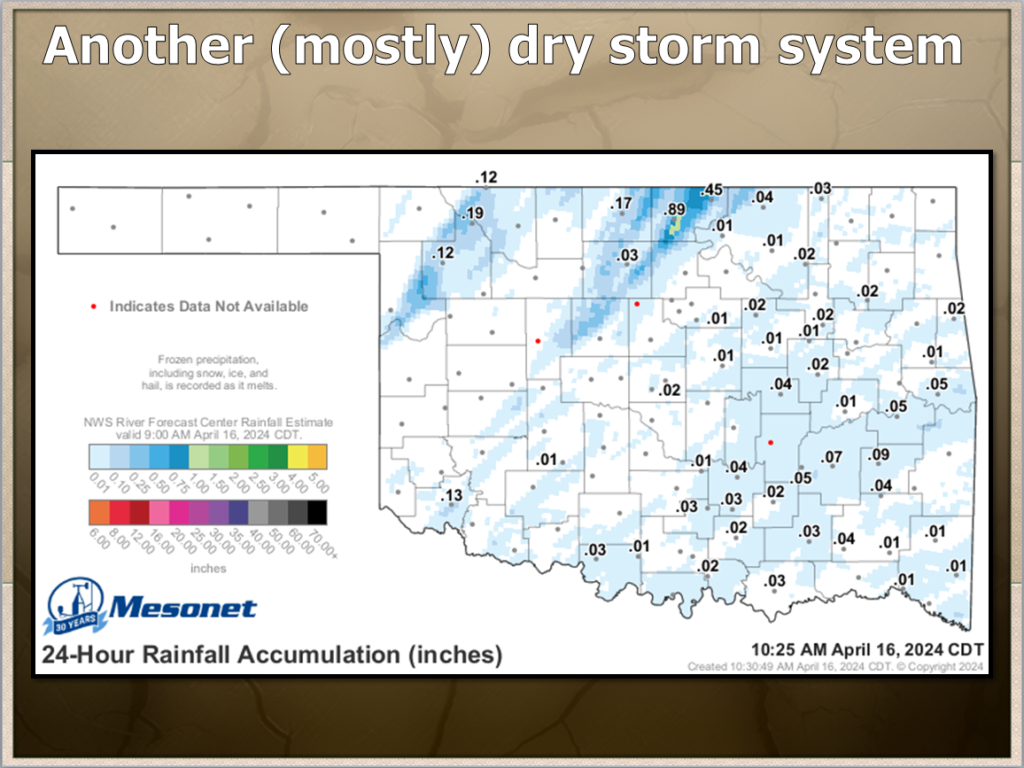
| Here Gary is lamenting that storms that might have been expected to provide good precipitation for Oklahoma have been disappointing. His presentation was a report on current conditions and future expectations with a lot of information on the climate of Oklahoma. My article focuses on the climate of Oklahoma not the current conditions in Oklahoma but the two topics are intertwined. |

| One of the consequences of drought is increased fire risk. Mesonet.org is their website. It is not unusual for the State Climatologist to be based at a university. This slide shows their concern for Northwest Oklahoma which we in New Mexico refer to as the “Panhandle”. |
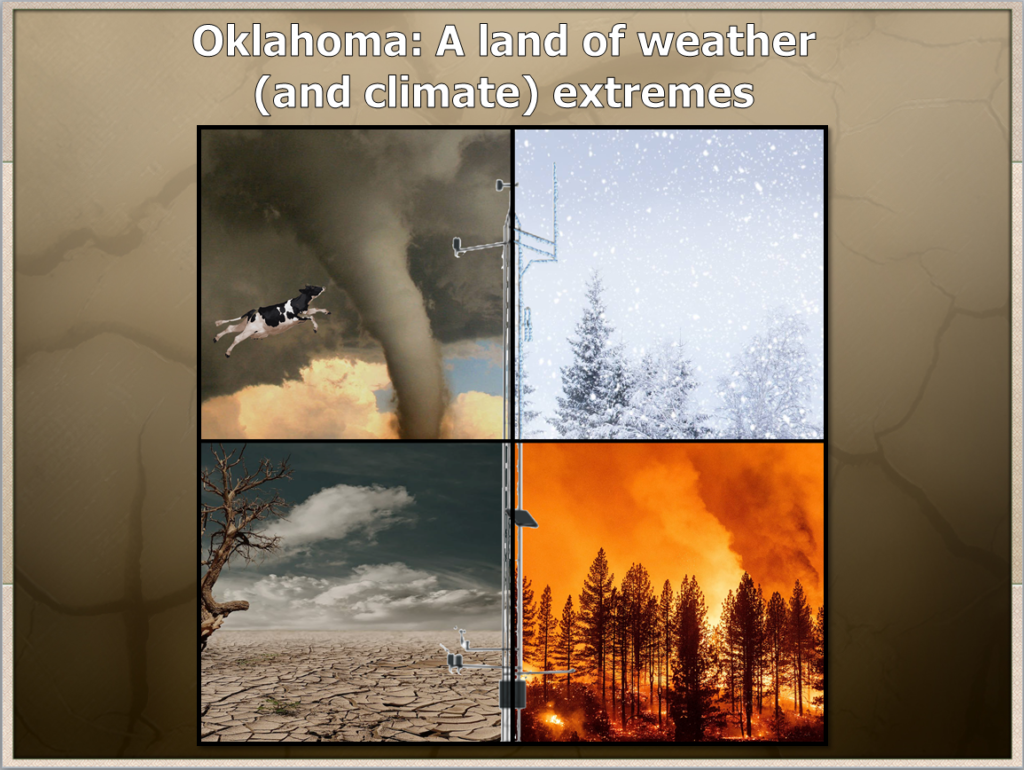
| This is a great graphic that shows the extremes of conditions that Oklahoma experiences. The width of the state is impressive. Notice the tornado depicted in the upper left of this slide. Is that cow flying? |
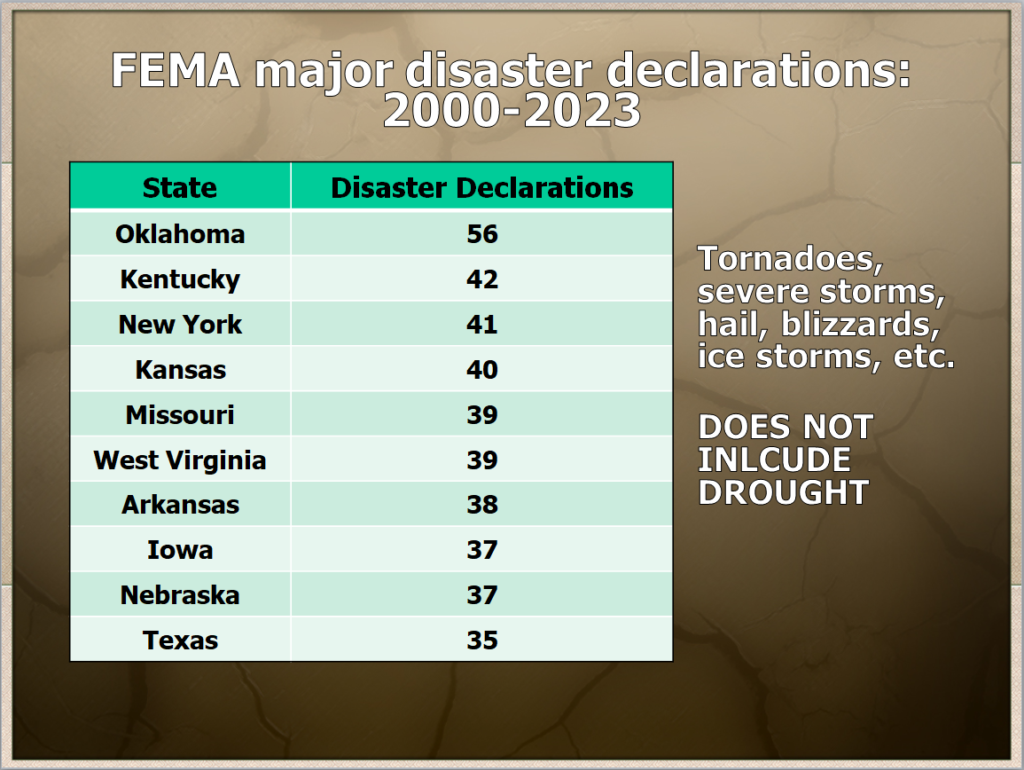
| Oklahoma seems to lead in terms of FEMA weather disasters. They are far from the largest recipient of disaster funding relief. One can quibble about the numbers but there is a lot of severe weather in Oklahoma. |

| I should add some explanation. Gary is focused on three recent drought periods. He refers to them as “flash droughts”. I use that term differently but Gary is trying to make the point that these droughts came on and developed rapidly. I use the term to also mean rapid onset but often of short duration. As long as it is defined it is fine. I do not think that he had time to go into the impact on agriculture. But corn when planted is very vulnerable to flash drought especially if the existing soil moisture is not good at depth. |
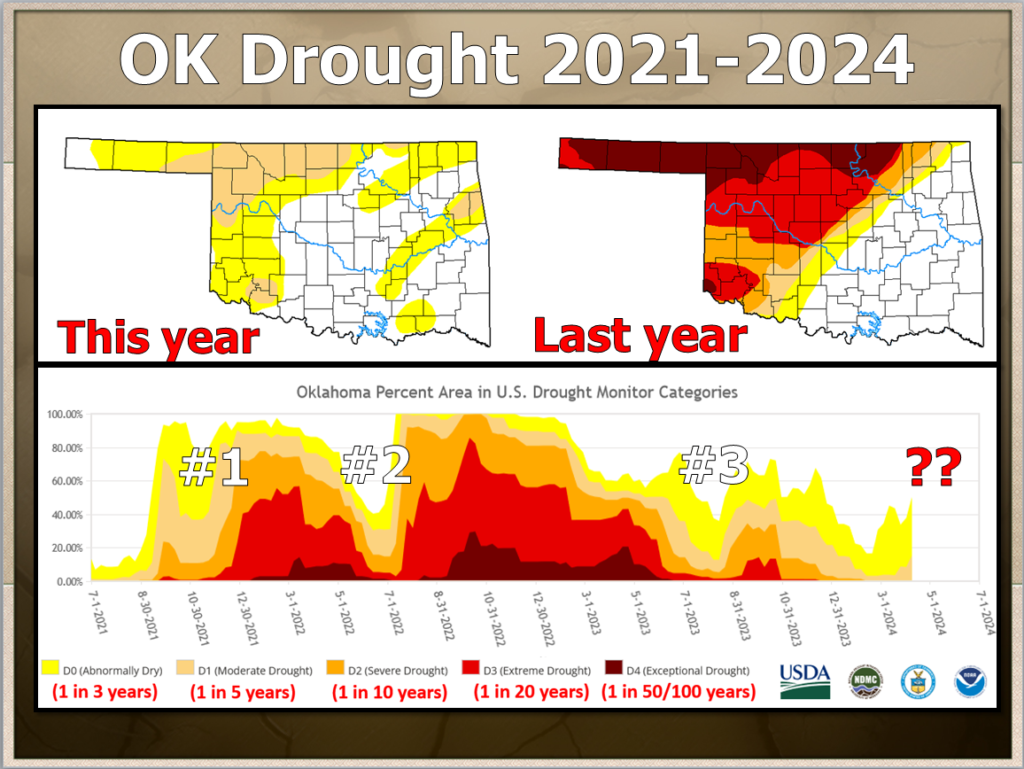
| This data comes from the U.S. Drought Monitor which you can access HERE. He is discussing a series of three drought periods. If you look closely he has a key to the colors which indicate the intensity of drought. It shows the percentage of the State of Oklahoma in drought and the severity. Gary is also showing how the color coding relates to the frequency of that level of drought. Gary is very good at getting a lot of information on one slide and having it not be cluttered. |
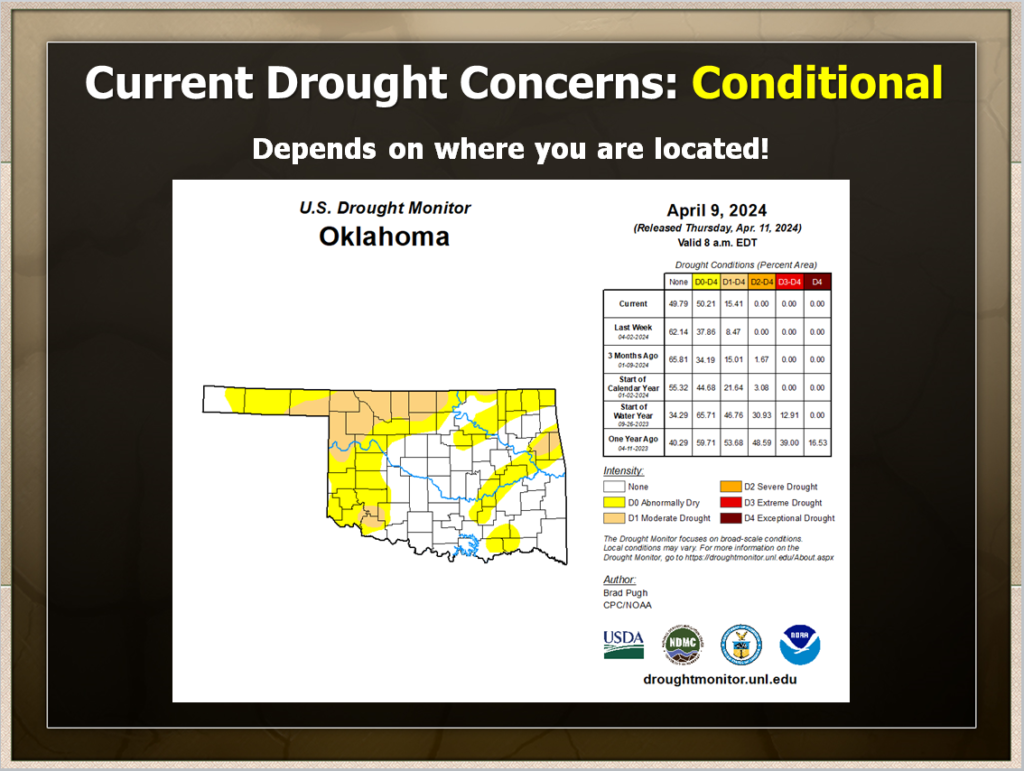
| Here he makes the point that the variation in current drought conditions tends to make people more concerned about drought given the current forecast. |

| Currently, we are in El Nino conditions which have reduced the severity of drought in Oklahoma. You saw the change from last year this time to now in a previous slide. But what will things be like this summer and into winter? Will there be a fourth drought shortly? That was a key part of his message. |
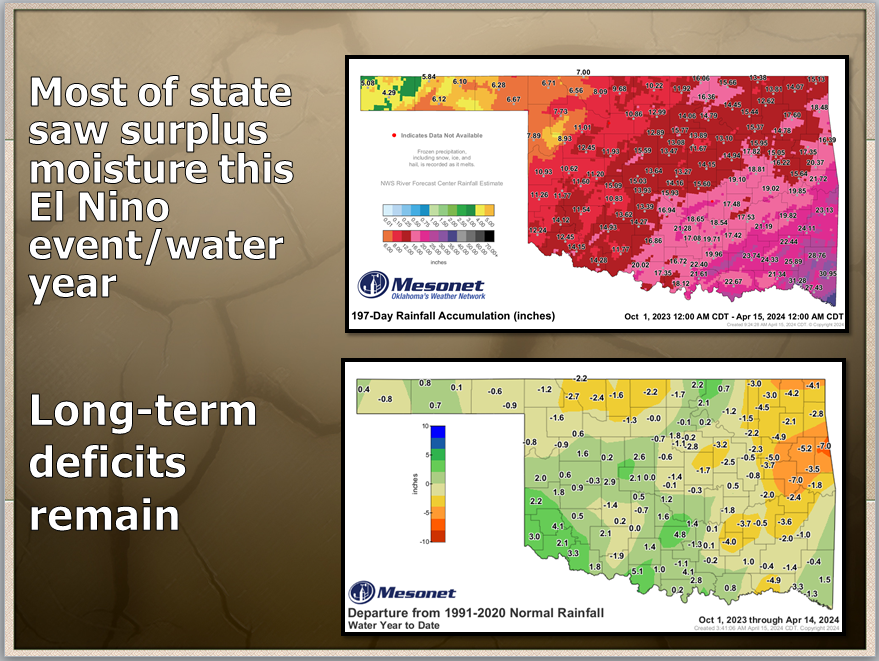
| This illustrates the way we look at drought. The soil is a bank account. For any time period there is the initial state of the soil and reservoirs (above and below ground). Then there is what happened during the time period. This then leads to the new current conditions. |

| This is a four-in-one slide. The top left corner shows the number of “dry” days by location during the last 30 days. To the right, it shows the percentage of normal for the 30 days The bottom also shows the percentage of normal first for prior 60 days and to the right for 90 days. The 30 and 60-day data is similar but drier than the 90 day thus showing a possible drying trend. Could there be another drought forming? |
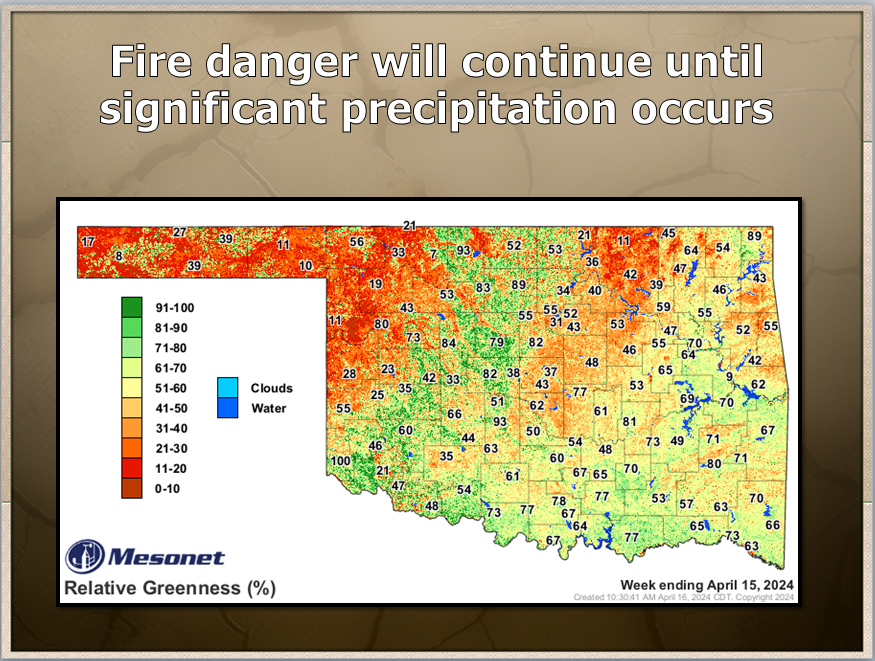
| The color coding is the level of greenness from satellite imagery. I do not recall what the numbers mean. They may be the percent of normal precipitation but I am not sure. |
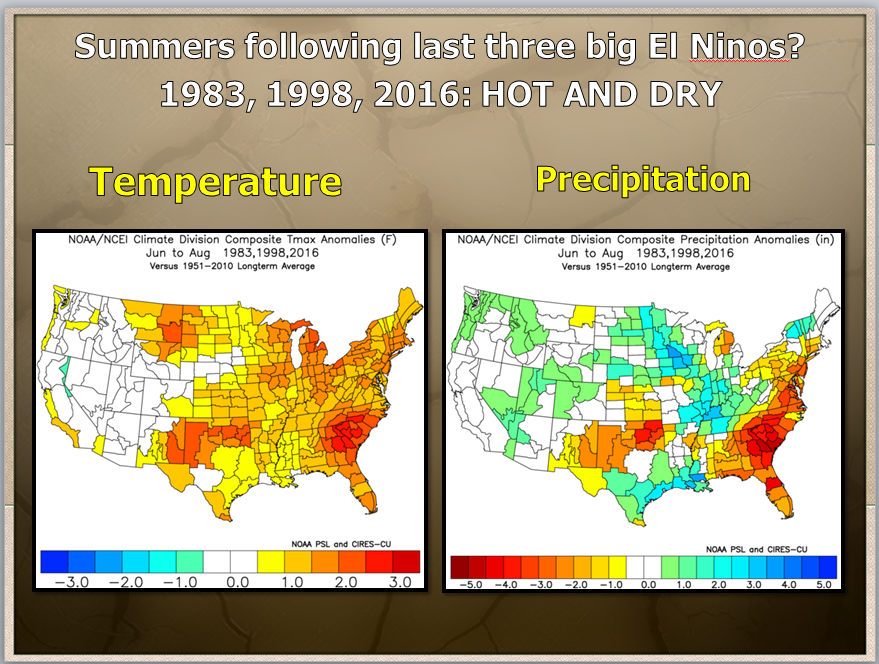
| This is interesting. He is looking at the summer (June to Aug) following the last three strong El Ninos. He is making the point based on a small sample that Oklahoman is not treated well in the summer after a major El Nino. |
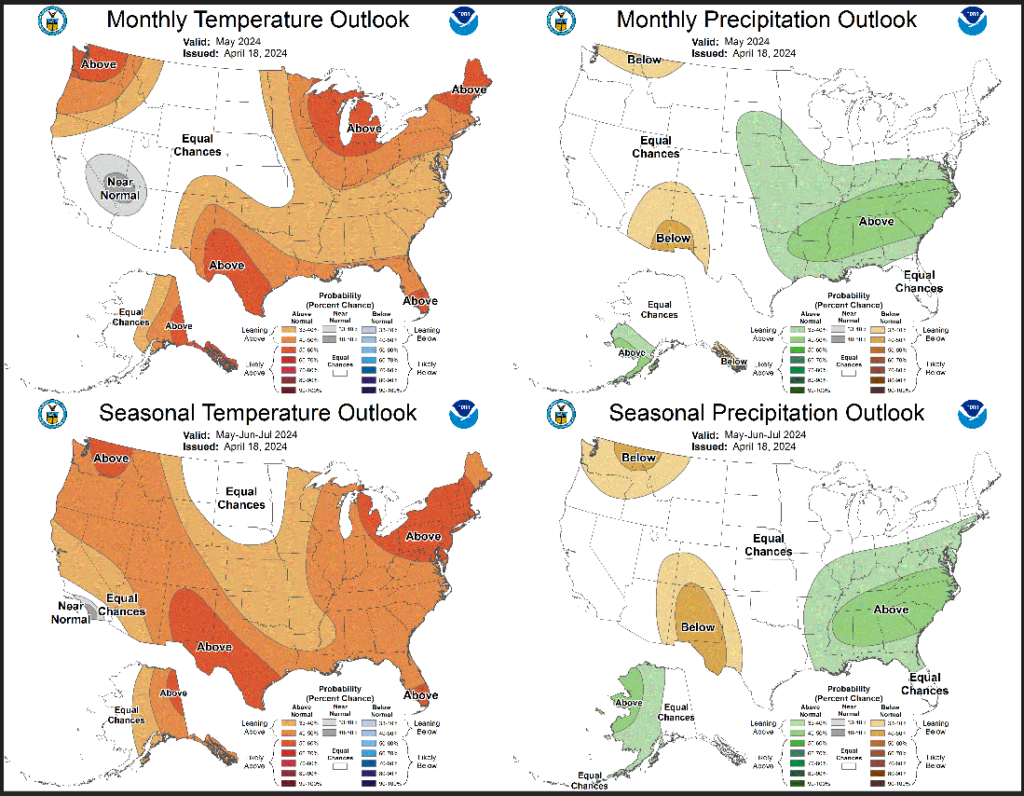
| In Gary’s presentation, he included the weather outlooks that had been issued at the time of his presentation which was April 16, 2024. On April 18, NOAA issued their update of that information so I have replaced Gary’s slide with the updated information. Our full article on the NOAA Seasonal Outlook Update can be accessed HERE. It does not look that bad for Oklahoma as compared to here in New Mexico. Hot and dry creates drought but there are other factors also. |

| This is what Gary is concerned about as the El Nino delines into ENSO Neutral and then likely becomes La Nina. Gary shows the typical weather pattern for La Nina and he has added the Walker Circulation. He also includes an analysis by what are called climate divisions within states and I think he is showing the precipitation anomalies for La Nina years perhaps for the winter season but I am not sure. |

| This is the forecast of the NOAA Climate Prediction Center (CPC) and I published THIS article on the updated ENSO Status just over a week ago. From this graphic, you can not tell the forecast strength of the phase. |

| Here he is showing that for Oklahoma, Nina conditions often lead to drought. I think it is with this slide that Gary pointed out that La Ninas tend to be more prevalent during the Negative Phase of the Pacific Decadal Oscillation (PDO). We are currently in PDO(Neg). |
The recording of the Presentation can be accessed HERE.
| Gary did an excellent job of describing the drought situation in Oklahoma. The history and current conditions are observed values. The forecasts happen as forecasted but there is uncertainty involved. |
–
| I hope you found this article interesting and useful. |
–