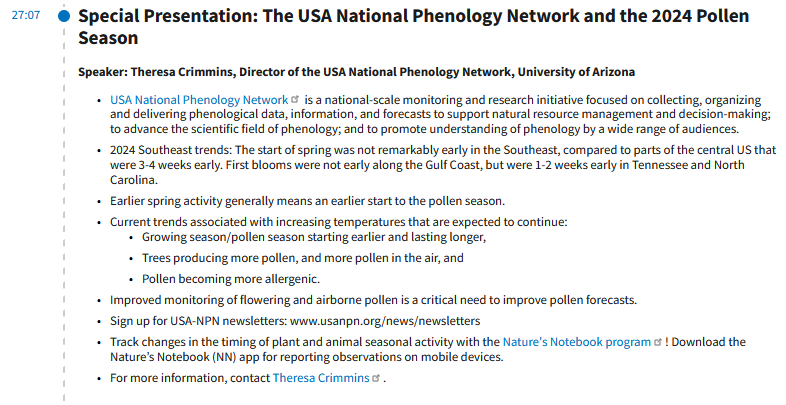
I am providing the full summary of the March 26, 2024 Southeast Region Monthly Webinar. To have it look identical to the summary I received I turn the summary into images so the links are not live. If you wish to click on any of the images you can access the Internet version of the summary HERE. In my article I provide the link to the video recording of the webinar for those who wish to listen to the audio and the questions and answers.


Some will need to click on Read More to access the body of this article.
If one prefers to watch the video of the webinar click here and when the display come up click on the start arrow. It is worth watching and I think it takes one hour.
below I present the table of contents of the video and I think a reasonable summary. So let’s get started.
Author’s Note: I thought it would be useful to add a definition of Phenology (not to be confused with Phrenology). This is from Wikipedia LINK. “Phenology is the study of periodic events in biological life cycles and how these are influenced by seasonal and interannual variations in climate, as well as habitat factors (such as elevation).[1]
Examples include the date of emergence of leaves and flowers, the first flight of butterflies, the first appearance of migratory birds, the date of leaf colouring and fall in deciduous trees, the dates of egg-laying of birds and amphibia, or the timing of the developmental cycles of temperate-zone honey bee colonies. In the scientific literature on ecology, the term is used more generally to indicate the time frame for any seasonal biological phenomena, including the dates of last appearance (e.g., the seasonal phenology of a species may be from April through September).
Because many such phenomena are very sensitive to small variations in climate, especially to temperature, phenological records can be a useful proxy for temperature in historical climatology, especially in the study of climate change and global warming. For example, viticultural records of grape harvests in Europe have been used to reconstruct a record of summer growing season temperatures going back more than 500 years.[2][3] In addition to providing a longer historical baseline than instrumental measurements, phenological observations provide high temporal resolution of ongoing changes related to global warming.[4][5] “
–
| I hope you found this article interesting and useful. |
–


