The full data sets for the 71 years from 1952 to 2022 show no discernable association patterns (correlations) for nonfinancial credit growth and inflation changes.1 This post continues that analysis by looking specifically at the various regimes of inflation change during the 71-year timeline.

From a photo by Lenny Kuhne on Unsplash
Introduction
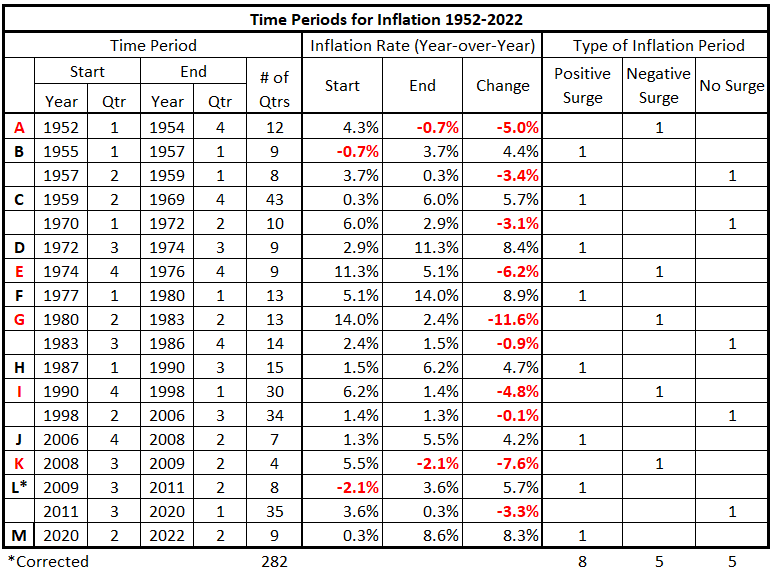
The 71 years from 1952 to 2022 are divided into three types of inflationary behavior:1
- Significant inflation increases;
- Significant inflation decreases;
- No significant inflation changes.
An inflation change is significant if it is ≥4.0% with no intervening countertrend change >1.5%.
Previously, we defined the partitioning of inflation into the pattern in Table 1.
Table 1. Timeline of Inflation Data 1952-2022 (Previously Table 4*.2)
We will examine each category of inflation behavior separately. In this piece, we analyze the significantly positive periods of inflation (positive inflation surges).
Data
The data is from Tables 5-17, prepared previously.1
There are 13 quarterly timeline alignments:
- Nonfinancial Corporate Credit and CPI Inflation quarters are coincident.
- Nonfinancial Corporate Credit leads and lags CPI Inflation by one quarter (±3 months)
- Nonfinancial Corporate Credit leads and lags CPI Inflation by two quarters (±6 months)
- Nonfinancial Corporate Credit leads and lags CPI Inflation by three quarters (±9 months)
- Nonfinancial Corporate Credit leads and lags CPI Inflation by four quarters (±12 months)
- Nonfinancial Corporate Credit leads and lags CPI Inflation by six quarters (±18 months)
- Nonfinancial Corporate Credit leads and lags CPI Inflation by eight quarters (±24 months)
Analysis
1Q 1955 – 1Q 1957
Figure 1. Nonfinancial Corporate Credit Growth and Inflation 1Q 1955 – 1Q 1957
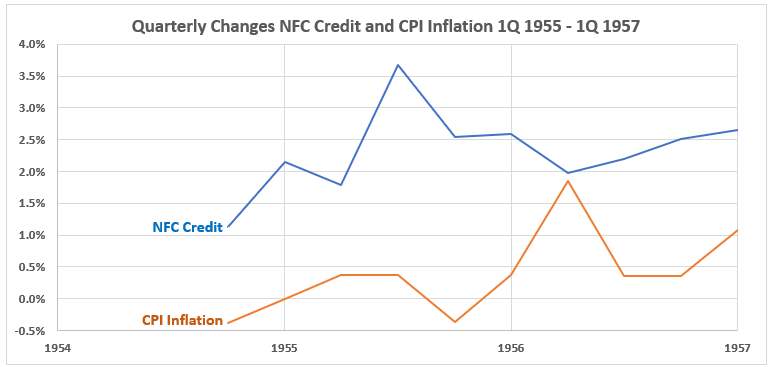
The general observations for this data are:
- The two variables trend upwards.
- There is a peak in inflation nine months after a peak in nonfinancial corporate credit.
- The quarterly changes for inflation are smaller than for nonfinancial corporate credit.
Figure 2. Quarterly Changes in Nonfinancial Corporate Credit (x) vs. CPI Inflation (y) 1Q 1955 – 1Q 1957
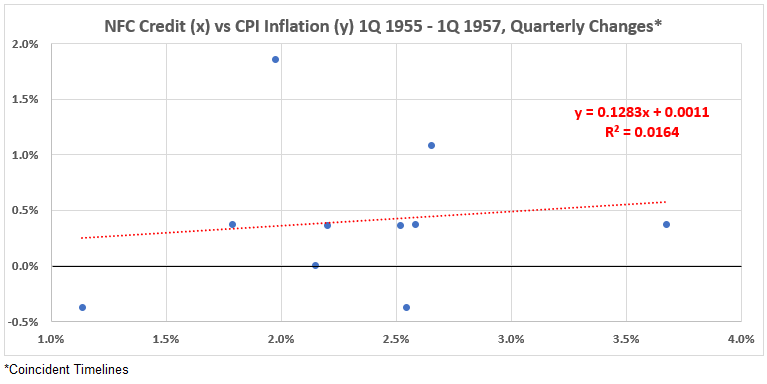
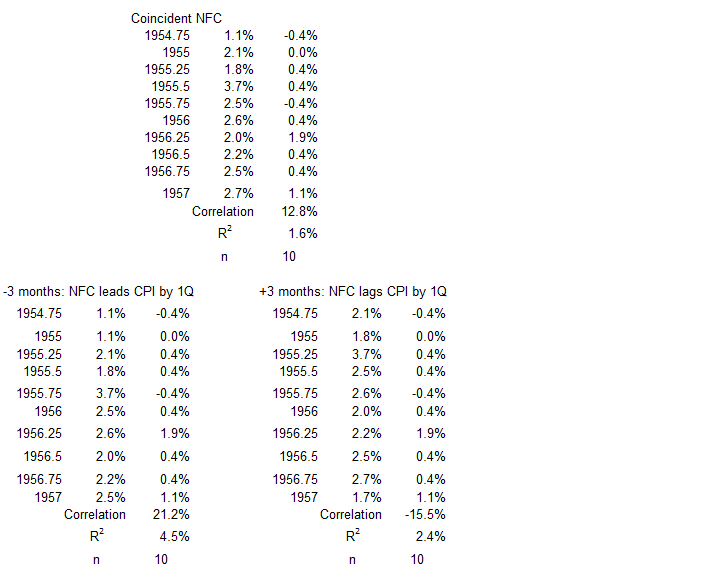
The association (correlation) between nonfinancial corporate credit changes and CPI Inflation is very weakly positive for this inflation surge period. R = 12.8%, R2 = 1.6%.
Figure 3. Correlation Between Nonfinancial Corporate Credit and CPI Inflation 1Q 1955 – 1Q 1957
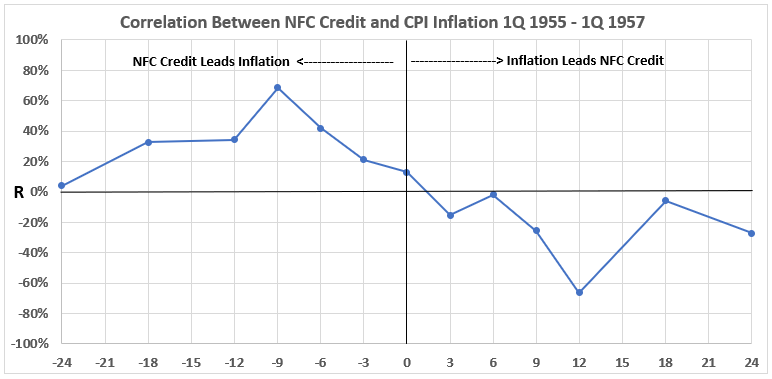
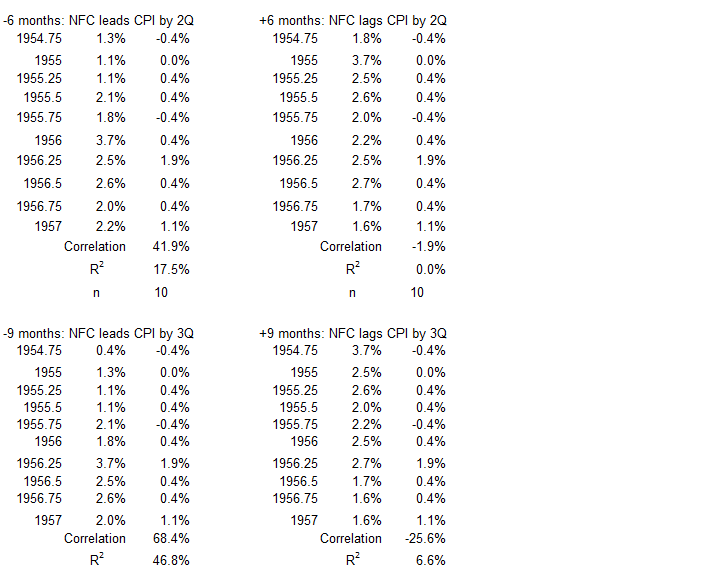
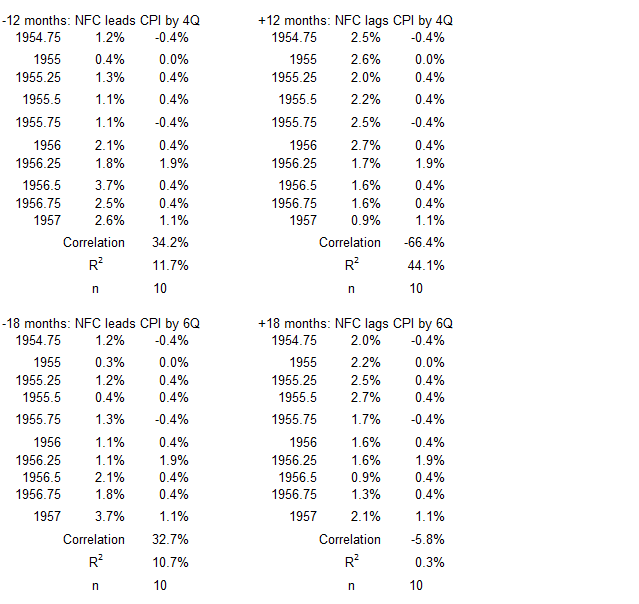
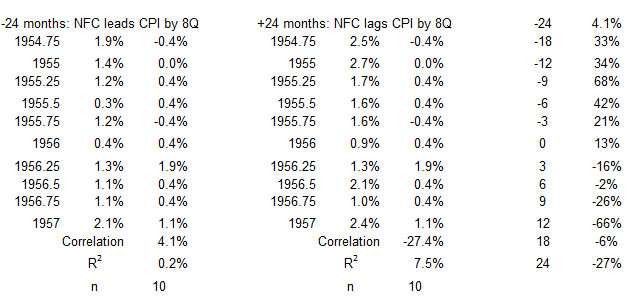
There is one moderate association between nonfinancial corporate credit and CPI Inflation when credit proceeds inflation by nine months. R = 68% and R2 = 48%. All the other associations for credit changes preceding inflation are weak or very weak. All associations for inflation preceding credit changes are negative. Only when inflation precedes credit change by 12 months is the association in the moderate range. R = –66%, R2 = 48%. All other associations on the right side of Figure 3 are weak, very weak, or negligible.
The data for CPI leading nonfinancial corporate credit changes in time (right-hand side of the graph) indicates that rising CPI might possibly cause reduced credit growth. Another reason for the negative association could be that declining inflation (disinflation) could increase credit growth. The first of these suggestions is consistent with a reduced demand for credit when interest rates rise, as they usually do during increasing inflation. The second suggestion makes sense because demand for credit should tend to increase when interest rates fall. We do not explore these ideas further in this analysis except to note some other time periods when this may be indicated.
One caveat: All the discussion above is based on only one moderate association of each side of the graph. The lack of other moderate correlations should be a caution. The two isolated moderate associations may be spurious and arise from other variables not considered.
2Q 1959 – 4Q 1969
The time period from 1959 to 1969 constitutes a period of inflation growth by our definition – a growth of inflation by 4% or more without a pullback greater than 1.5%. However, the decade can be divided into a period of slower inflation growth (1959-1964) and one of more rapid growth 1965-1969. Therefore, we have analyzed the association of nonfinancial corporate credit and inflation in the time periods.
Figure 4. Nonfinancial Corporate Credit and Inflation 1Q 1959 – 4Q 1964
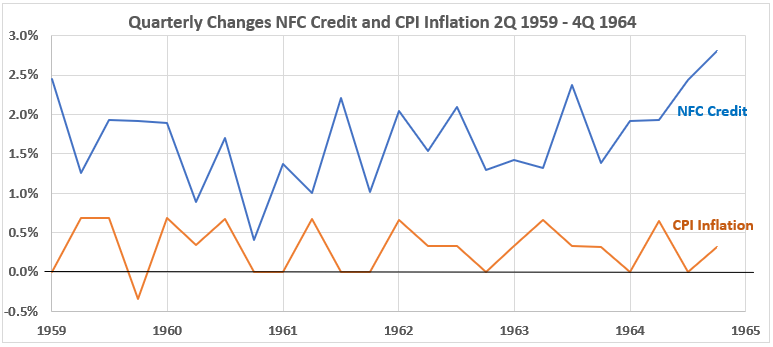
The quarterly changes in nonfinancial corporate credit, and especially inflation, were flat during this period.
Figure 5. Quarterly Changes in Nonfinancial Corporate Credit (x) vs. CPI Inflation (y) 1Q 1959 – 4Q 1964
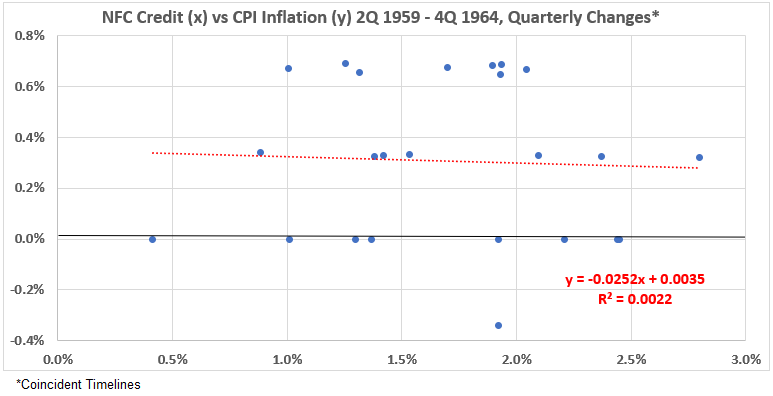
This scatter diagram is quite unremarkable. R = –4.7%, R2 = 0.2%.
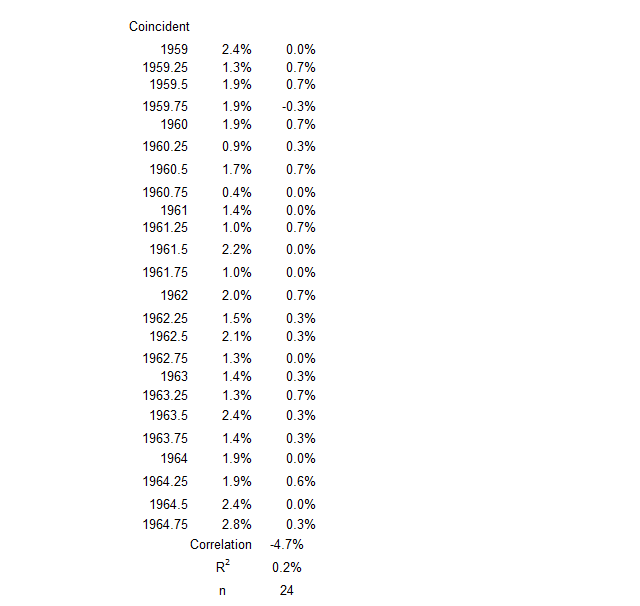
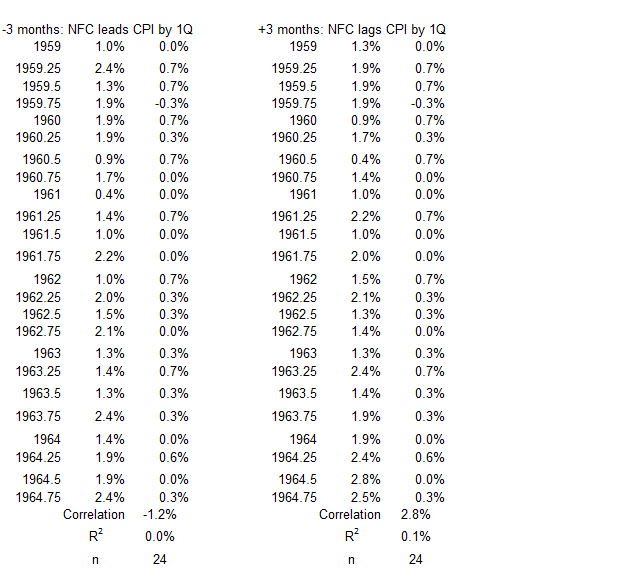
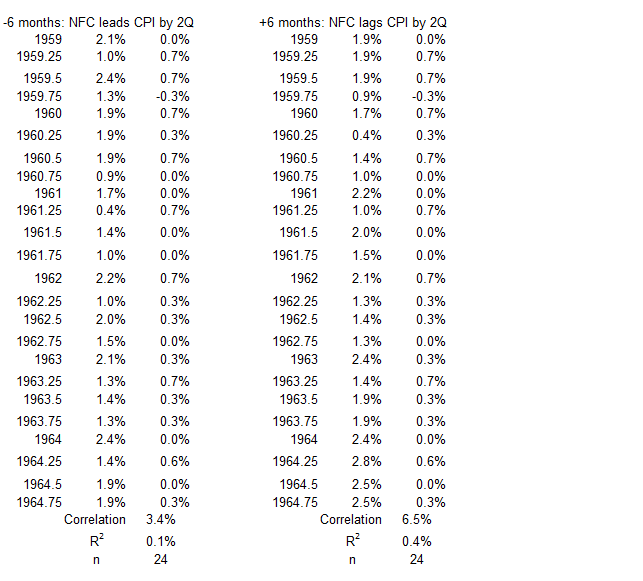
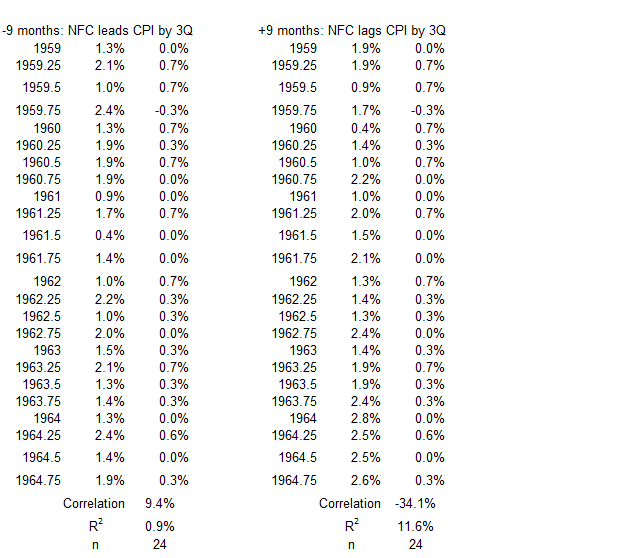
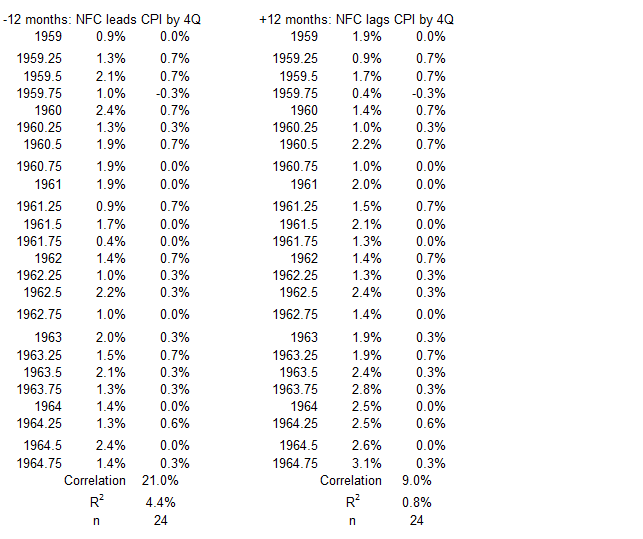
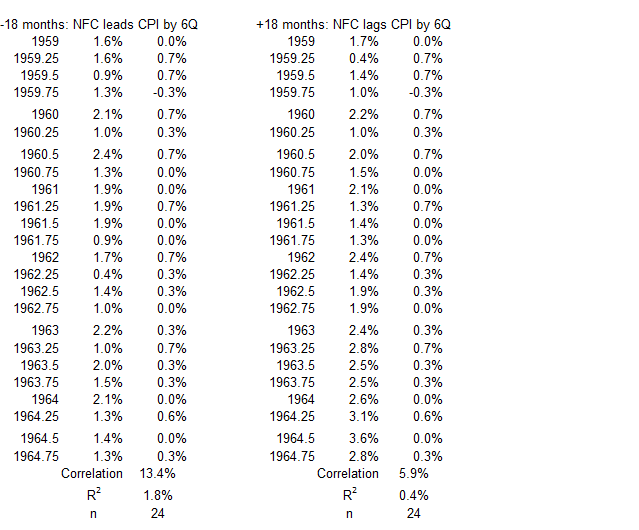
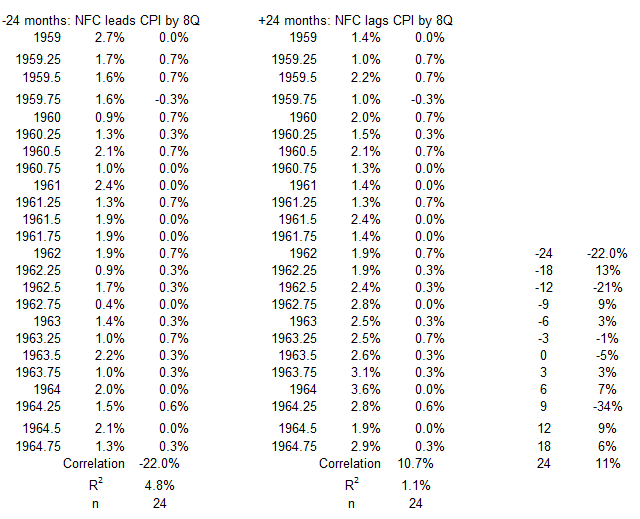
Figure 6. Correlation Between Nonfinancial Corporate Credit and CPI Inflation 1Q 1959 – 4Q 1964
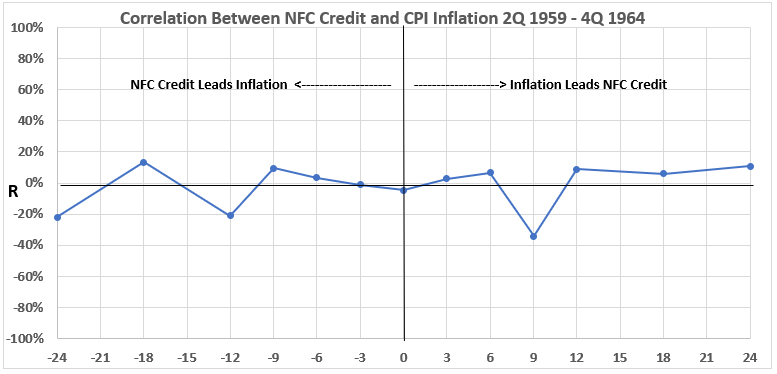
There is a nearly completely negligible association between the two variables during this time period.
1Q 1965 – 4Q 1969
Figure 7. Nonfinancial Corporate Credit Growth and Inflation 1Q 1965 – 4Q 1969
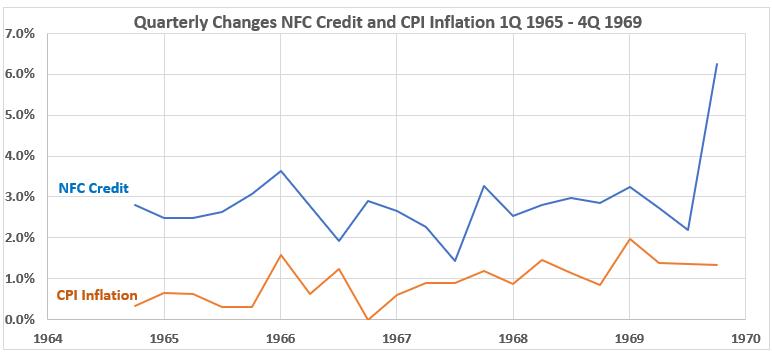
There are only two things to point out here. First, inflation has a general uptrend here, with more persistence after 1966. Secondly, the credit growth trend was flat here until a sharp spike in the fourth quarter of 1969.
Figure 8. Quarterly Changes in Nonfinancial Corporate Credit (x) vs. CPI Inflation (y) 1Q 1965 – 4Q 1969
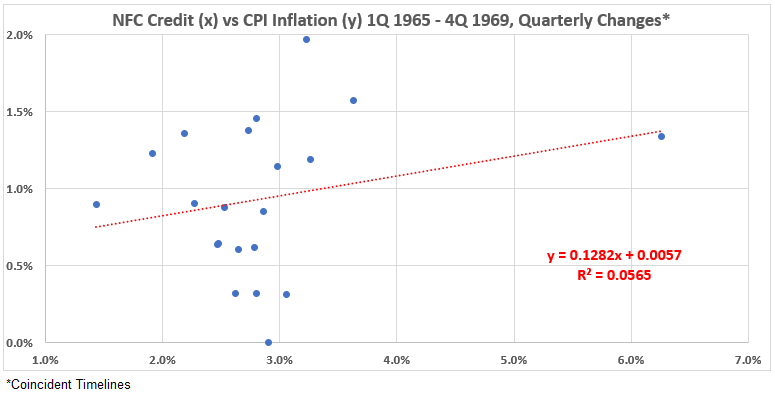
The data point from the fourth quarter of 1969 on the extreme right looks like an outlier compared to the rest of the data. However, it lies right on the trend line, so it “belongs.” Because of the far-right data point, it can be argued that the data might belong to a football-shaped distribution representative of normally distributed data.6 However, that may be a stretch – I will withhold a conclusion on that point pending further review. For this data R = 24%, R2 = 5.6%.
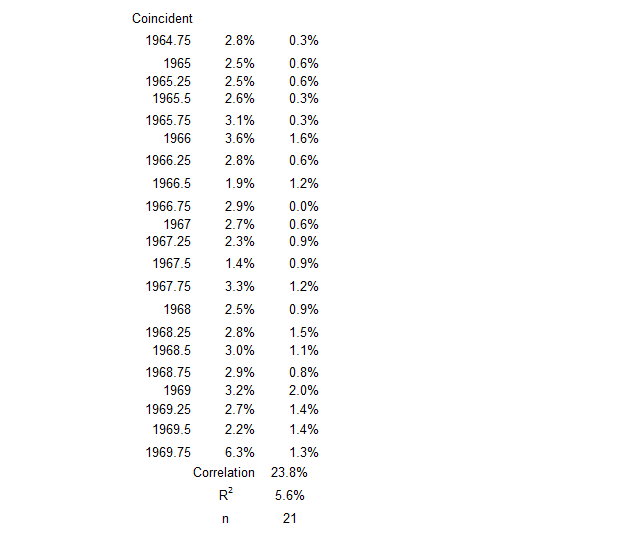
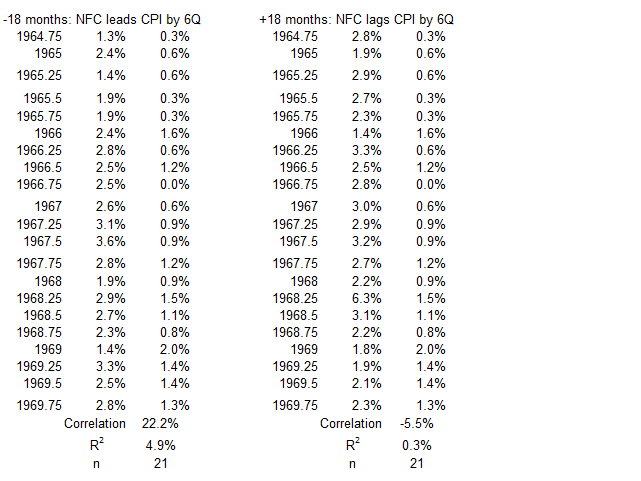
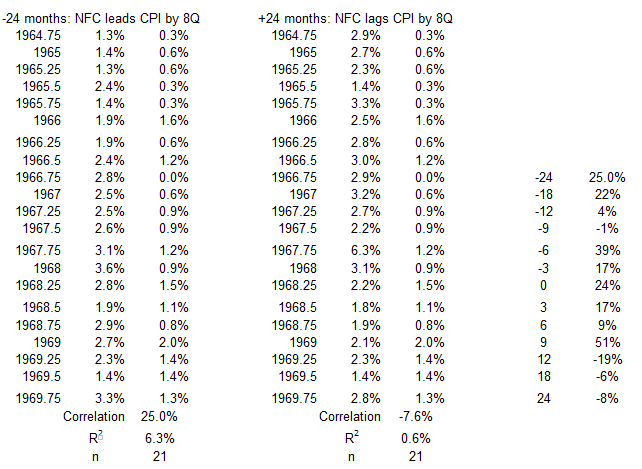
Figure 9. Correlation Between Nonfinancial Corporate Credit and CPI Inflation 1Q 1965 – 4Q 1969
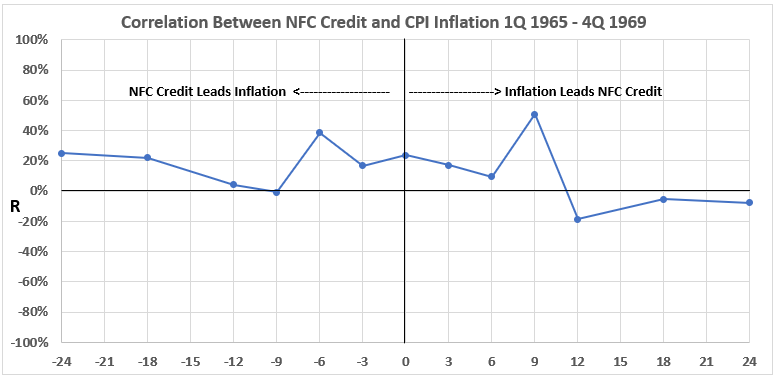
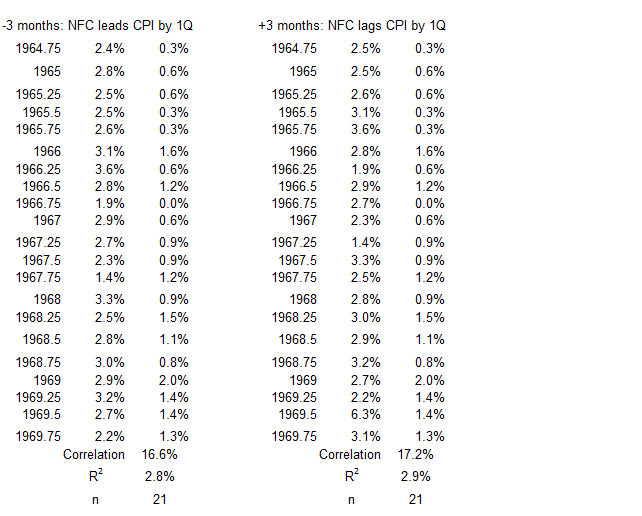
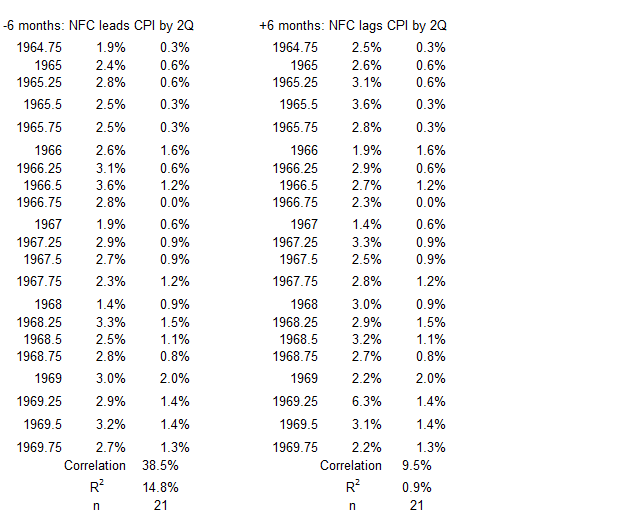
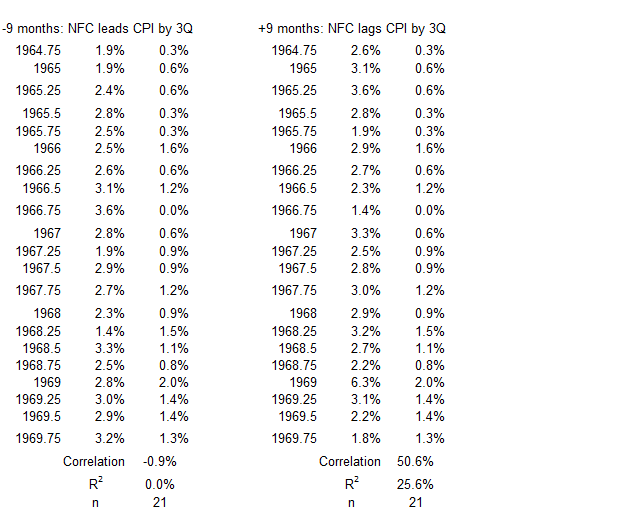
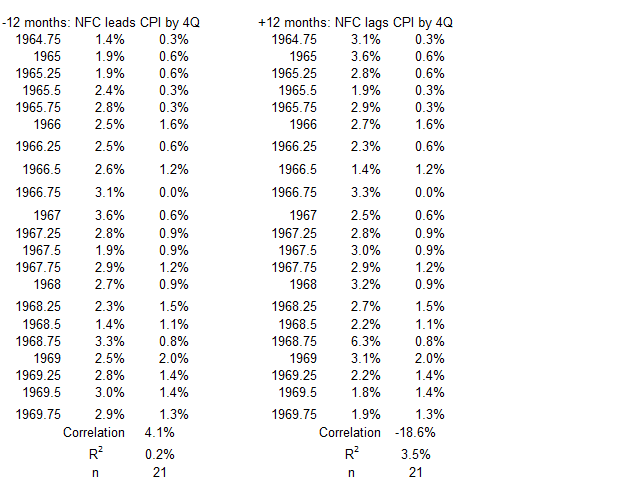
There is a weak or negligible association between the two variables during this time period, except for inflation occurring nine months before a credit change. In that case, R = 51%, just barely in the low edge of moderate association. It is not likely that there were any cause-and-effect relationships between nonfinancial corporate credit changes and inflation during this time period.
3Q 1972 – 3Q 1974
Figure 10. Nonfinancial Corporate Credit and Inflation 2Q 1972 – 3Q 1974
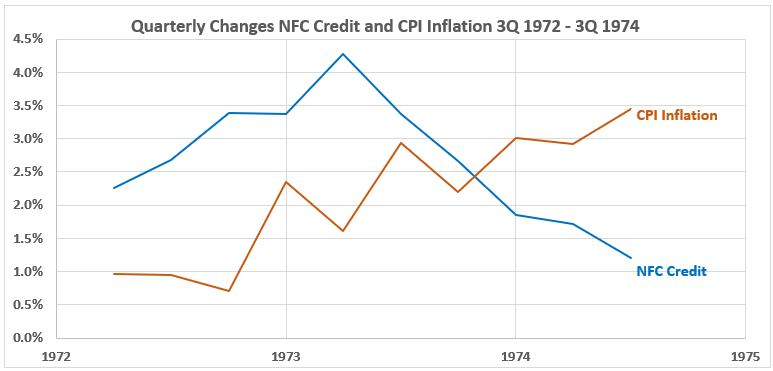
Nonfinancial corporate credit quarterly changes start with an uptrend and reverse in the second quarter of 1973. CPI Inflation changes are trending up for the entire time period.
Figure 11. Quarterly Changes in Nonfinancial Corporate Credit (x) vs. CPI Inflation (y) 3Q 1972 – 3Q 1974
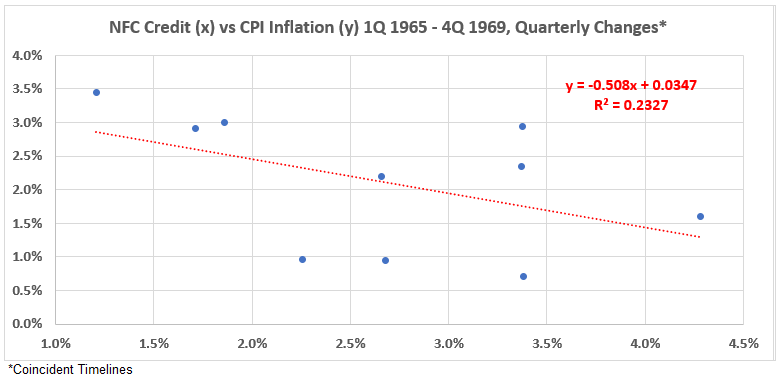
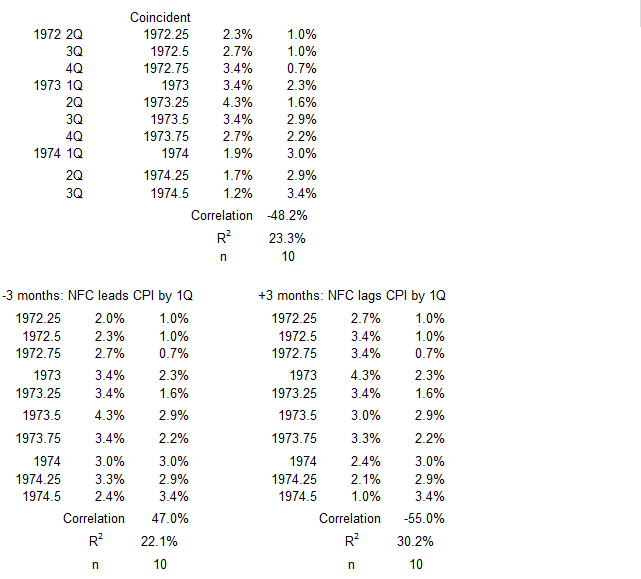
The coincident timeline data shows a weak negative association (R = –48% and R2 = 23%).
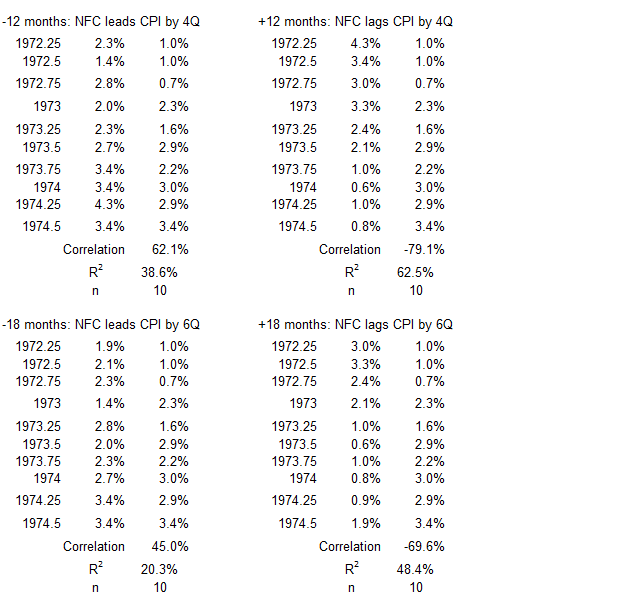
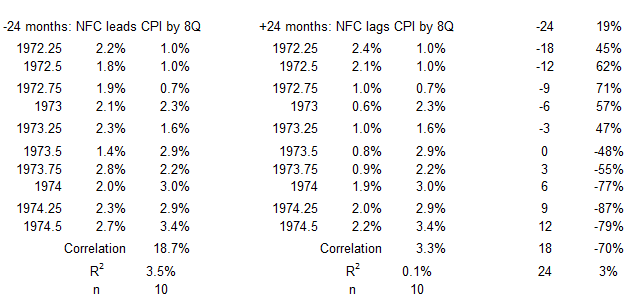
Figure 12. Correlation Between Nonfinancial Corporate Credit and CPI Inflation 3Q 1972 – 3Q 1974
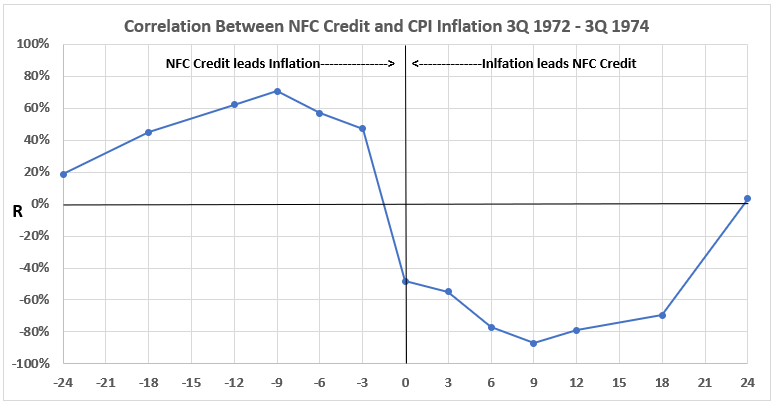
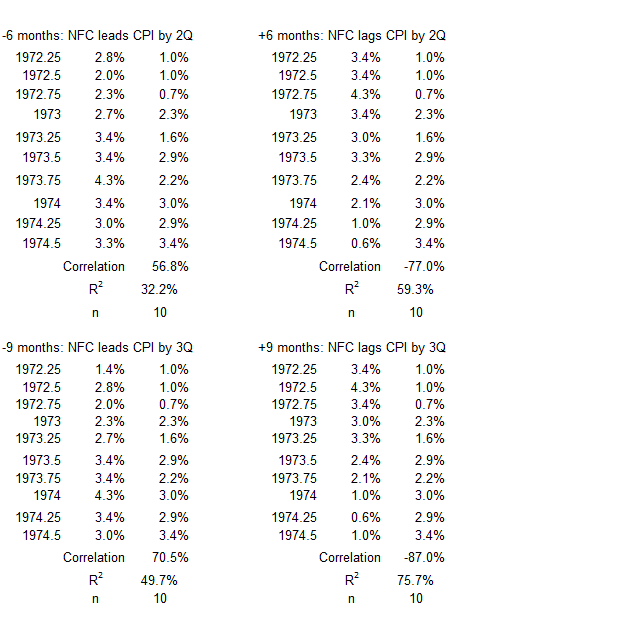
There are moderate and strong associations (correlations) when nonfinancial corporate credit changes preceded CPI Inflation by 6, 9, and 12 months. These results indicate that it is possible for credit growth to have contributed to rising inflation here.
There are strong negative associations for inflation leading credit by six to eighteen months. See the discussion following Figure three for what this might mean. The case for possible cause-and-effect here is stronger than in Figure 3.
1Q 1977 – 1Q 1980
Figure 13. Nonfinancial Corporate Credit and Inflation 1Q 1977 – 1Q 1980
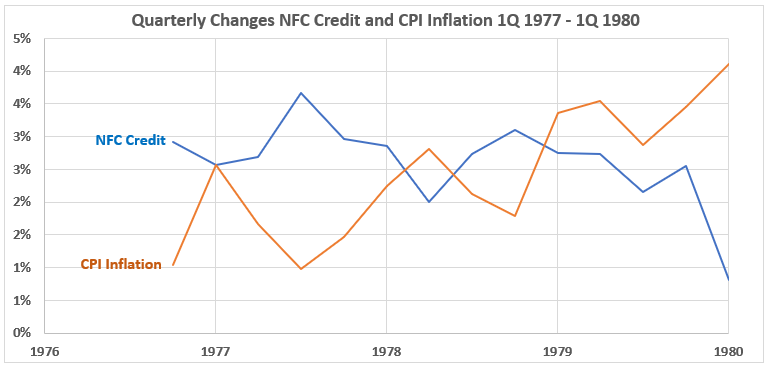
Figure 13 shows nonfinancial corporate credit changes in a slow downtrend trend until a sharp decline in the first quarter of 1980. CPI Inflation changes are in an uptrend, with a spike in the first quarter of 1977.
Figure 14. Quarterly Changes in Nonfinancial Corporate Credit (x) vs. CPI Inflation (y) 1Q 1977 – 1Q 1980
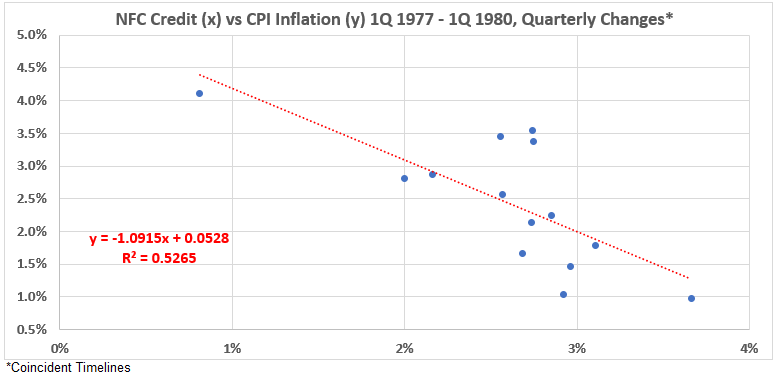
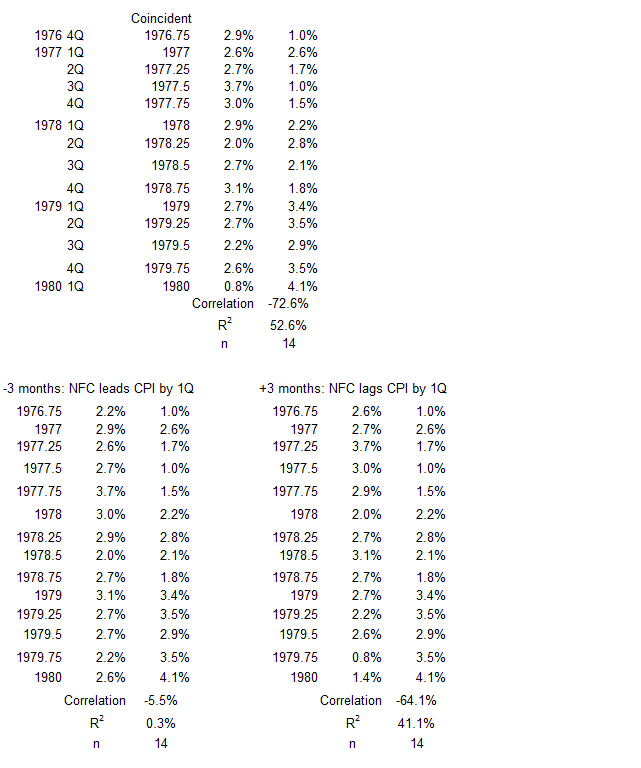
The association between the two variables with coincident timelines is strongly negative. R = –73% and R2 = 53%.
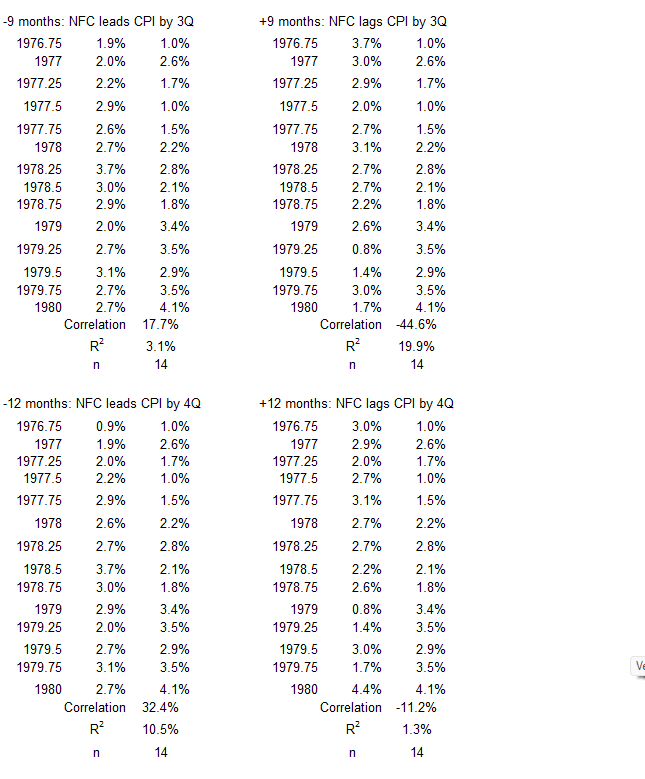
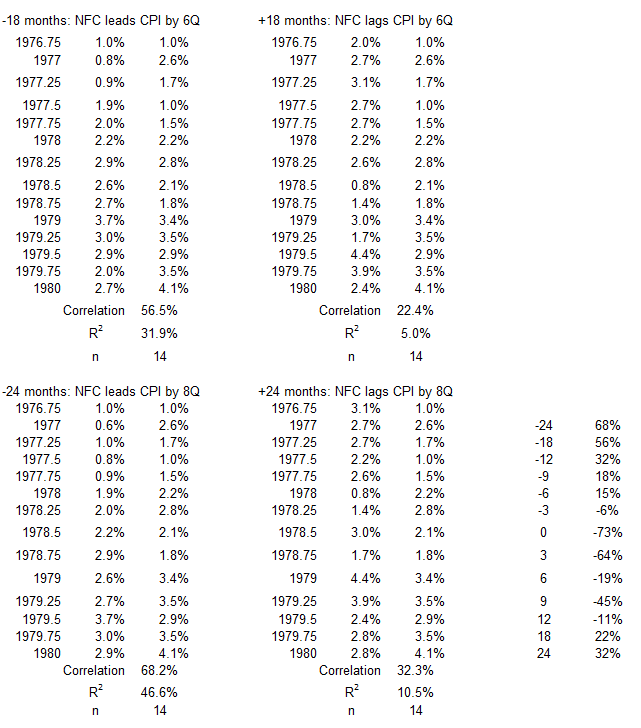
Figure 15. Correlation Between Nonfinancial Corporate Credit and CPI Inflation 1Q 1977 – 1Q 1980
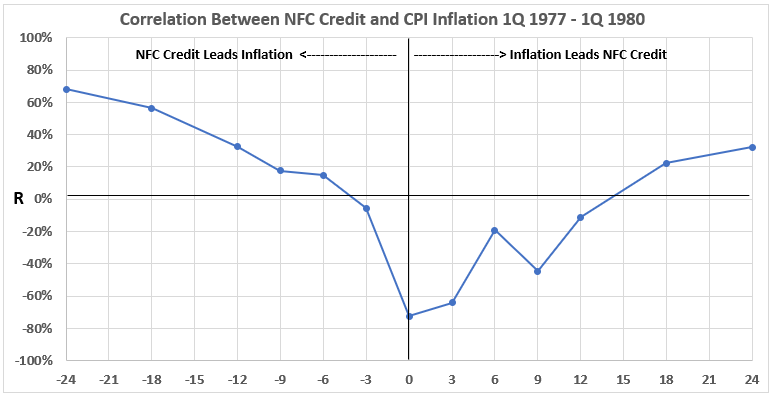
Figure 15 is similar to Figure 12, with two exceptions. The first difference is that moderate associations (correlations) occur here only when nonfinancial corporate credit changes lead CPI inflation changes by 18 and 24 months. This suggests a lower possibility for credit increases to be a cause of inflation in this period.
The second difference is that the negative association when inflation occurs before the credit changes also suggests less likelihood that inflation changes could be affecting credit.
1Q 1987 – 3Q 1990
Figure 16. Nonfinancial Corporate Credit and Inflation 1Q 1987 – 3Q 1990
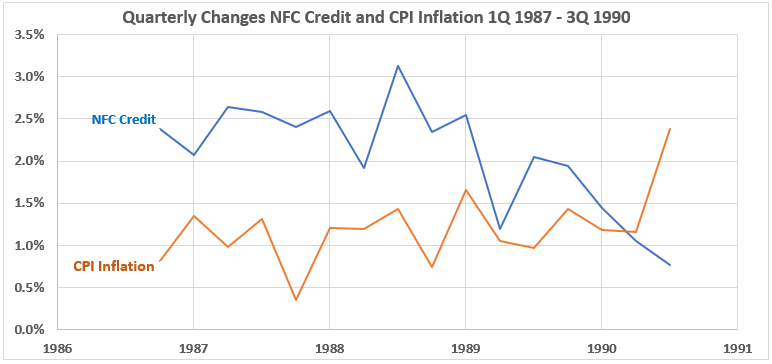
This shows gradual uptrending changes in CPI Inflation while nonfinancial corporate credit changes are in a downtrend with a spike in the third quarter of 1988.
Figure 17. Quarterly Changes in Nonfinancial Corporate Credit (x) vs. CPI Inflation (y) 1Q 1987 – 3Q 1990
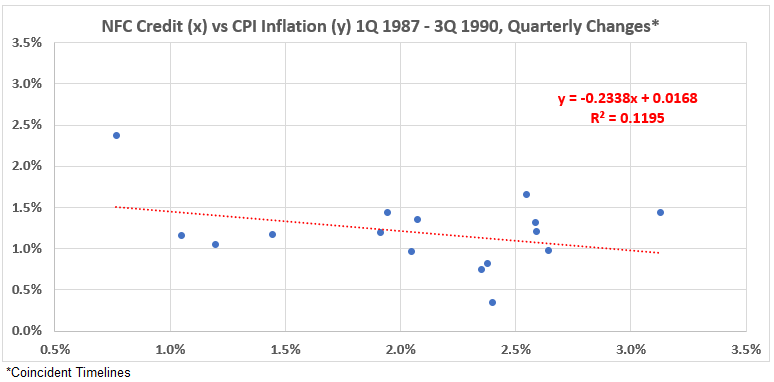
Figure 17 data set shows a weak negative association between the coincident timeline data sets, R = –35% and R2 = 12%.
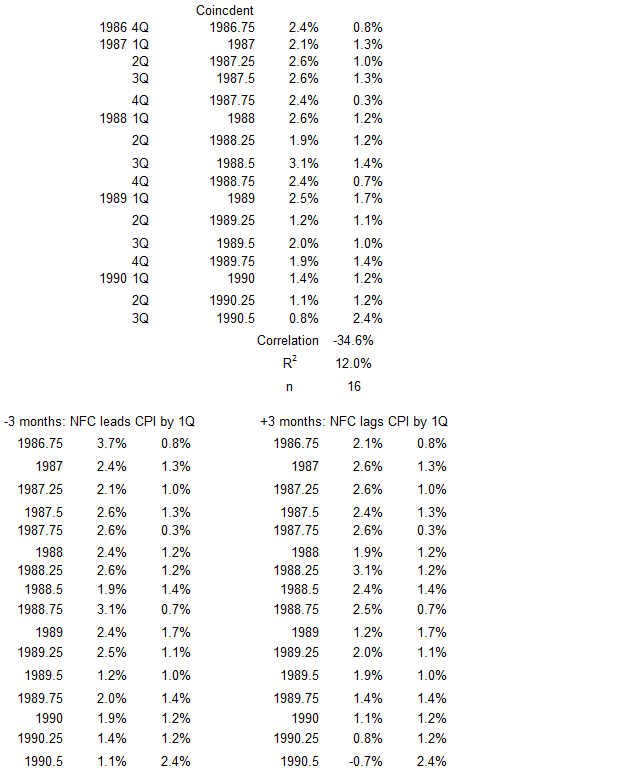
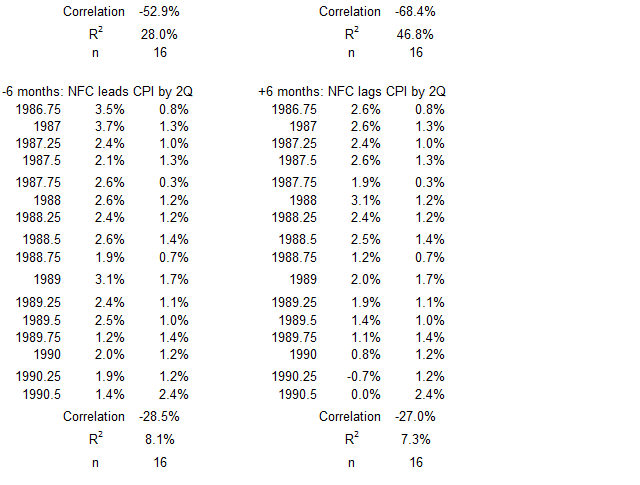
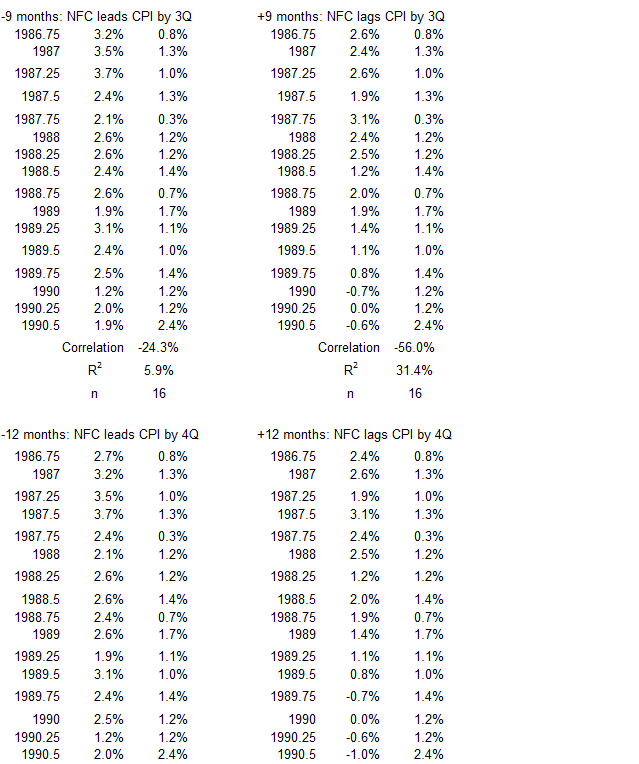
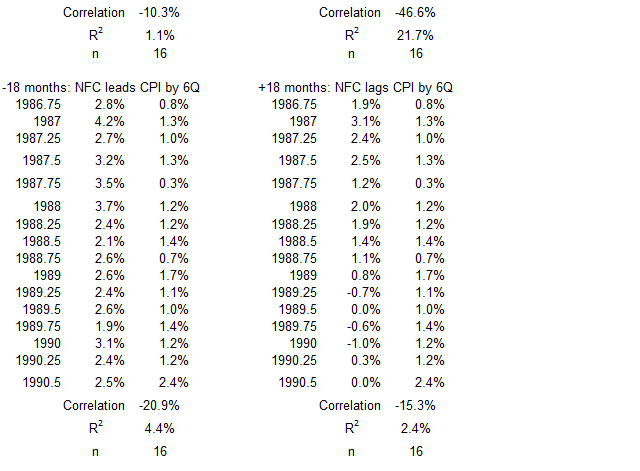
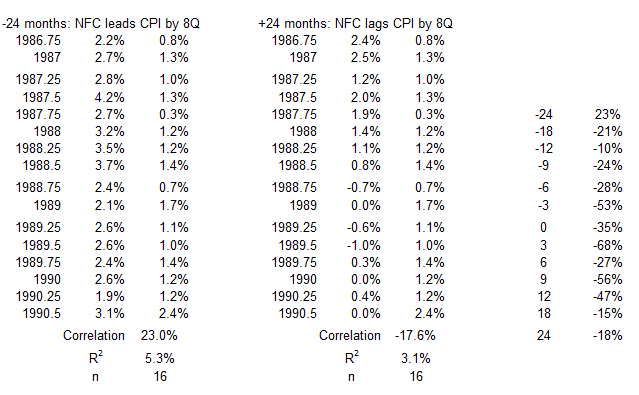
Figure 18. Correlation Between Nonfinancial Corporate Credit and CPI Inflation 1Q 1987 – 3Q 1990
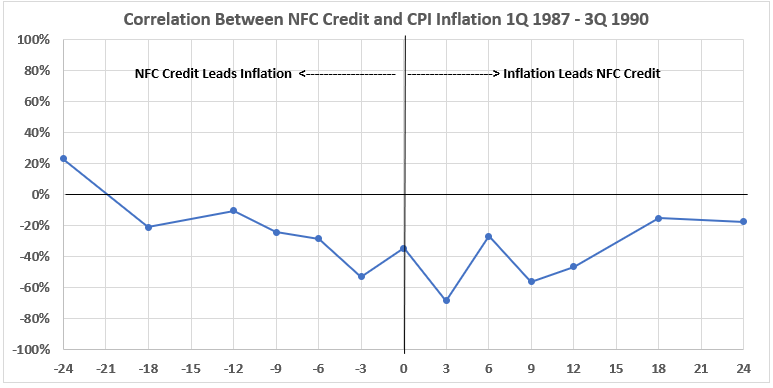
There is not much remarkable about this correlation diagram. The strongest associations are negative. They are all weak, except for credit leading inflation by three months (R2 = 28%) and for inflation leading credit by three months (R2 = 46%) and nine months (R2 = 31%). This does not offer much opportunity for appreciable cause-and-effect relationships.
4Q 2006 – 2Q 2008
Figure 19. Nonfinancial Corporate Credit and Inflation 4Q 2006 – 2Q 2008
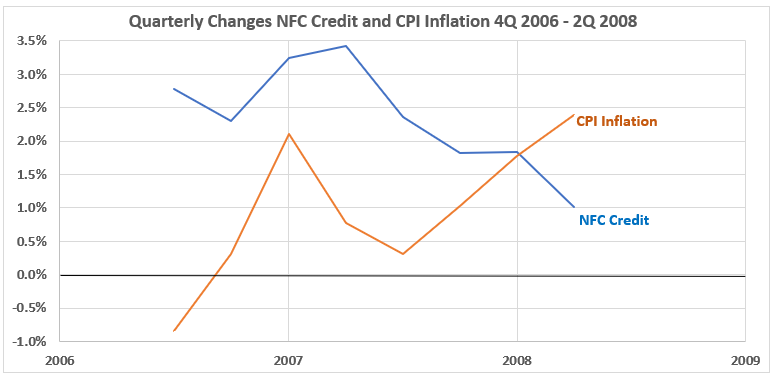
This period covers the end of the housing bubble peak and the start of the stock market decline that was part of the Great Financial Crisis of 2008-09. Again, we see the familiar pattern for coincident timelines data: A declining trend for nonfinancial corporate credit quarterly changes and an increasing trend for CPI inflation changes. Also, there was a one-quarter inflation spike in the first quarter of 2007.
Figure 20. Quarterly Changes in Nonfinancial Corporate Credit (x) vs. CPI Inflation (y) 4Q 2006 – 2Q 2008
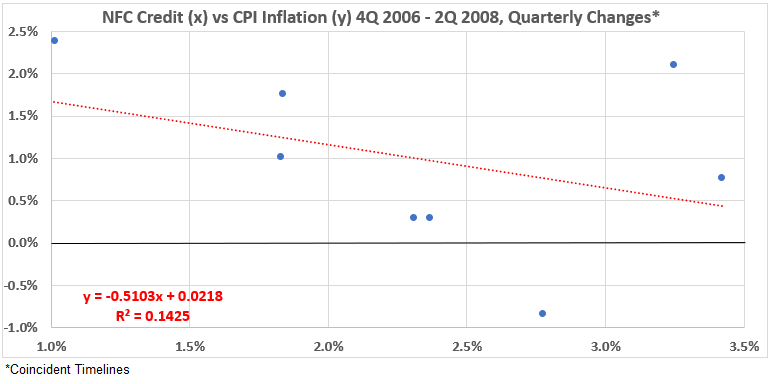
As so often the case in this study, the coincident data sets show a negative correlation, this time weak. R = –38% and R2 = 14%.
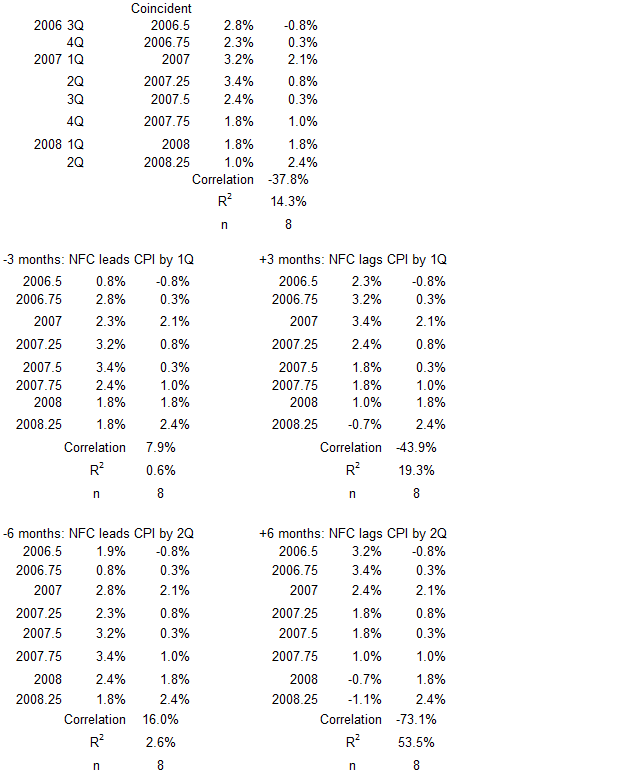
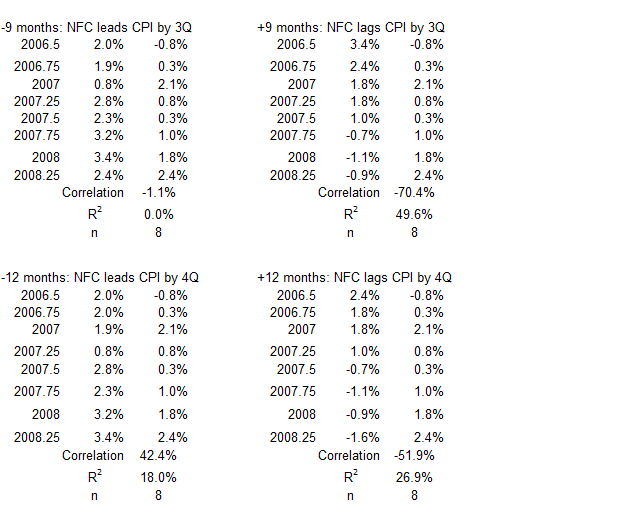
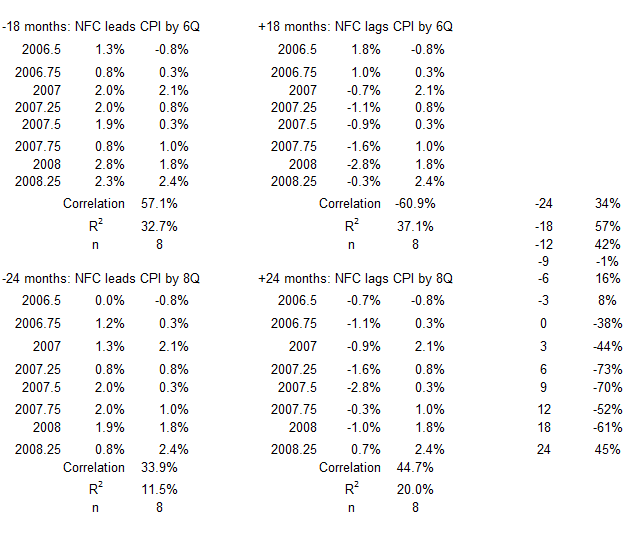
Figure 21. Correlation Between Nonfinancial Corporate Credit and CPI Inflation 4Q 2006 – 2Q 2008
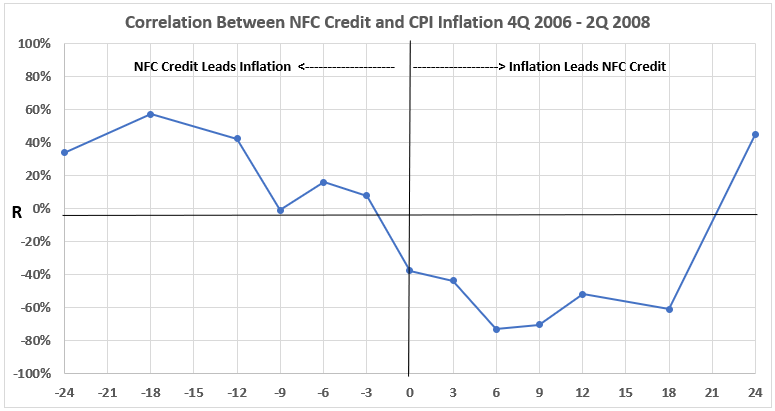
Figure 21 is similar to Figure 15 for the inflation surge from 1977-1980. The negative associations for nonfinancial corporate credit changes coming before CPI Inflation changes are a little stronger here than in Figure 15. The same is true for the negative associations for inflation occurring before credit changes. See the discussion following Figure 15.
3Q 2009 – 2Q 2011
Figure 22. Nonfinancial Corporate Credit Debt and Inflation 3Q 2009 – 2Q 2011
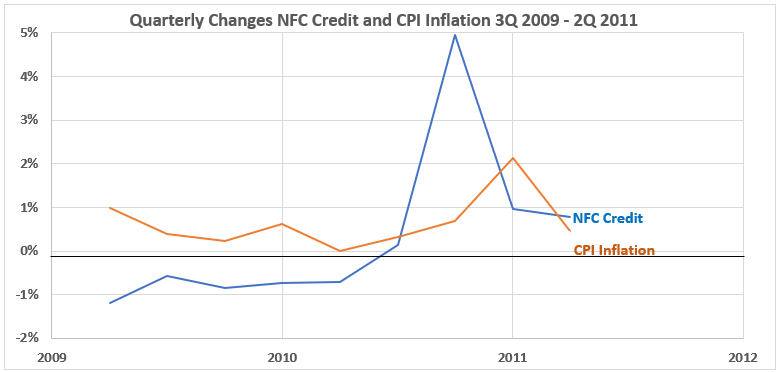
This period is different from the previous inflation surges. Nonfinancial corporate credit changes are less than inflation changes for much of the period, except for a gigantic spike in the fourth quarter of 2010. The credit change trend (except for the spike) is slowly upward. The inflation change trend is nearly flat, except for a small spike one quarter after the credit spike. That suggests, at least for that one six-month interval, there might be a possible inflation push from the credit surge.
Figure 23. Quarterly Changes in Nonfinancial Corporate Credit (x) vs. CPI Inflation (y) 3Q 2009 – 2Q 2011
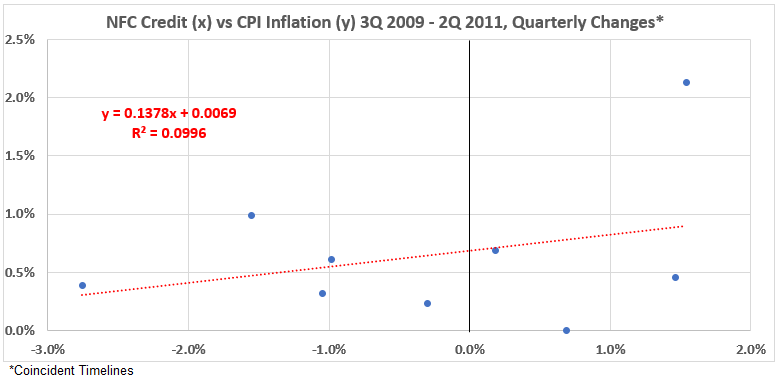
This inflation surge has a positive correlation between nonfinancial corporate credit change and inflation change. The association is weak, R = 32% and R2 = 10%.
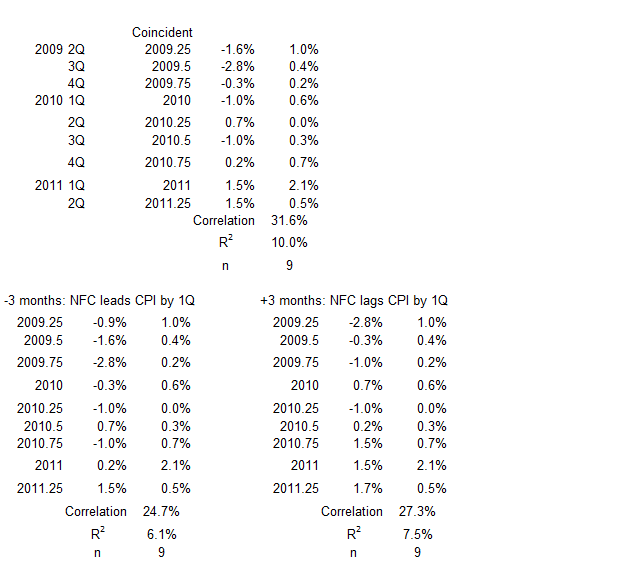
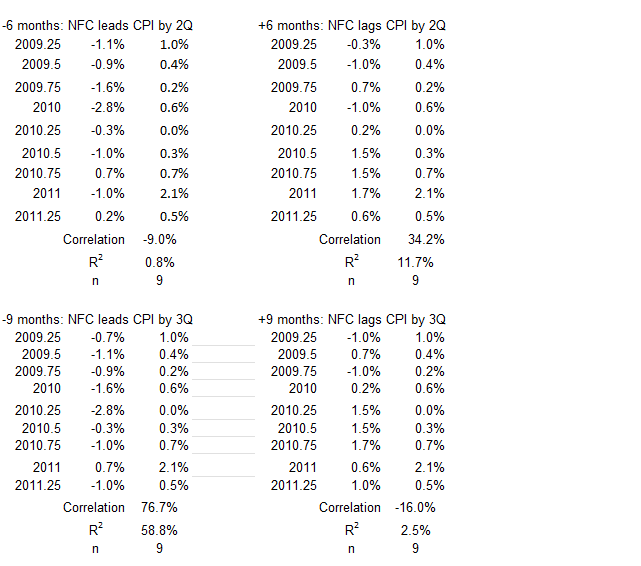
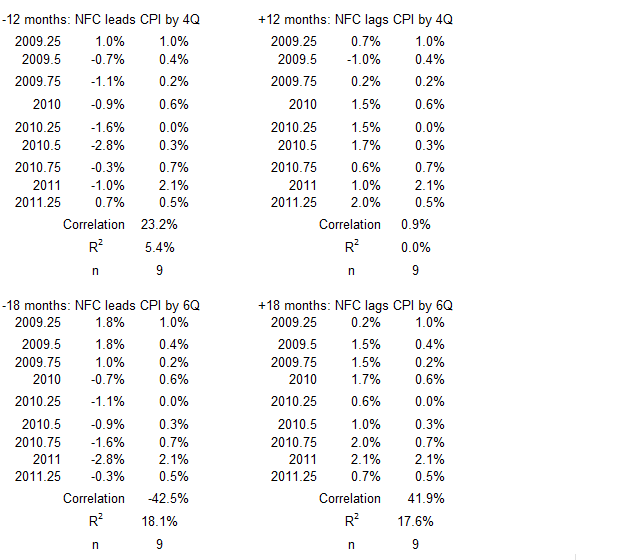
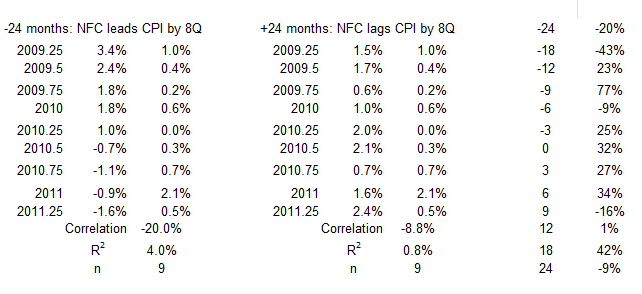
Figure 24. Correlation Between Nonfinancial Corporate Credit and CPI Inflation 3Q 2009 – 2Q 2011
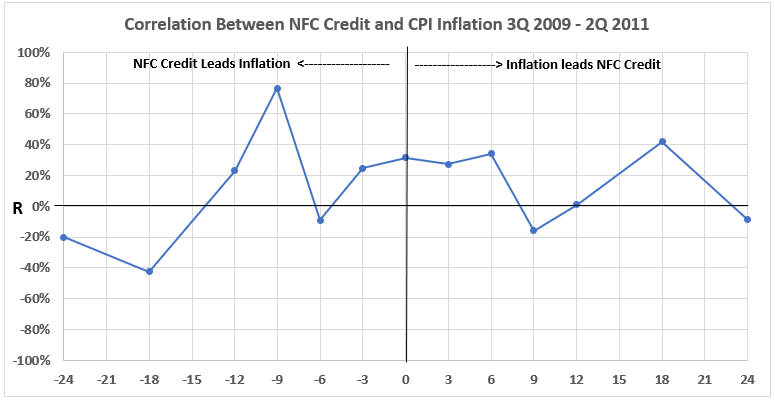
Most of the associations here are weak or negligible. The one exception is a strong association when nonfinancial corporate credit change occurs nine months before inflation changes. Because this is a singular point in the curve, a rationalization for cause and effect here is problematic. However, it should not be dismissed without further information.
2Q 2020 – 2Q 2022
Figure 25. Nonfinancial Corporate Credit Debt and Inflation 1Q 2020 – 2Q 2022
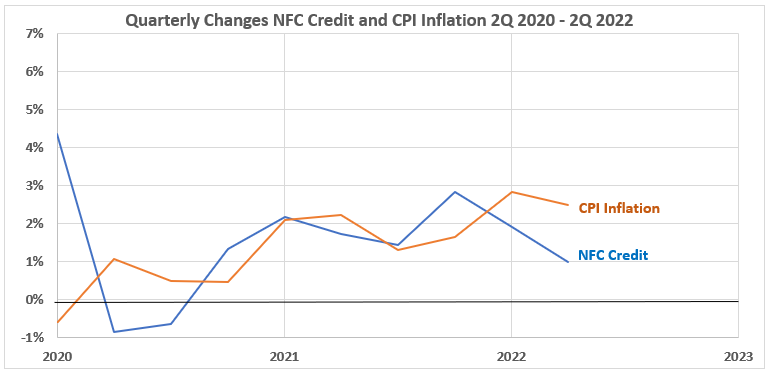
During most of this time period (first three quarters excepted), both nonfinancial corporate credit changes and inflation changes were in close agreement in magnitude and trend. This was not seen in any other inflation surge period.
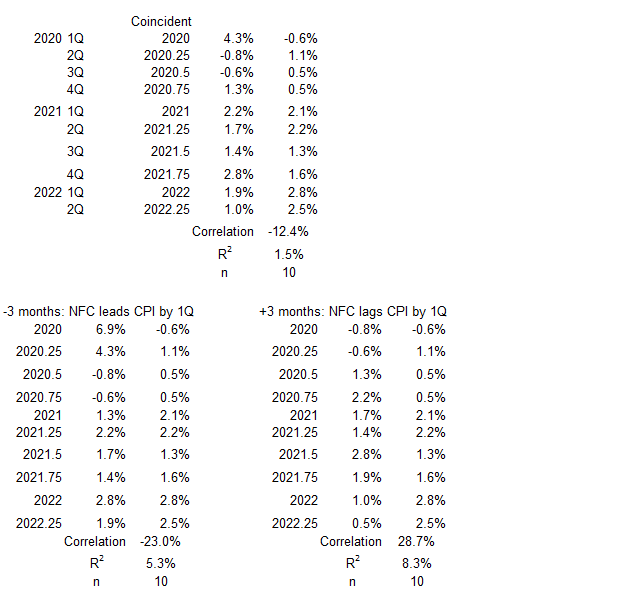
Figure 26. Quarterly Changes in Nonfinancial Corporate Credit (x) vs. CPI Inflation (y) 1Q 200 – 2Q 2022
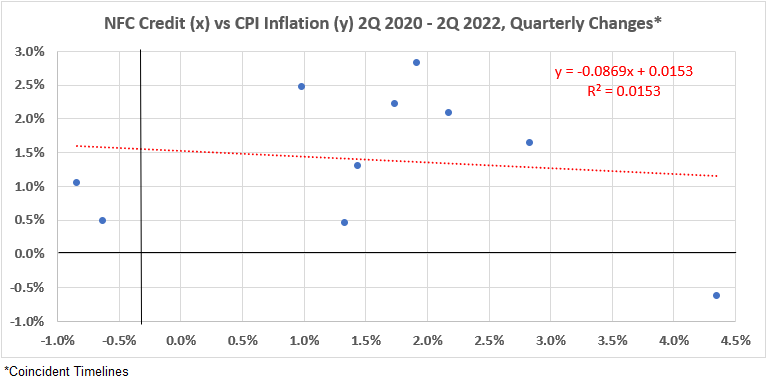
Here, we see another small negative association for the concurrent timeline data sets. R = –12% and R2 = 1.5%.
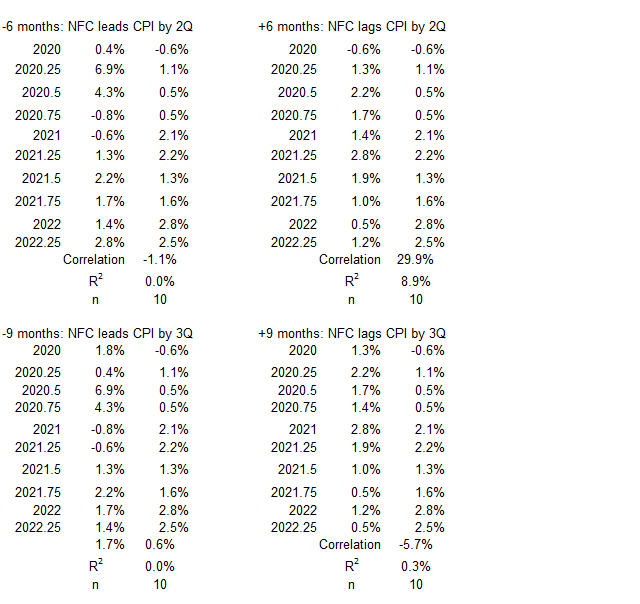
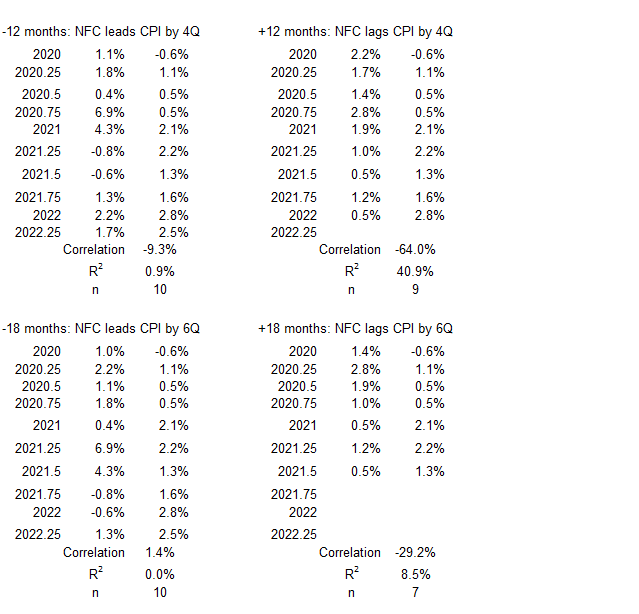
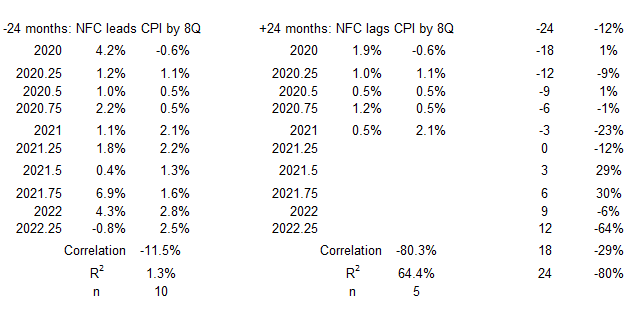
Figure 27. Correlation Between Nonfinancial Corporate Credit and CPI Inflation 1Q 2020 – 2Q 2022
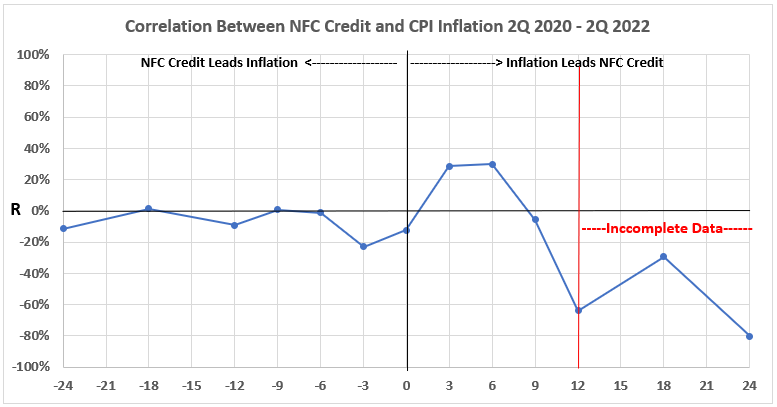
There is little in this data to support any meaningful cause-and-effect possibilities between nonfinancial corporate credit changes and inflation. There is a weak positive association when inflation change occurs three and six months before credit changes. R values ~30% and R2 value 8.4% – 9%. This indicates that less than 10% of credit changes in this period could be the result of inflation change.
Conclusion
Observations here are somewhat different than previous studies of federal government deficit spending,3 consumer credit,4 and mortgage debt.5
There have been few possibilities for meaningful cause-and-effect relationships between nonfinancial corporate credit changes and changes in inflation for the eight inflation surges between 1952 and 2022. Leaving out the cases where only one spike occurred on either side of the correlation graphs, only
In drawing these conclusions, we are ignoring associations with 18- and 24-month separations.
There is only one occasion where nonfinancial corporate credit changes could possibly have caused important changes in inflation. In the inflation surge of 1972-1974, R2 values indicate it is possible that 40-50% of the inflation might have been caused by the credit increases. Other information is required to prove that the credit increases caused any of the inflation.
On several occasions, inflation may have been the cause of opposite changes in nonfinancial corporate credit. These are:
- In 1972-74, inflation changes may account for up to 70% of the opposite change in credit.
- In 1977-80, inflation changes may account for up to 50% of the opposite change in credit.
- In 1987-90, inflation changes may account for up to 46% of the opposite change in credit.
- In 2006-08, inflation changes may account for up to 50% of the opposite change in credit.
Further conclusions will be discussed after we have the data for the deflationary surges and the periods with more stable inflation for the 1952-2011 period. More results there next week.
Appendix
The data sets for each of the periods of surging inflation are below. They come from the tables of timeline alignments1 (Nonfinancial Corporate Credit and Inflation: Part 1).
1Q 1955 – 1Q 1957
2Q 1959 – 4Q 1964
1Q 1965 – 4Q 1969
3Q 1972 – 3Q 1974
1Q 1977 – 1Q 1980

1Q 1987 – 3Q 1990
4Q 2006 – 2Q 2008
3Q 2009 – 2Q 2011
1Q 2020 – 2Q 2022
Footnotes
1. Lounsbury, John, “Nonfinancial Corporate Credit and Inflation: Part 1″, EconCurrents, February 11, 2024, https://econcurrents.com/2024/02/11/nonfinancial-corporate-credit-and-inflation-part-1/.
2. Lounsbury, John, “Consumer Credit and Inflation: Part 1”, EconCurrents, September 3, 2023. https://econcurrents.com/2023/09/03/consumer-credit-and-inflation-part-1/.
3. Lounsbury, John, “Government Spending and Inflation. Reprise and Summary”, EconCurrents, August 20, 2023. https://econcurrents.com/2023/08/20/government-spending-and-inflation-reprise-and-summary/.
4. Lounsbury, John, “Consumer Credit and Inflation: Part 4”, EconCurrents, September 23, 2023. https://econcurrents.com/2023/09/23/consumer-credit-and-inflation-part-4/.
5. Lounsbury, John, “Mortgage Debt and Inflation: Part 4”, EconCurrents, October 22, 2023. https://econcurrents.com/2023/10/22/mortgage-debt-and-inflation-part-4/.
6. Freedman, David, Pisani, Robert, and Purves, Richard, Statistics, Fourth Edition, W.W. Norton & Company (New York) and Viva Books (New Delhi), 2009. See Chapters 8 & 9 for an explanation of how normal distributions relate to determining correlation coefficients. See p. 147 for a discussion of football-shaped scatter diagrams.