Lightly Edited at 7:38 pm EST January 20, 2024
On the third Thursday of the month right on schedule NOAA issued their updated Seasonal Outlook which I describe as their Four-Season Outlook because it extends a bit more than one year into the future. The information released also included the Mid-Month Outlook for the following month plus the weather and drought outlook for the next three months. I present the information issued by NOAA and try to add context to it. It is quite a challenge for NOAA to address the subsequent month, the subsequent three-month period as well as the twelve successive three-month periods for a year or a bit more.
With respect to the long-term part of the Outlook which I call the Four-Season Outlook, there is a fairly rapid transition from El Nino to ENSO Neutral to LaNina. Thus there are some changes from what was issued last month.
First, Let’s Take a Look at the (mid-month) Outlook for February.
It will be updated on the last day of January.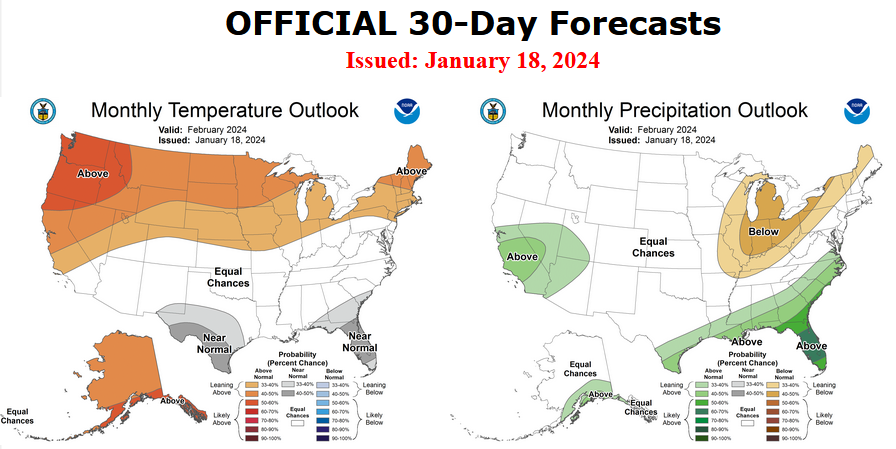
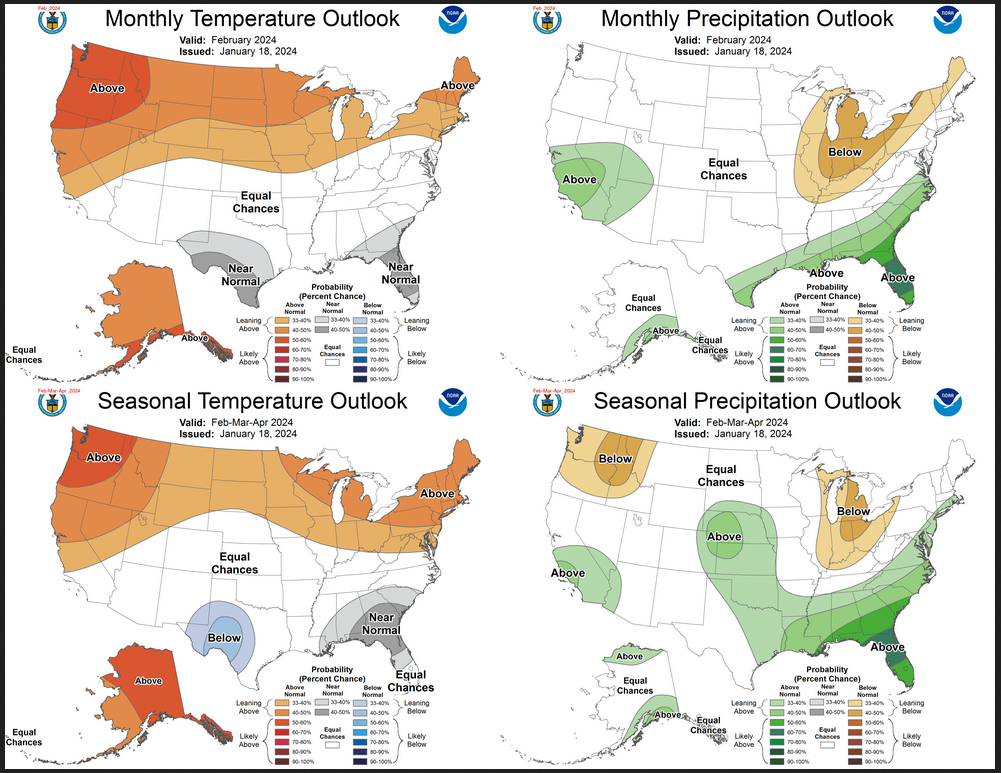
The top row is what is now called the Mid-Month Outlook for next month which will be updated at the end of this month. There is a temperature map and a precipitation map. The second row is a three-month outlook that includes next month. I think the outlook maps are self-explanatory. What is important to remember is that they show deviations from the current definition of normal which is the period 1991 through 2020. So this is not a forecast of the absolute value of temperature or precipitation but the change from what is defined as normal or to use the technical term “climatology”.
| Notice that the outlook for next month and the three-month outlooks are somewhat different, particularly with respect to precipitation. This tells us that March and April will be different than February to some extent. |

The full NOAA Seasonal Outlook extends through February/March/April of 2025. All of these maps are in the body of the article. Large maps are provided for February and the three-month period Feb/Mar/Apr. Small maps are provided beyond that through April of 2025 with a link to get larger versions of these maps.
NOAA provides an excellent discussion to support the maps. It is included in the body of this article. In some cases, one will need to click on “read more” to read the full article. For those on my email list where I have sent the url of the article, that will not be necessary.
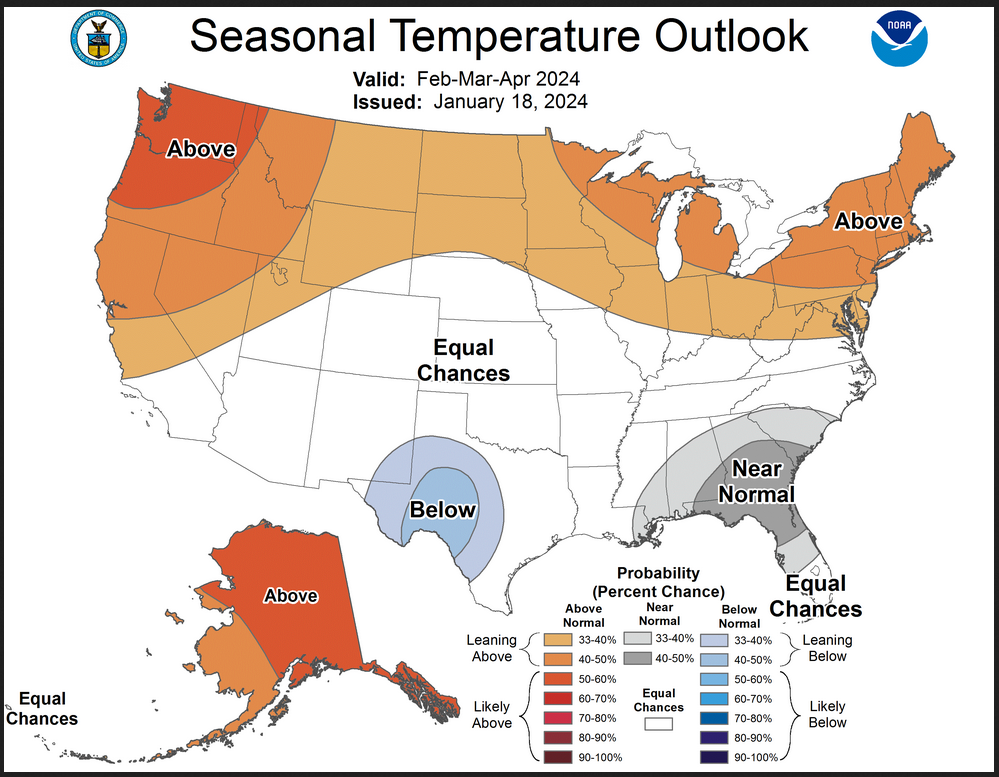
Here are larger versions of the Temperature and Precipitation Outlook maps for next month.
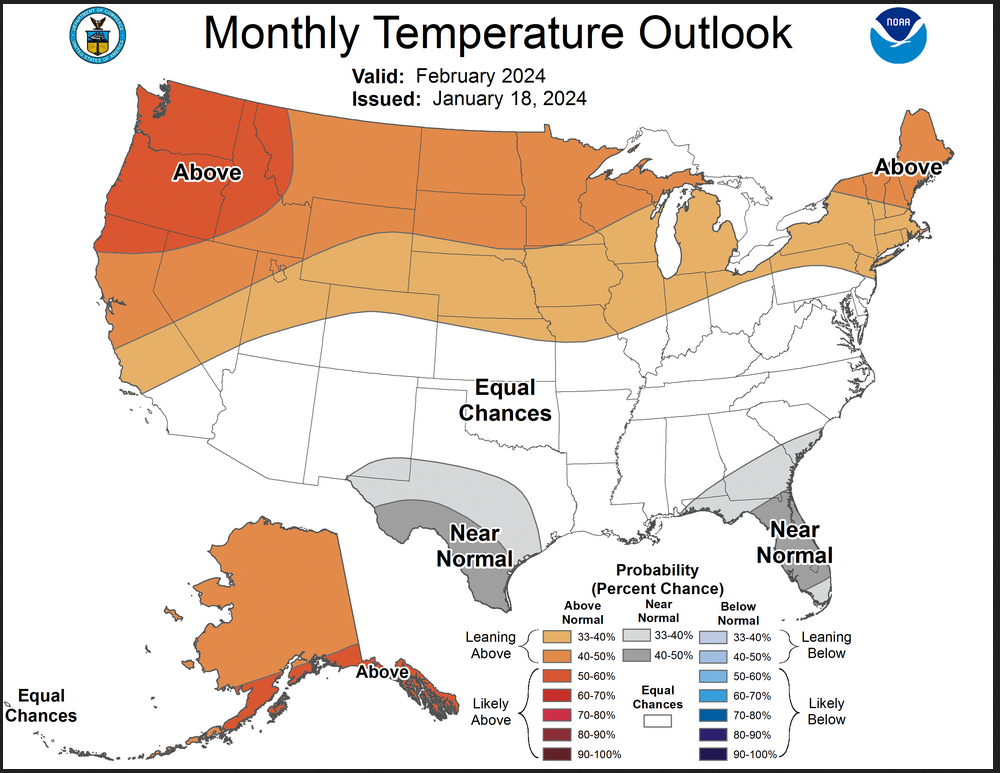
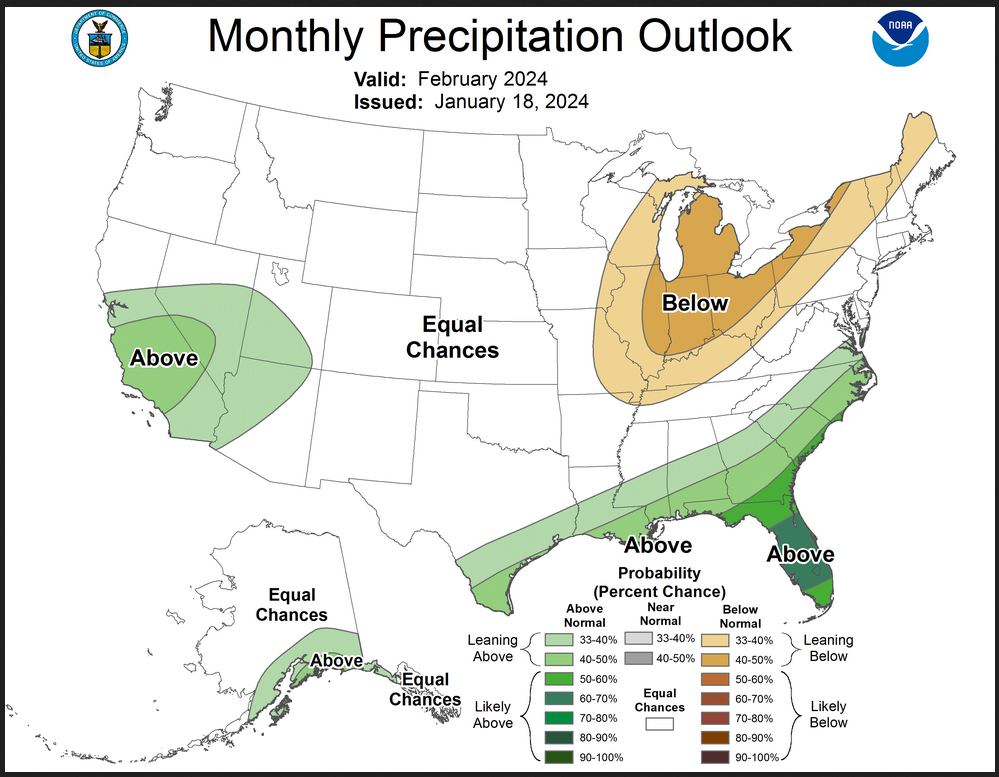
The maps are pretty clear in terms of the outlook.
And here are large versions of the three-month FMA 2024 Outlook
First temperature followed by precipitation.
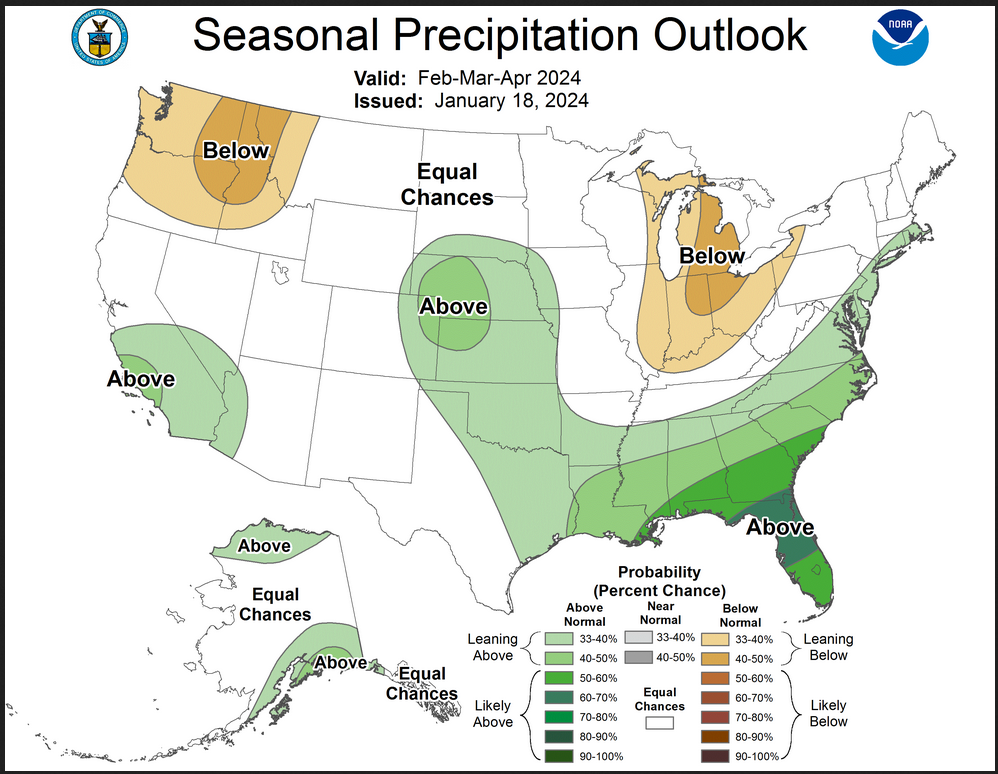
| These maps are larger versions of what was shown earlier. |
Drought Outlook
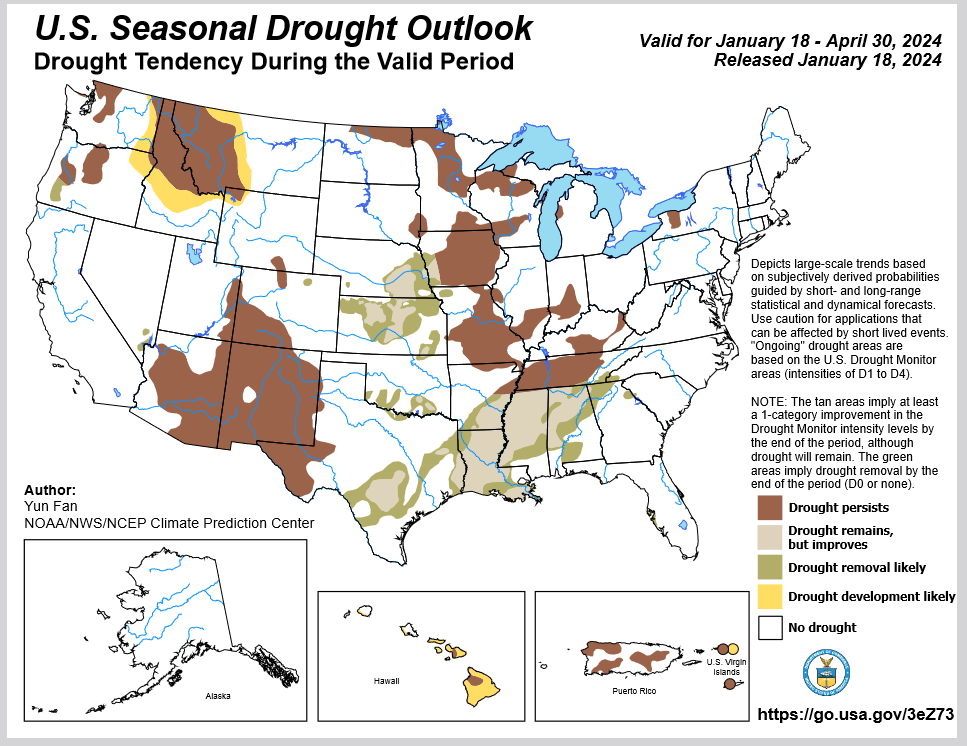
| The yellow is the bad news and there is not much of that. There is a large area where drought removal or lessening is likely to happen plus there is a large area where drought is expected to persist. Overall the level of drought is expected to decline. But those living in Arizona and Mexico might have expected more drought relief from a very strong El Nino. Hawaii is not happy with this outlook. |
Short CPC Drought Discussion
Latest Seasonal Assessment – During the past 30 days, drought has slowly improved across parts of the Pacific Northwest, Southwest, Great Plains, southeastern and northeastern contiguous U.S. (CONUS), due to the persistent Pacific flow into the western coastal regions and active storm tracks across the central and eastern CONUS. Conversely, drought expansion and intensification was observed across parts of the Northern and Central Rockies, northern Arizona, and Tennessee and Ohio Valleys where precipitation deficits continued to mount.
For the 2024 February-March-April (FMA) season, El Niño favors a continuation of improving drought conditions across parts of the southern CONUS. However, the forecast below normal precipitation across parts of the Midwest along with uncertainty in the precipitation outlook across portions of the Tennessee Valley and Northern Plains favors widespread drought persistence over these regions. Drought improvement is likely for parts of the Central Plains, where above normal precipitation is predicted. Drought removal is expected over southwestern Oregon, while persistence is forecast for the remainder of the Pacific Northwest. This is consistent with the FMA precipitation outlook. However, short-term improvements may occur throughout the Pacific Northwest due to a wet latter half of January. Drought persistence/development is forecast across parts of the Northern Rockies due to expected below normal precipitation, together with below normal snowpack over the region. Drought persistence is also favored across parts of the Southwest through the end of April due to lack of wet signals in the forecasts and also the relatively dry climatology. Alaska is forecast to remain drought-free through the end of April, with wet antecedent conditions and favorable precipitation outlooks. Conversely, antecedent dryness, El Niño, and unfavorable seasonal precipitation and temperature outlooks favor drought persistence and development in Hawaii Islands. Drought persistence/development is anticipated across Puerto Rico and the U.S. Virgin Islands.
Looking out Four Seasons.
Twelve Temperature Maps. These are overlapping three-month maps (larger versions of these and other maps can be accessed HERE)
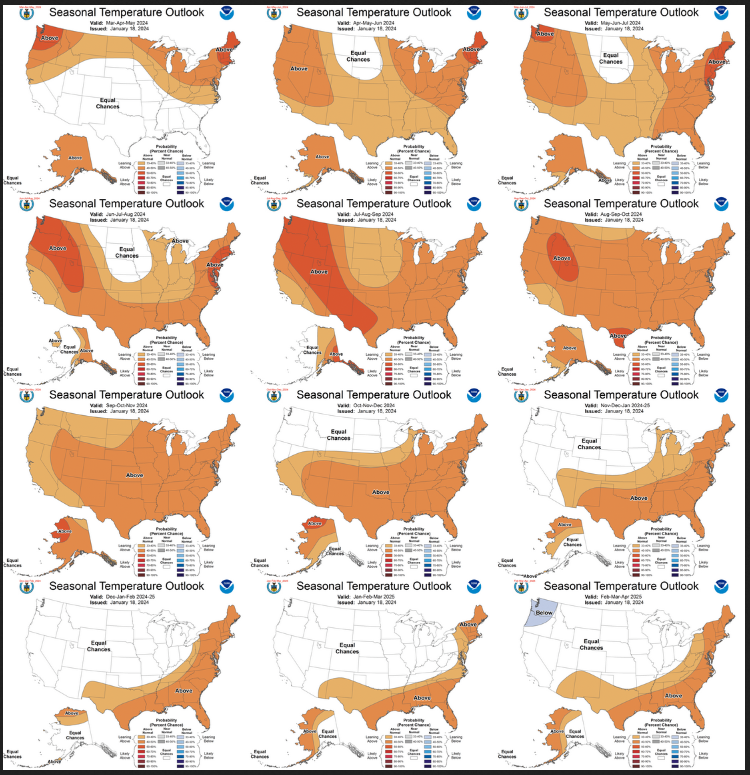
Notice that this presentation starts with March/April/May 2024 (MAM) since JFM is considered the near-term and is covered earlier in the presentation. The changes over time are generally discussed in the discussion but you can see the changes easier in the maps.
Comparing the new outlook with the prior Outlook,
The 12 temperature maps were issued last month.
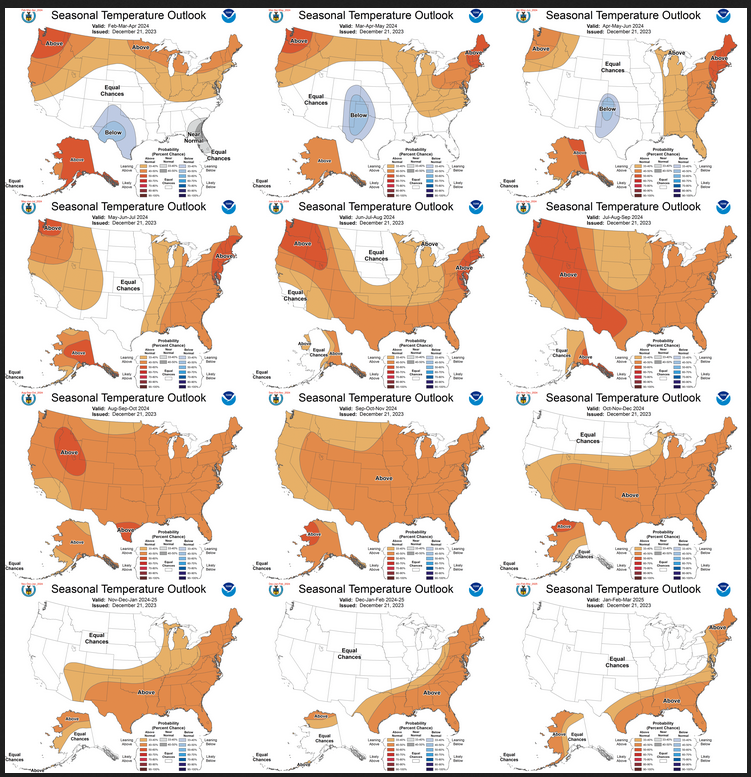
The easiest way to do the comparison is to print out both maps. If you have a color printer that is great but not needed. What I do is number the images from last month 1 – 12 starting with “1” and going left to right and then dropping down one row. Then for the new set of images, I number them 2 – 13. That is because one image from last month in the upper left is now discarded and a new image on the lower right is added. Once you get used to it, it is not difficult. In theory, the changes are discussed in the NOAA discussion but I usually find more changes. It is not necessarily important. I try to identify the changes but believe it would make this article overly long to enumerate them. The information is here for anyone who wishes to examine the changes. I comment below on some of the changes from the prior report by NOAA and important changes over time in the pattern.
| Changes for FMA 2024 are mentioned in the NOAA discussion. AMJ and MJJ 2024 are warmer than shown last month. Overall it is a somewhat warmer outlook for Spring. |
Now the Twelve New Precipitation Maps
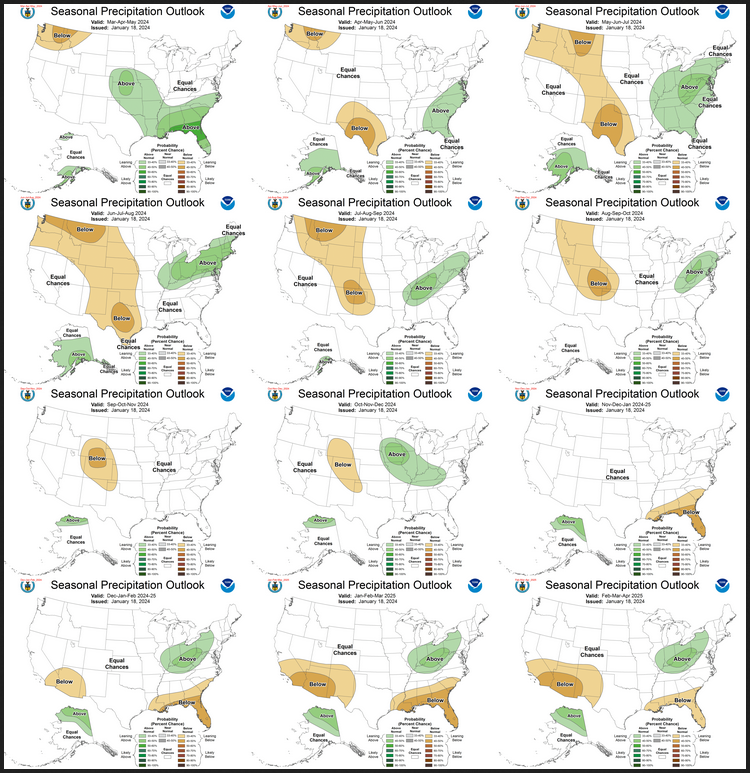
Similar to Temperature in terms of the organization of the twelve overlapping three-month outlooks.
Comparing the new outlook with the prior Outlook,
The maps that were released last month.
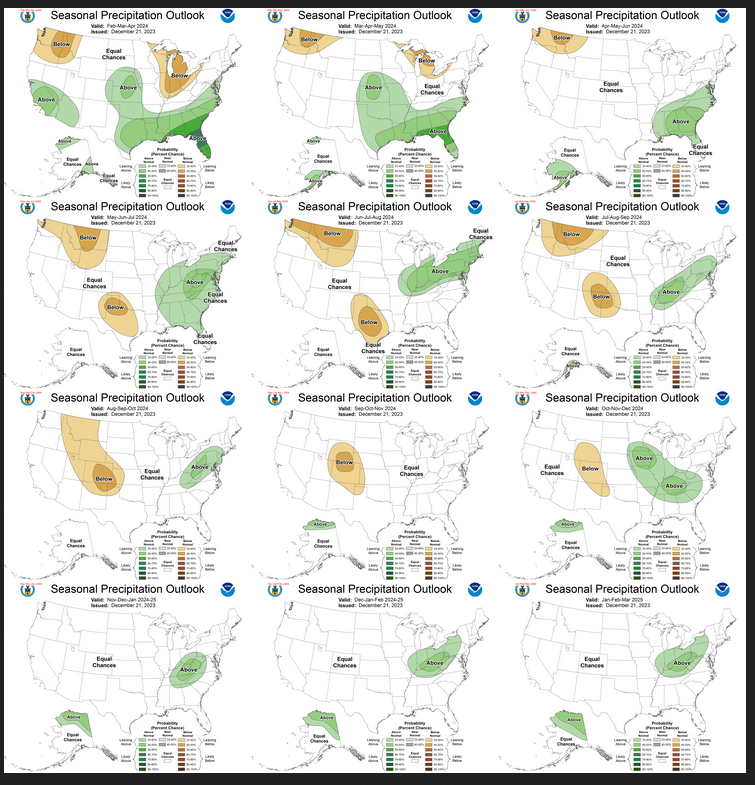
A good approach for doing this comparison is provided with the temperature discussion.
| Changes for FMA 2024 are mentioned in the NOAA discussion. MJJ and JJA are dry over more area. Overall it is a drier outlook than last month for summer and next winter. |
NOAA Discussion
Maps tell a story but to really understand what is going you need to read the discussion. I combine the 30-day discussion with the long-term discussion and rearrange it a bit and add a few additional titles (where they are not all caps the titles are my additions). Readers may also wish to take a look at the article we published last week on the NOAA ENSO forecast. That can be accessed here.
I will use bold type to highlight some especially important things. All section headings are in bold type; my comments, if any, are enclosed in brackets [ ].
CURRENT ATMOSPHERIC AND OCEANIC CONDITIONS
Above-average SSTs persist across the equatorial central and eastern Pacific. Weekly observed SST anomalies in the Niño 3.4 region are at +1.9 degrees Celsius. Subsurface temperature anomalies (averaged from 180-100W and 0-300 meters) are at +1.0 degrees Celsius which is a decrease from a peak of +1.5 degrees Celsius in late November. This slight decrease is due to an expansion of negative subsurface temperature anomalies eastward to 150W, but these negative anomalies remain at a depth of 100 meters. From December 16, 2023 to January 10, 2024, positive OLR anomalies (suppressed convection and precipitation) continue over the Philippines, Indonesia, and northern Australia. Negative OLR anomalies (enhanced convection and precipitation) were observed around the Date Line and extend through the eastern tropical Pacific, mostly to the north of the equator. Low-level (850-hPa) wind anomalies were westerly over the east-central equatorial Pacific and easterly across the far western Pacific. Upper-level (200-hPa) wind anomalies were easterly over the eastern equatorial Pacific. These atmospheric and oceanic conditions reflect a continuation of El Niño. The Madden-Julian Oscillation (MJO) remains active and was strong enough to rapidly weaken the positive phase of the Indian Ocean dipole and also enhance the convection across the western Maritime Continent during early January. The GEFS and ECMWF models are in excellent agreement that the MJO propagates eastward to the West Pacific during late January. By the end of the month and heading into February, the MJO is likely to constructively interfere with El Niño.
PROGNOSTIC DISCUSSION OF SST FORECASTS
The CPC SST consolidation forecast for Niño 3.4 depicts decreasing positive anomalies by the spring, and it is typical for El Niño to peak in strength during the winter. Dynamical and statistical models are in good agreement that a transition to ENSO-neutral conditions occurs either in the spring or by the early summer. The CPC ENSO outlook indicates a likely transition to ENSO-neutral during April-May-June with increasing chances of La Niña from the summer into the fall. By August-September-October, there is more than a 60 percent chance of La Niña.
30-DAY OUTLOOK DISCUSSION FOR FEBRUARY 2024
The February 2024 monthly temperature and precipitation outlooks are made with strong current El Niño climate conditions. The most recent weekly and seasonal Niño 3.4 sea surface temperature (SST) anomalies are both at +1.9 degrees Celsius. SST anomalies over the central and east-central equatorial Pacific Ocean have remained steady over the last month, while positive SST anomalies over the far eastern equatorial Pacific have weakened slightly. In recent weeks, lower level wind anomalies at 850 hPa were westerly over the east-central equatorial Pacific Ocean, while upper level wind anomalies at 200 hPa were easterly over the east-central and eastern equatorial Pacific Ocean. Negative outgoing longwave radiation (OLR) anomalies are present near the Date Line and north of the equator over the eastern Pacific Ocean, indicating anomalously enhanced convection. These ocean and atmosphere conditions indicate that the ongoing strong El Niño is well coupled to the atmosphere [Author’s Note: The SOI Index contradicts that statement]. El Niño remains a primary driver of temperature and precipitation patterns over North America in the near future and in the February temperature and precipitation outlooks. On subseasonal timescales, the Madden Julian Oscillation (MJO) is active in phase 4 with enhanced convection over the Maritime Continent, with dynamical model forecasts indicating that the MJO will propagate eastward into the western Pacific in the next couple weeks. Lagged composites indicate that this active MJO would increase temperatures over the eastern United States in the next couple weeks, before returning to potentially cooler temperatures, especially over the Northeast, in early February. Impacts of the MJO were generally only considered in the February monthly outlook through dynamical model forecasts for the week 3-4 period that overlap with the first half of February.
The February temperature and precipitation outlooks were based primarily on a skill-weighted consolidation of dynamical model forecasts and a combined consolidation of the statistical and dynamical model forecasts. Dynamical model forecasts for the month of February are from the North America Multimodel Ensemble (NMME). In addition, the full consolidation includes a consolidation of the statistical models: the Canonical Correlation Analysis (CCA), the Constructed Analog (CA), and an ENSO OCN tool, that combines the impact of ENSO, based on the CPC SST consolidation predicted median Niño 3.4 SST anomaly, with the Optimum Climate Normal (OCN) representing decadal trends . Daily initialized forecasts from the NCEP CFSv2 dynamical model, the most recent ECMWF and GEFS dynamical model forecasts for the week 3-4 period that overlaps the beginning of the month of February, and a statistical multivariate linear regression (MLR) forecast for the first half of February using the current Niño 3.4 and MJO indices as predictors, were also considered. Recent boundary conditions, including coastal SSTs, snow cover anomalies, and soil moisture anomalies, were additional factors considered.
Temperature
The February temperature outlook favors above normal temperatures over all of Alaska, consistent with dynamical model guidance and the monthly temperature consolidation. Above normal temperatures are more likely for the south coast of Mainland Alaska and Southeast Alaska, consistent with canonical El Niño impacts. Above normal temperatures are favored across the northern tier of the contiguous U.S. (CONUS), supported by the consolidation of statistical and dynamical forecast tools. Probabilities for above normal temperatures exceed 50 percent over the Pacific Northwest, due to strong signals in the NMME consolidation. Equal chances (EC) of below, near and above normal temperatures are indicated in the February outlook across much of the southern tier of the CONUS, due to conflicting signals from El Niño impacts and dynamical models. The outlook indicates enhanced probabilities of near-normal temperatures for parts of southeastern New Mexico, most of southern Texas, and for parts of the Southeast, consistent with the consolidation forecast and NMME probabilities. For the Southeast, decadal temperature trends are positive, while negative temperature anomalies are correlated with El Niño conditions.
Precipitation
The February precipitation outlook favors above normal precipitation for much of the south coast of Mainland Alaska and the northern Alaska Panhandle, supported primarily by dynamical model forecasts from the NMME and correlation of seasonal precipitation to Niño 3.4 SST anomalies. Above normal precipitation is favored from Central and Southern California northeastward into parts of Nevada, Utah and Arizona, consistent with canonical El Niño impacts, dynamical model forecasts from CFSv2 for February, and dynamical model forecasts from the ECMWF and GEFS models for the first half of February. Negative decadal precipitation trends damp probabilities for above normal precipitation over this region. Above normal precipitation is also favored along the Gulf Coast and likely for parts of the Southeast, including the Florida Peninsula, where correlations of precipitation and the Niño 3.4 SST index are greatest. Below normal precipitation is favored from the Central Mississippi Valley, across the Ohio Valley, the eastern Great Lakes region, and over northern areas of New England, consistent with the CFSv2 model forecasts for February, and ECMWF and GEFS model forecasts for the first half of February.
SUMMARY OF THE OUTLOOK FOR NON-TECHNICAL USERS (Focus on February – April)
El Niño conditions continue with equatorial sea surface temperatures (SSTs) above average across the central and eastern equatorial Pacific Ocean. The atmospheric response across the global tropics is consistent with the ongoing El Niño. El Niño is forecast to persist through March-April-May with a transition to ENSO-neutral conditions later in the spring and summer.
Temperature
The February-March-April (FMA) 2024 temperature outlook favors above-normal temperatures across the Pacific Northwest, northern to central California, parts of the Great Basin, northern Rockies, northern Great Plains, Great Lakes, and Northeast. The highest forecast confidence for above-normal temperatures exists for the Pacific Northwest and much of Alaska. Below-normal temperature probabilities are slightly elevated across southeastern New Mexico and western to central Texas. Near-normal temperatures are favored for much of the Southeast.
Precipitation
The FMA 2024 precipitation outlook depicts elevated probabilities for above-normal precipitation for southern California, the desert Southwest, the central to southern Plains, the Southeast, and much of the East Coast [Author’s note: I checked and the map is correct: I read this to incude Arizona and New Mexico but it does not except for extreme western Arizona]. The Southeast is the most likely area to have above-normal precipitation. Above-normal precipitation is also favored for parts of southern Alaska and the North Slope of Alaska. Below-normal precipitation is favored for the Pacific Northwest and from the Great Lakes south to the Ohio Valley.
Areas depicted in white and labeled “Equal-Chances” or “EC” are regions where climate signals are weak, and so there are equal chances for either above-, near- or below-normal seasonal mean temperatures or total precipitation amounts.
PROGNOSTIC TOOLS USED FOR U.S. TEMPERATURE AND PRECIPITATION OUTLOOKS
The temperature and precipitation outlooks for FMA 2024 were based on dynamical model guidance such as the North American Multi-Model Ensemble (NMME), International Multi-Model Ensemble (IMME), and statistical tools such as the global SST-based Constructed Analog (CA) and ENSO-OCN. The objective, historical skill-weighted consolidation was a major tool used in the outlooks, and that includes the ENSO-OCN tool and a complete suite of statistical and dynamical tool combinations. El Niño composites were used primarily during FMA and to a lesser extent through MAM as the atmospheric response to El Niño is expected to diminish later in the spring. La Niña composites were considered beginning during the summer and using these composites, modifications were made to the late fall 2024 and winter 2024-2025 outlooks. Long-term climate trends were considered for all leads, but were relied upon most from the summer 2024 through FMA 2025.
PROGNOSTIC DISCUSSION OF OUTLOOKS – FMA 2024 TO FMA 2025
TEMPERATURE
Elevated probabilities of above-normal temperatures during FMA 2024 are forecast across the northern tier of the contiguous U.S. (CONUS) and Alaska which is supported by the calibrated NMME, consolidation tool, and El Niño composites. The largest probabilities (above 50 percent) for above-normal temperatures are forecast for much of Oregon, Washington, and northern Idaho where the teleconnection to El Niño has its strongest correlation. Above-normal temperature probabilities are limited to below 40 percent across the Northern Great Plains and parts of the Upper Midwest due to uncertainty on the Arctic Oscillation (AO) phase. A persistent -AO could promote a major Arctic air outbreak which could skew the seasonal mean temperature towards at least the middle tercile for these areas. In addition, the Madden-Julian Oscillation has remained active since November 2023. If the MJO remains active and results in subseasonal pattern changes, that would also lead to lower forecast confidence. Despite the increased uncertainty related to the AO and MJO, above-normal temperatures remain the most likely outcome across the north-central CONUS given the ongoing El Niño. Based on El Niño composites and the ENSO-OCN tool along with continuity from previous outlooks, below-normal temperature probabilities are elevated across southeastern New Mexico and western to central Texas. The expectation of a highly variable temperature pattern during FMA along with support from the consolidation tool leads to near-normal temperatures being favored for much of the Southeast. Equal chances (EC) for below, near, or above-normal temperatures are forecast for parts of the southern tier of the CONUS due to conflicting and/or weak signals among the statistical and dynamical tools. Long-term trends became the major factor in the temperature outlook during the summer. Given the increasing chance of La Niña by the late summer and fall, La Niña temperatures composites were also considered.
PRECIPITATION
The FMA precipitation outlook is consistent with El Niño composites and strongly favors above-normal precipitation across the Southeast with below-normal precipitation more likely from the Ohio Valley north to the Great Lakes. Based on good agreement among statistical and dynamical tools, the largest probabilities (more than 60 percent) for above-normal precipitation are forecast across north-central Florida. Slightly elevated above-normal precipitation probabilities extend north along the East Coast to southern New England and also westward to parts of the Great Plains, based on El Niño composites and the IMME. Dynamical models and statistical tools support increased below-normal precipitation probabilities across the Pacific Northwest and northern Intermountain West. Although the NMME trended drier from its December model run throughout the Southwest [Author’s note: I checked and the map is correct even though my understanding of the “Southwest” includes Arizona and New Mexico] and California, above-normal precipitation is favored for these areas due to support from the consolidation tool and El Niño composites. Based on the consolidation tool, NMME, and ENSO-OCN, increased above-normal precipitation probabilities are forecast for much of southern Alaska and the North Slope of Alaska.
The March-April-May precipitation outlook maintained continuity from the previous month with El Niño expected to have a lingering influence into at least the early spring. By April-May-June (AMJ), the NMME depicts an increasing dry signal across the southern Great Plains and the AMJ outlook followed this model guidance. Minor adjustments were made to subsequent three-month periods through the summer, consistent with the updated NMME, consolidation, and long-term trends . Given the increasing chance of La Niña by the late summer and fall, later outlooks were tilted towards La Niña precipitation composites.
The key piece of information used by NOAA follows.
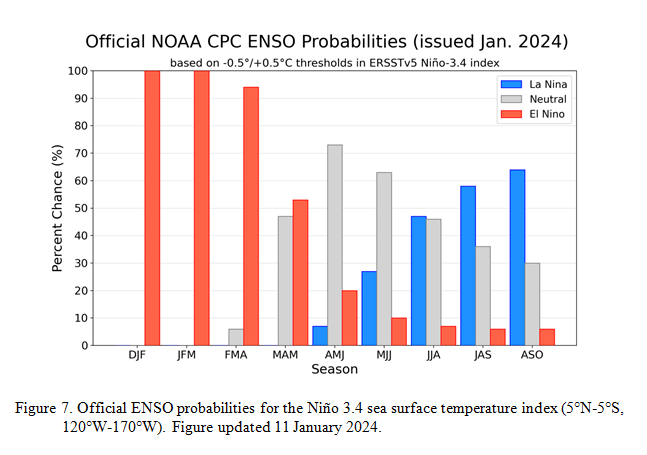
| It looks like El Nino early in the forecast period. It does start to begin to reduce the intensity in FMA2024. There is increasing confidence that this El Nino will weaken in the Spring into the summer which is shown here as the probabilities of El Nino rapidly converge with the probabilities of ENSO Neutral and then La Nina in the later part of the forecast period. The above graphic does not extend into the future as far as the outlooks presented in this article. That can be confusing. |
Resources
–
| I hope you found this article interesting and useful. |
–