Updated at 1:20 a.m. January 7, 2024 to do some light editing and add the discussion of price parity.
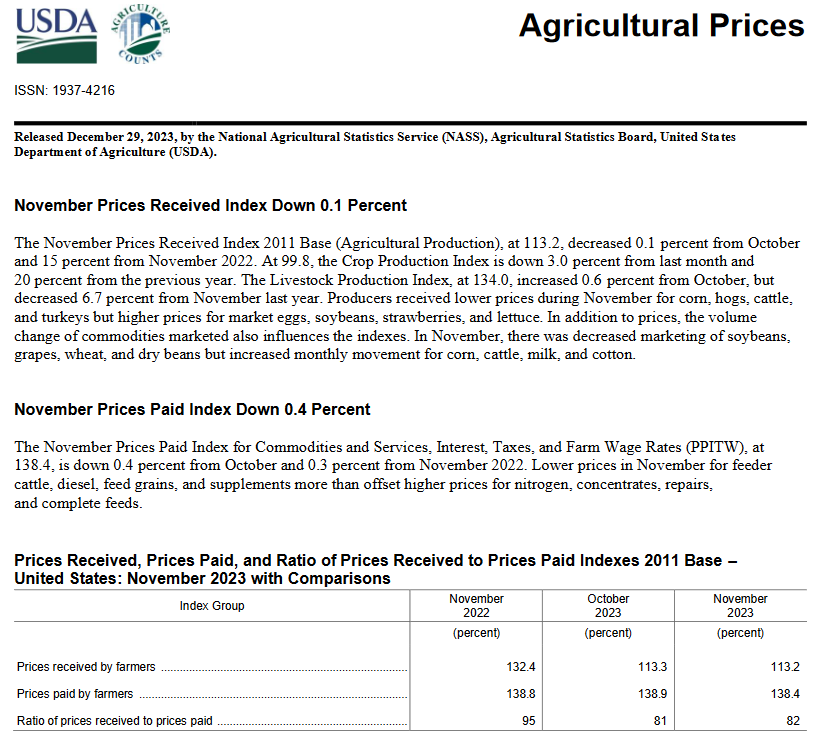
| In theory, if the prices received decline by 15% and your prices paid decline by 0.3% you should be in trouble. Let’s take a closer look. Some readers will have to click on “Read More to access the full article. I have included most of the report but the full report can be accessed HERE. In most cases, we are looking at Nov 2023 as compared to either the prior month i.e. October 2023 or the same month last year which would be November 2022. So in many cases, it is a November to November comparison but if you look closely it is pretty much a comparison of 2023 to 2022. The section I left out is called Price Parity. I left it out mostly because I do not understand it. I think it is less important now than in the past but you be the judge by reading HERE. |

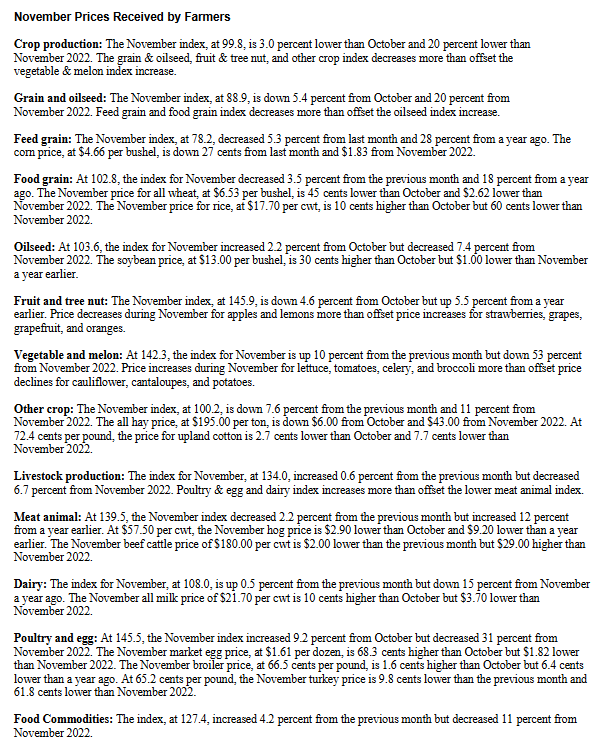
| The above is the summary. Meat is up from last year. Everything else is down a lot. |
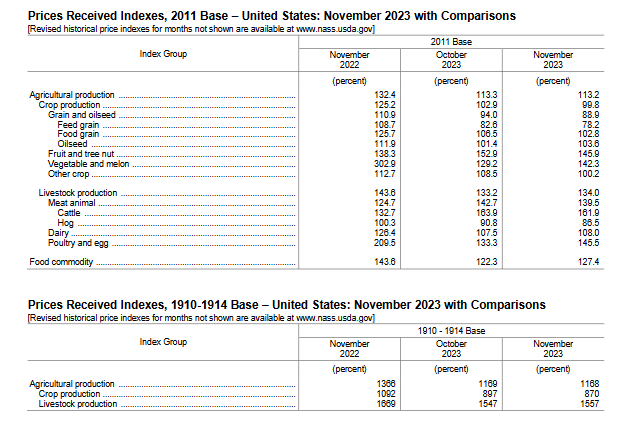
| Various ways to summarize. |
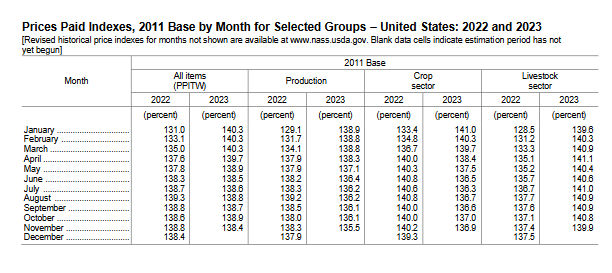
| By Month |
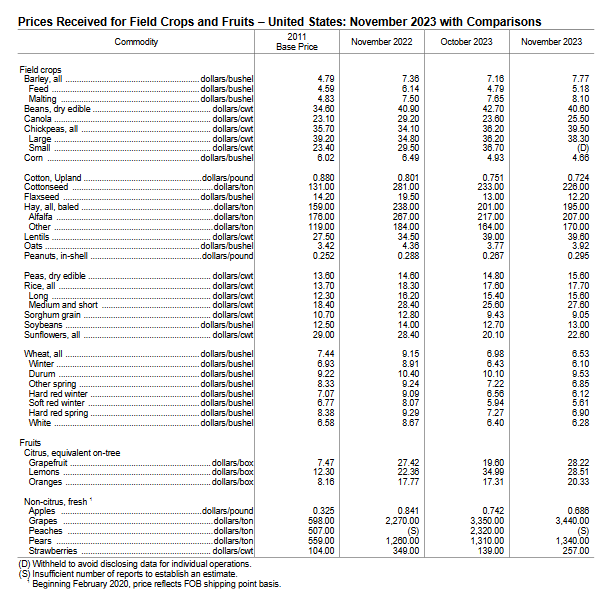
| Field crops. |
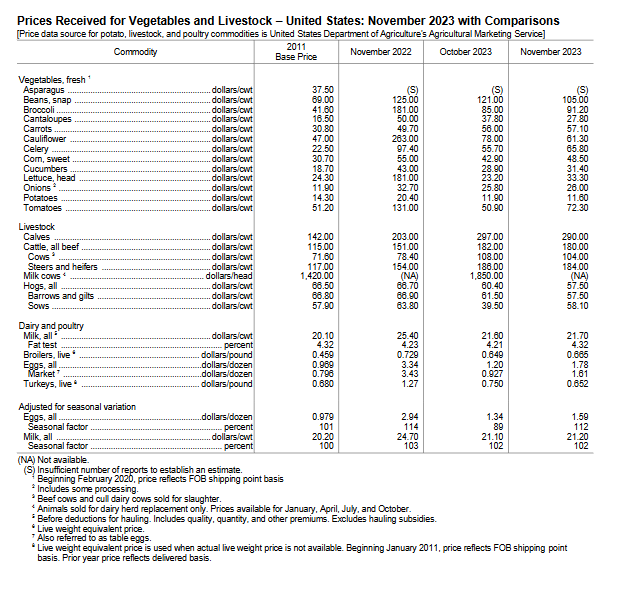
| Vegetables and livestock. |
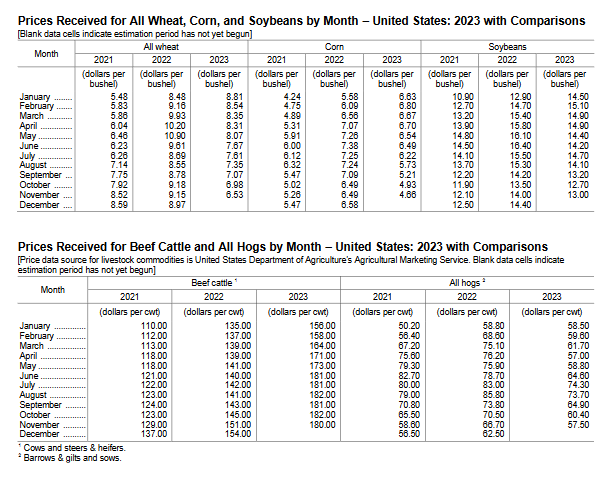
| Monthly data. But December 2023 is not available yet. |
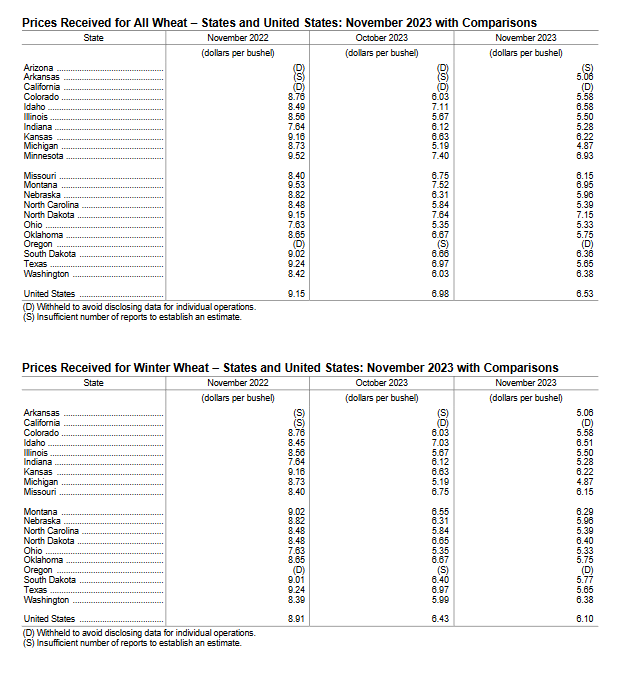
| Wheat |
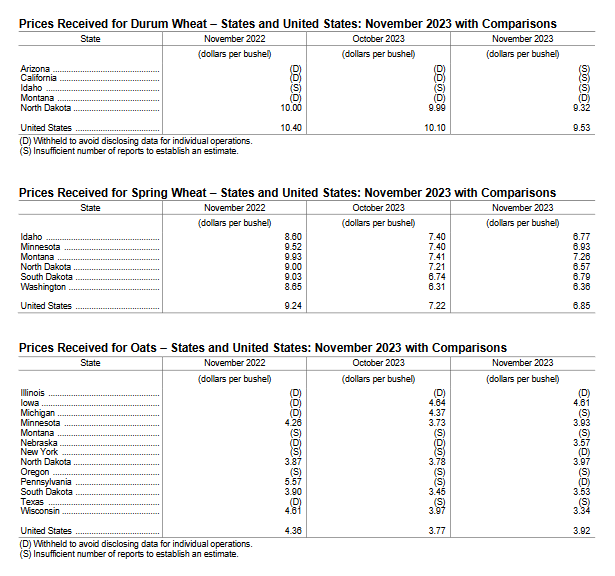
| More wheat and oats |
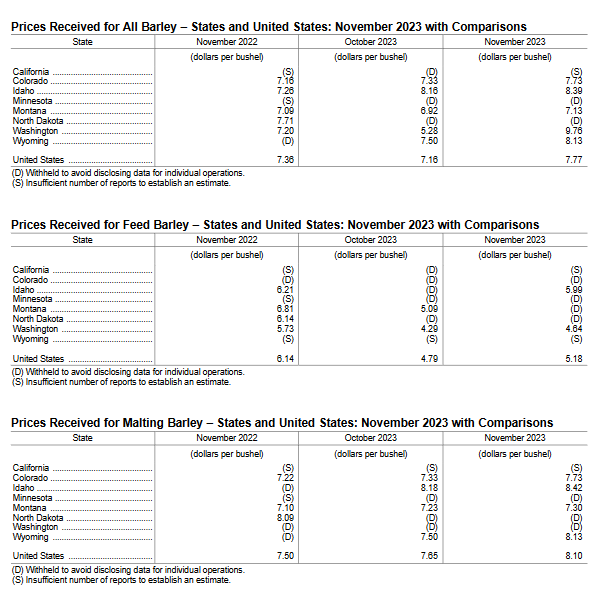
| Barley |
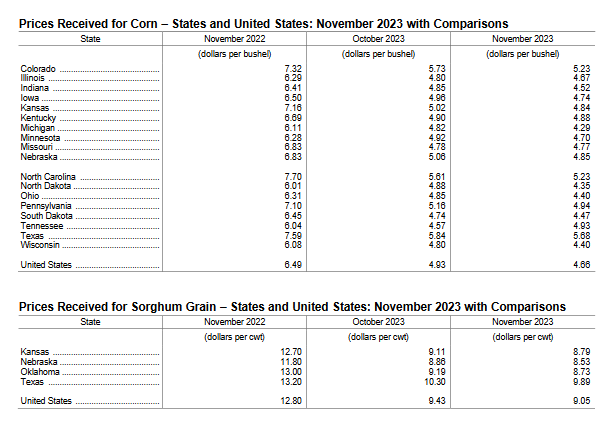
| Corn. |
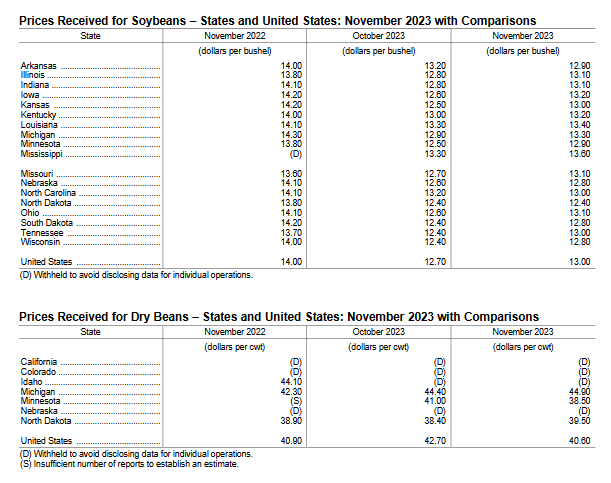
| Soybeans |
–
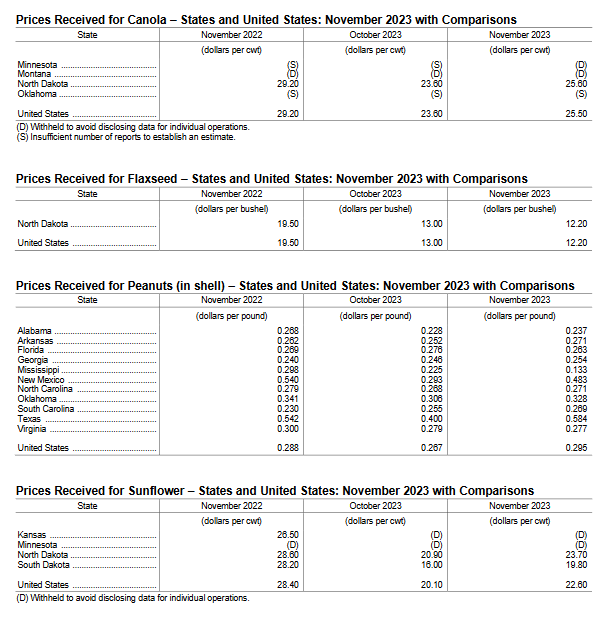
| By state |
–
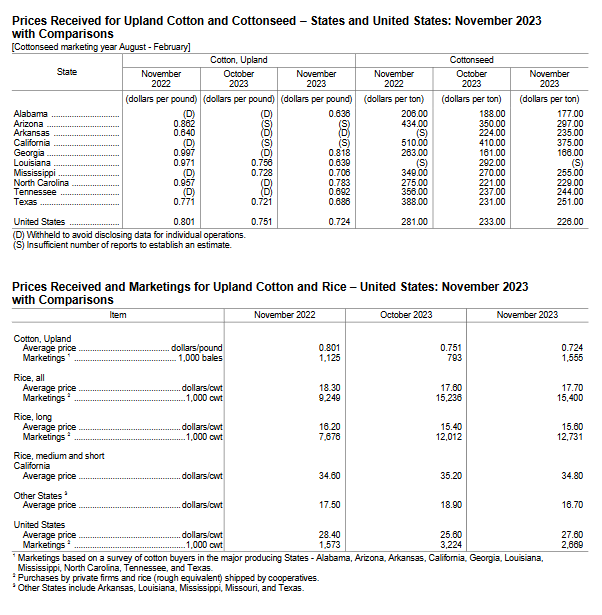
| Information by state for cotton and information for rice. |
–
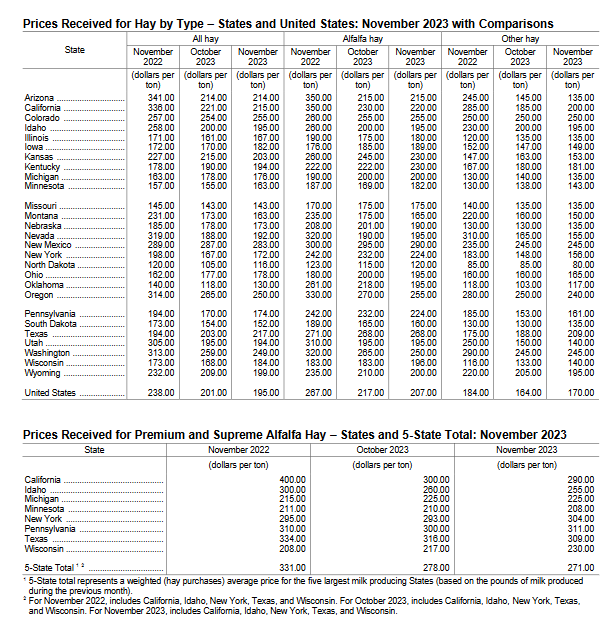
| By state |
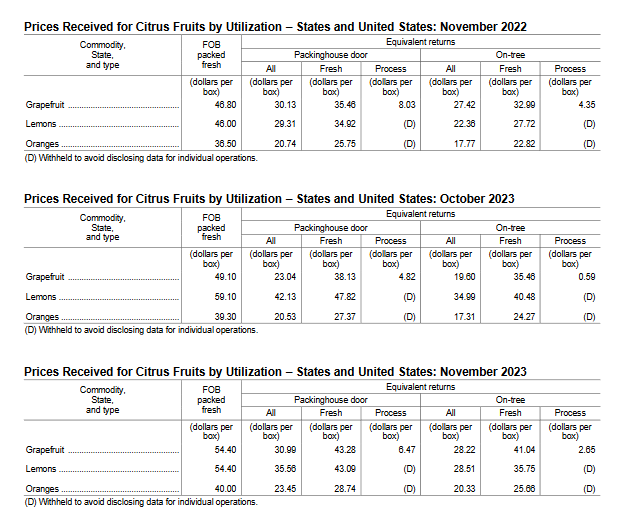
| Citrus |
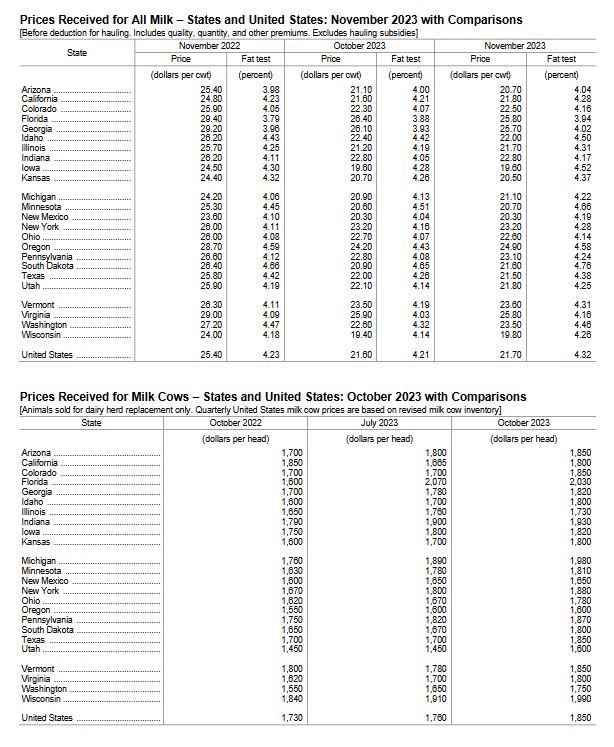
| Milk and Milk Cows |
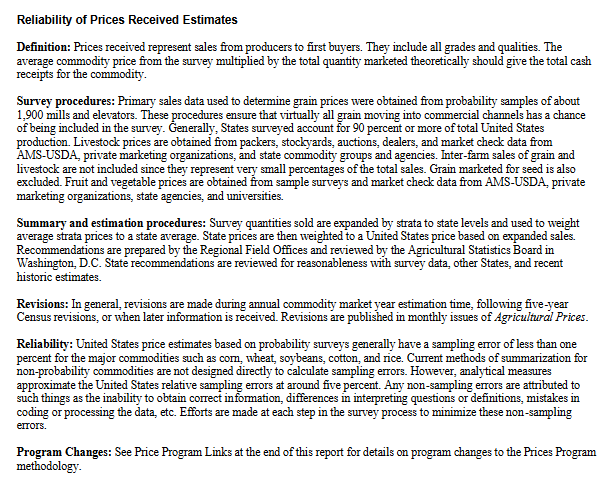
| reliability of price estimates |
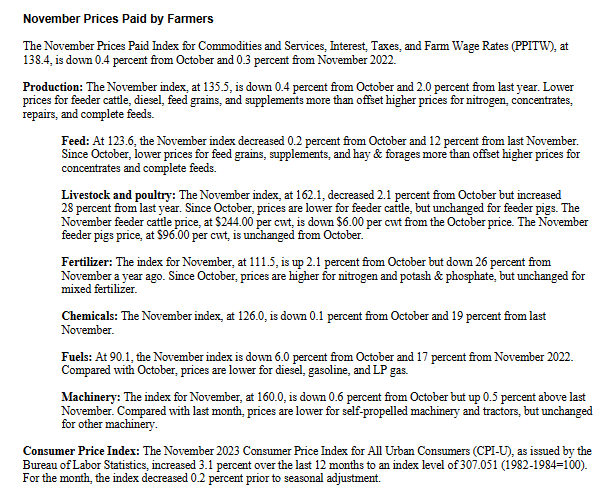
| Now we look at prices paid by farmers for things they bought. |
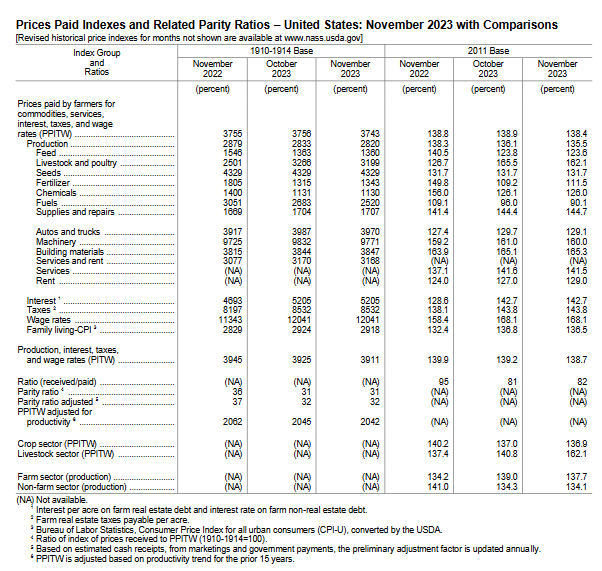
| More prices paid |
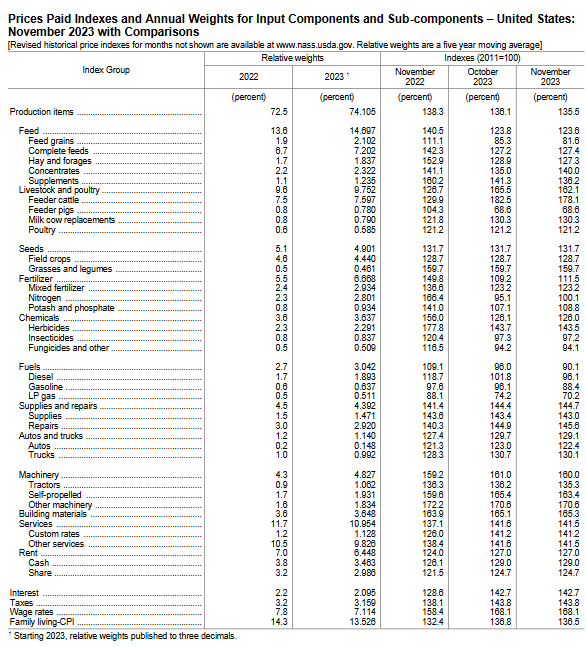
| More prices paid |
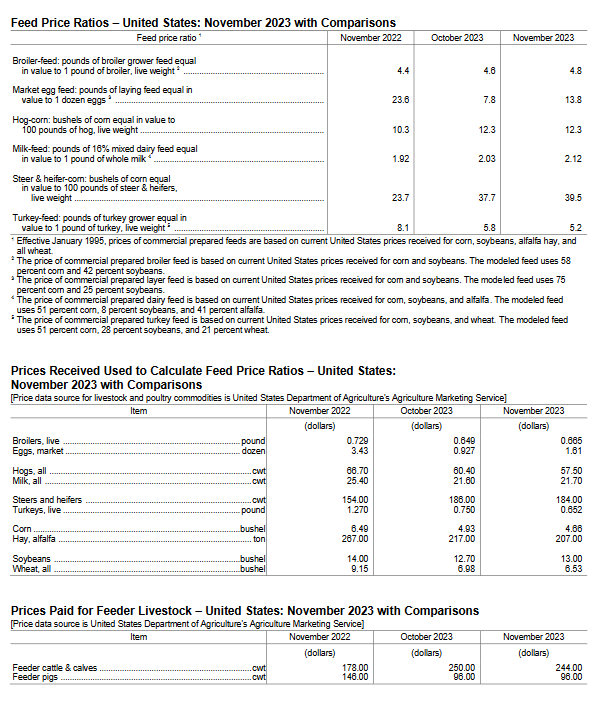
| Now the data is shown as ratios |
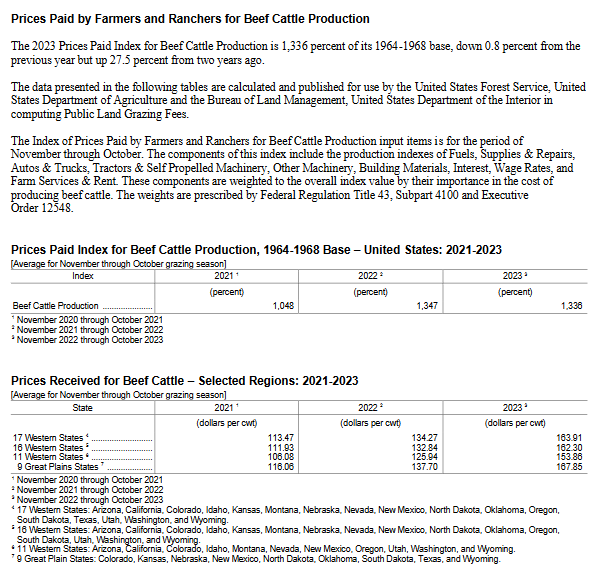
| Cattle |

| Food price ratios |

| Feed price ratios |
–
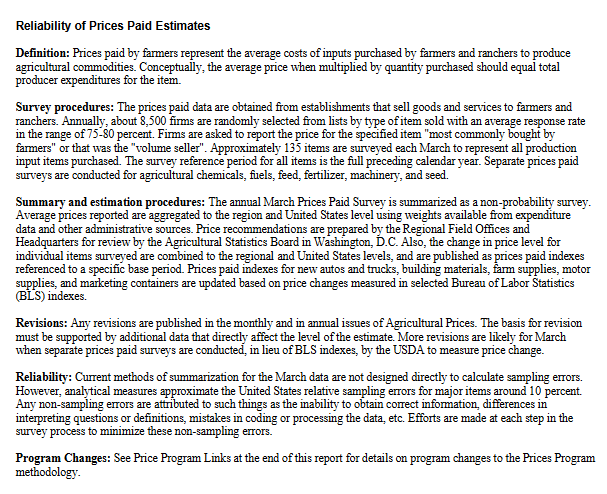
| Reliability of prices paid estimates |
–
| contact information |
–
| I hope you found this article interesting and useful. |
–