The full data sets for the 71 years from 1952 to 2022 show no discernable association patterns (correlations) for Mortgage Debt growth and inflation changes.1 Thus, we started an analysis by looking specifically at the various regimes of inflation change during the 71-year timeline. The most recent post2 analyzed the eight time periods over 71 years with positive inflation surges. This article analyzes the five periods between 1952 and 2019 with negative inflation (disinflation/deflation) surges.

From an image by Harry Strauss from Pixabay.
Introduction
The 71 years from 1952 to 2022 are divided into three types of inflationary behavior:1
- Significant inflation increases;
- Significant inflation decreases;
- No significant inflation changes.
An inflation change is significant if it is ≥4.0% with no intervening countertrend change >1.5%.
Previously, we defined the partitioning of inflation into the pattern in Table 1.
Table 1. Timeline of Inflation Data 1952-2022 (Posted previously1)
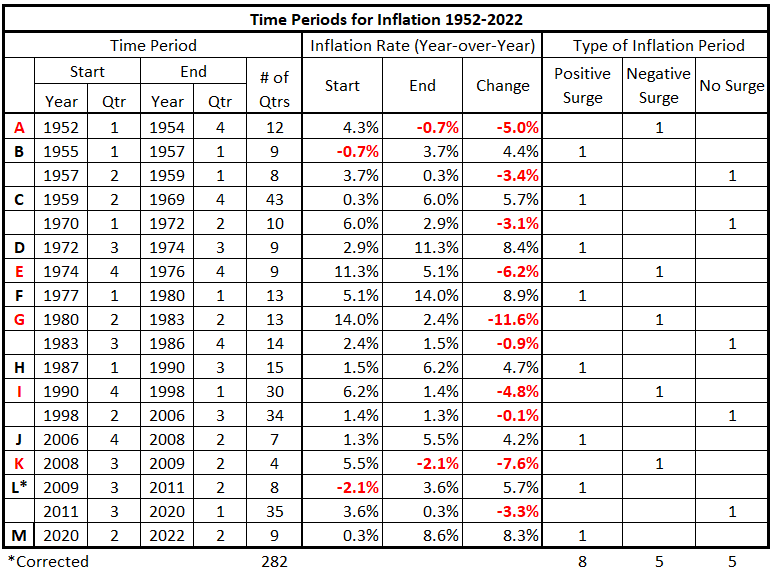
We will examine each category of inflation behavior separately. In this piece, we analyze the significantly negative periods of inflation (negative inflation surges).
Data
The data is from Tables 5-17, prepared previously.1
There are 13 quarterly timeline alignments:
- Mortgage Debt and CPI Inflation quarters are coincident.
- Mortgage Debt leads and lags CPI Inflation by one quarter (±3 months)
- Mortgage Debt leads and lags CPI Inflation by two quarters (±6 months)
- Mortgage Debt leads and lags CPI Inflation by three quarters (±9 months)
- Mortgage Debt leads and lags CPI Inflation by four quarters (±12 months)
- Mortgage Debt leads and lags CPI Inflation by six quarters (±18 months)
- Mortgage Debt leads and lags CPI Inflation by eight quarters (±24 months)
Analysis
1Q 1952 – 4Q 1954
Figure 1. U.S. Mortgage Debt and Inflation 1Q 1952 – 4Q 1954
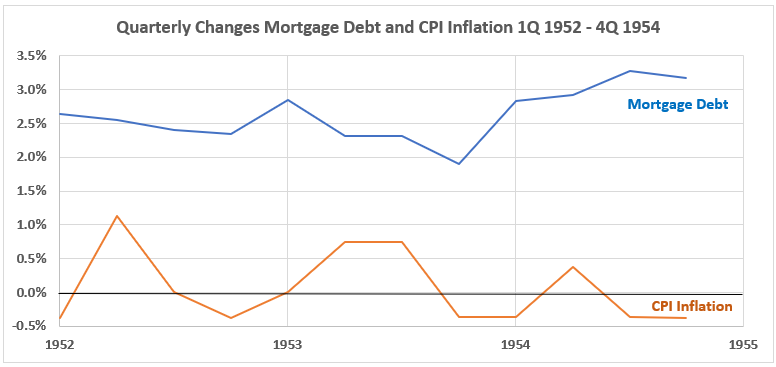
Figure 1. shows much larger quarterly changes for Mortgage Debt than for CPI Inflation.
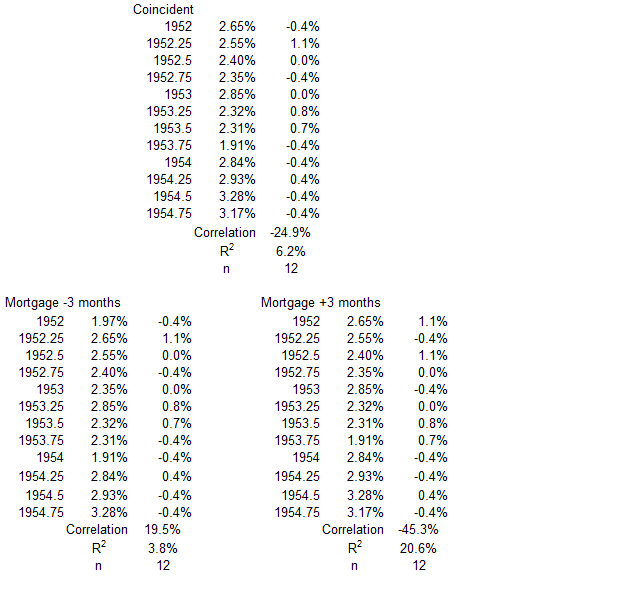
Figure 2. Quarterly Changes in Mortgage Debt (x) vs. CPI Inflation (y) 1Q 1952 – 4Q 1954
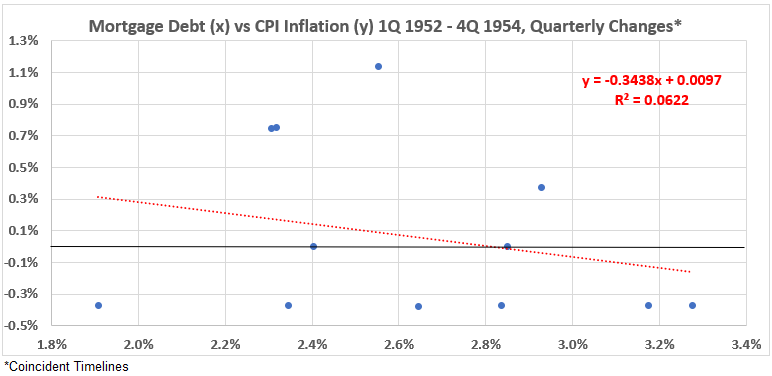
The association between the two variables is small and negative. R = -25% and R2 = 6.2%.
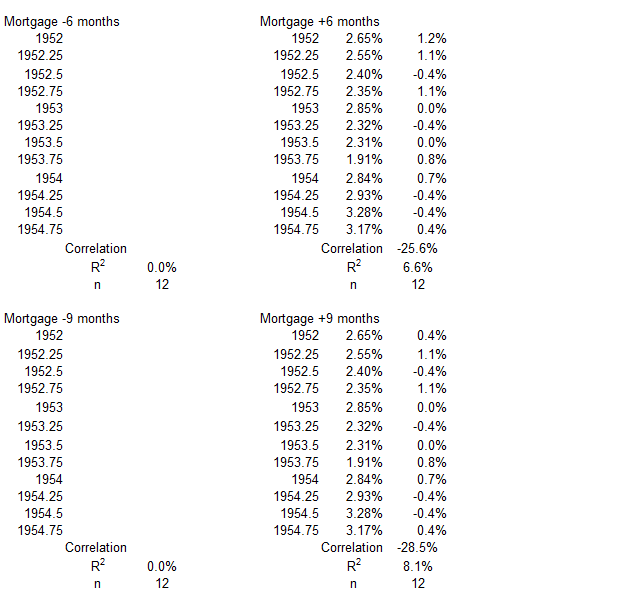
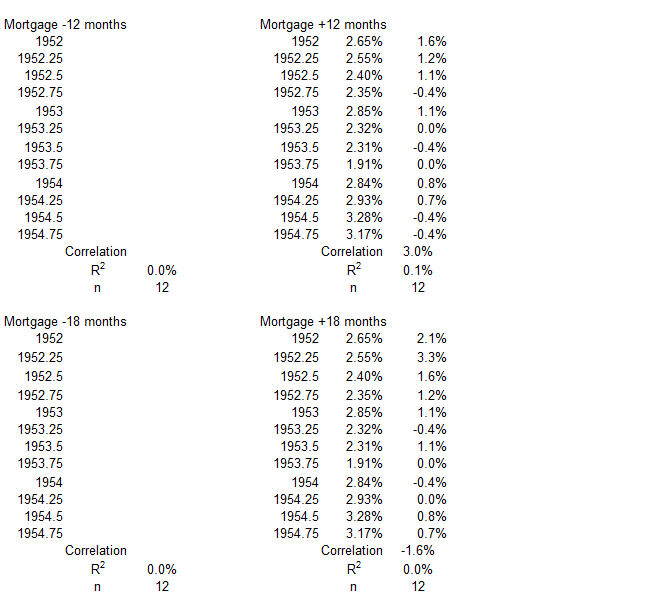
Figure 3. Correlation Between Mortgage Debt and CPI Inflation 1Q 1952 – 4Q 1954
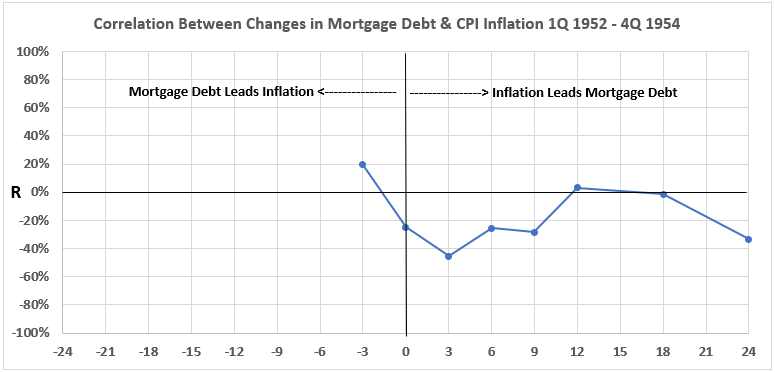
There is no data for mortgage debt before 4Q 1951 in this dataset, so the left-hand side of the graph for Mortgage Debt occurring before CPI inflation is blank except for the -3 month data point (Mortgage Debt correlation with CPI Inflation three months later). The only positive association between the two variables occurs for Mortgage Debt quarterly change three months before CPI Inflation quarterly change. All the associations for CPI Inflation quarterly changes before Mortgage Debt changes are negligible or negative all the way out to inflation change coming before mortgage debt by 24 months.
4Q 1974 -4Q 1976
Figure 4. U.S. Mortgage Debt and Inflation 4Q 1974 – 4Q 1976
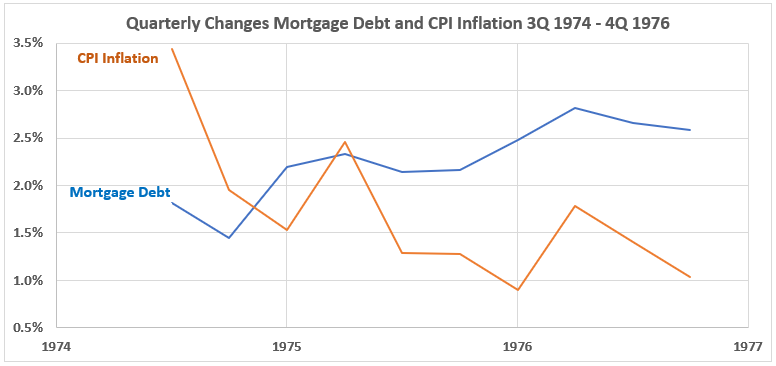
In Figure 4, we see the size of quarterly changes in mortgage debt increasing through the time period while decreasing for CPI inflation. This is in contrast to what was seen in Figure 1.
Figure 5. Quarterly Changes in Mortgage Debt (x) vs. CPI Inflation (y) 4Q 1974 – 4Q 1976
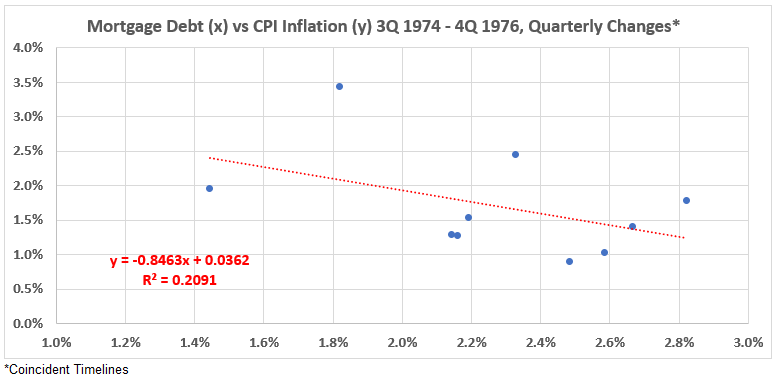
The overall association between these two variables is near the top of the weak range and negative. R = –46% and R2 = 21%.
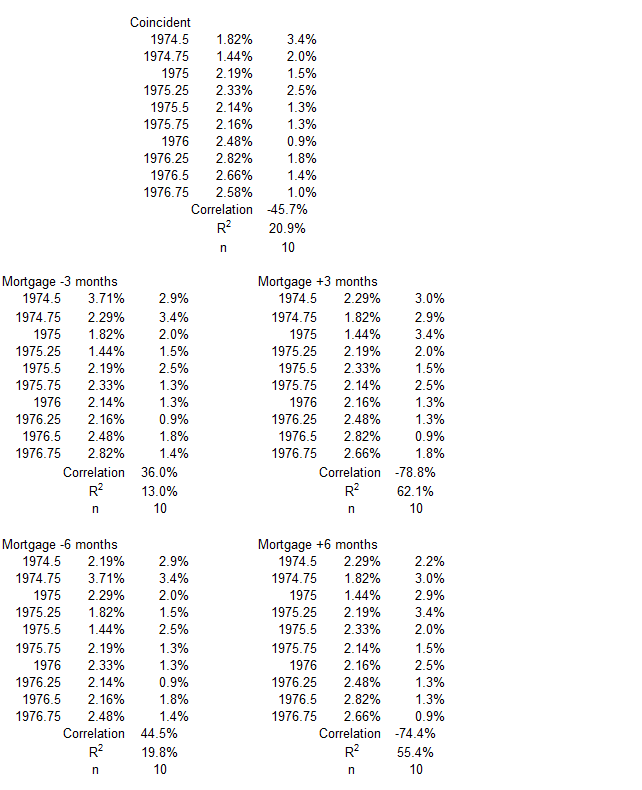
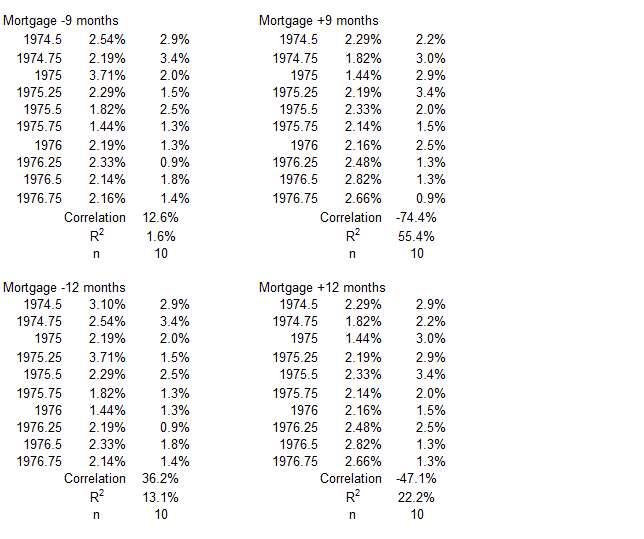
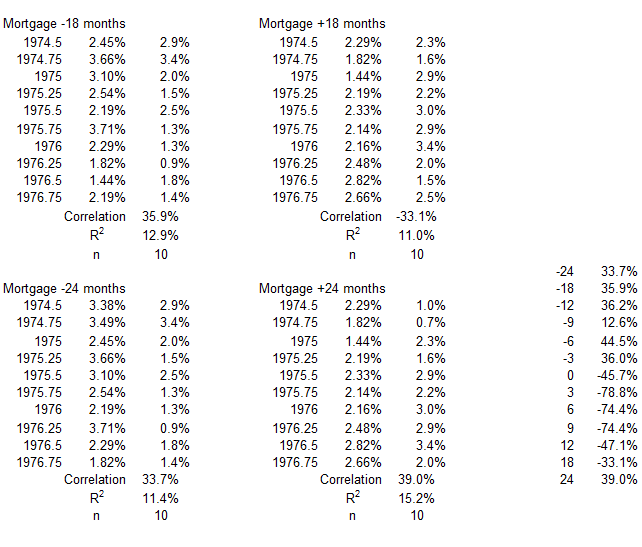
Figure 6. Correlation Between Mortgage Debt and CPI Inflation 4Q 1974 – 4Q 1976
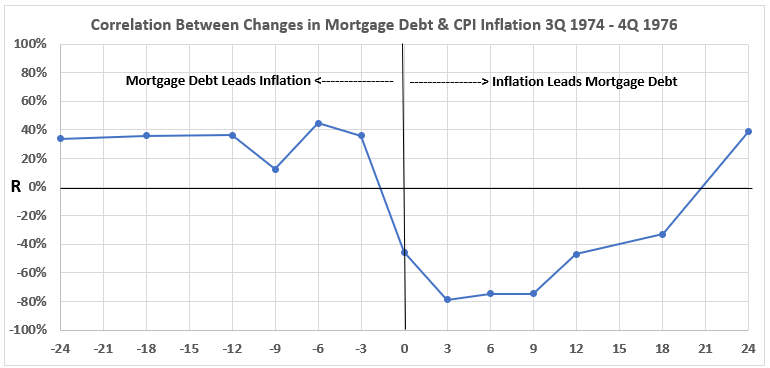
Figure 6 has a clear message. The positive association of Mortgage Debt with CPI Inflation is weak but consistent when the debt changes come before inflation. On the other hand, the association is negative but moderate and strong when inflation comes before debt spending, from coincident timelines out to 12-month offsets. The association is weakly negative at 18 months and weakly positive at 24 months.
Let’s restate the observations, with an emphasis on the fact that inflation is declining significantly during this time period.
From the lefthand side of Figure 6, this data indicates that decreasing Mortgage Debt spending is positively (but weakly) associated with declining inflation from 3 to 24 months in the future. The inference is that if there is cause-and-effect, it is consistent across time, but small. Except for the -9 month data point, the maximum amount of inflation change possibly caused by changes in mortgage debt is in the range of 15% to 17% (R2 values). Of course, as always, the minimum possible cause is zero.
From the right-hand side of Figure 6, we see a consistent moderate to strong negative association between the variables. This implies that either:
- There is no association between falling inflation and reduced use of mortgage debt; or
- It is possible that falling inflation could cause increased use of mortgage debt.
2Q 1980 – 2Q 1983
Figure 7. U.S. Mortgage Debt and Inflation 2Q 1980 – 2Q 1983
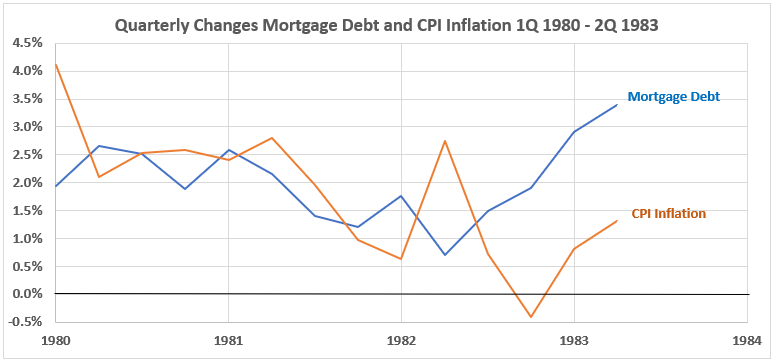
The general observation for Figure 7 is that the two variables show a positive correlation from the second quarter of 1980 to the fourth quarter of 1981. Then, from Q4 1981 to Q4 1982, the correlations are negative. The final two quarters in Figure 7 again show positive correlations.
Figure 8. Quarterly Changes in Mortgage Debt (x) vs. CPI Inflation (y) 2Q 1980 – 2Q 1983
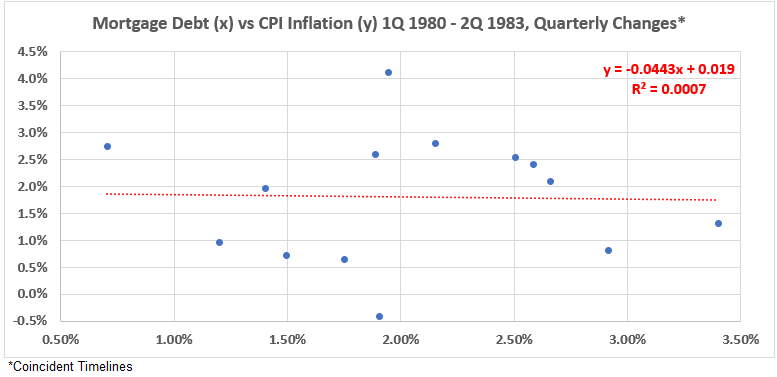
Figure 8 confirms our cursory observation about alternating trends in the discussion above (Figure 7). However, the negative association is negligible: R = –2.7% and R2 = 0.07%.
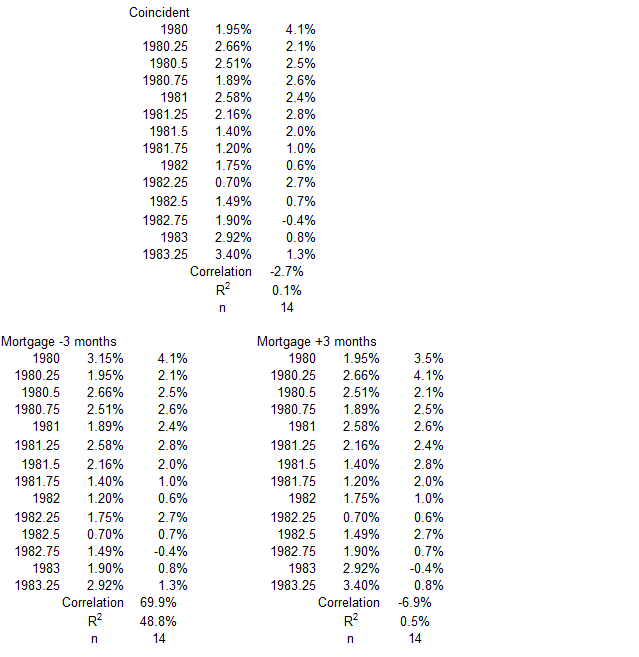
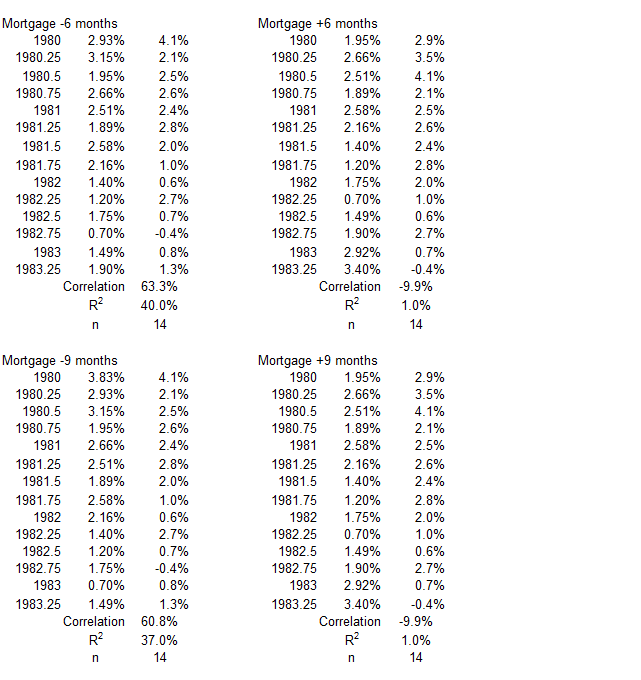
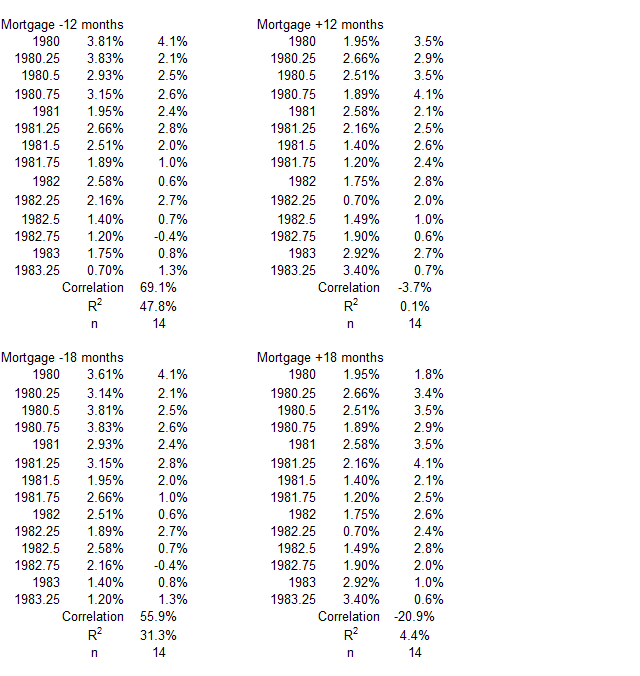
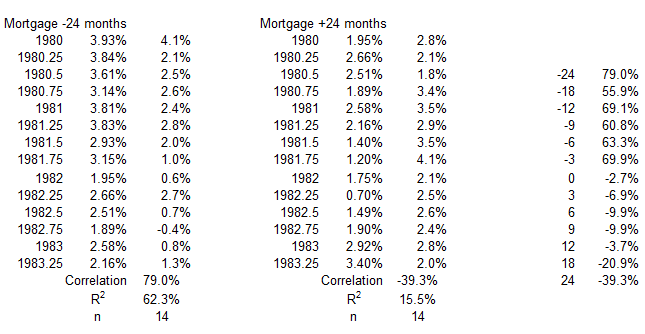
Figure 9. Correlation Between Mortgage Debt and CPI Inflation 2Q 1980 – 2Q 1983
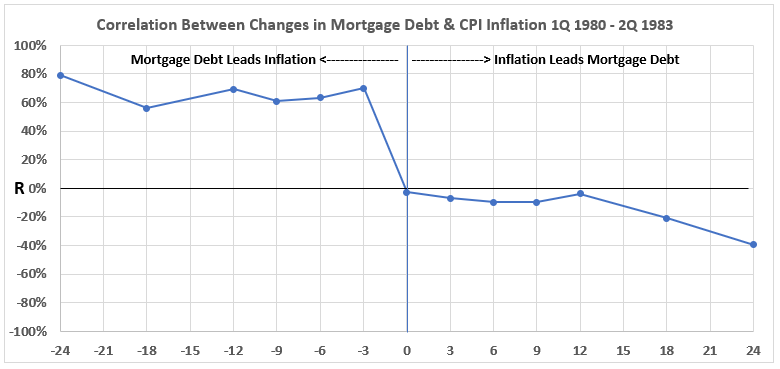
Figure 9 displays a tale of two associations. On the left, we have moderate and strong positive associations between Mortgage Debt quarterly changes and CPI Inflation changes from three to 24 months later. On the right, the associations are all negative but negligible until the lag from inflation change to debt change is 18 and 24 months. If there was any cause-and-effect for inflation changes leading to mortgage debt changes in this period, they were tiny and long-delayed.
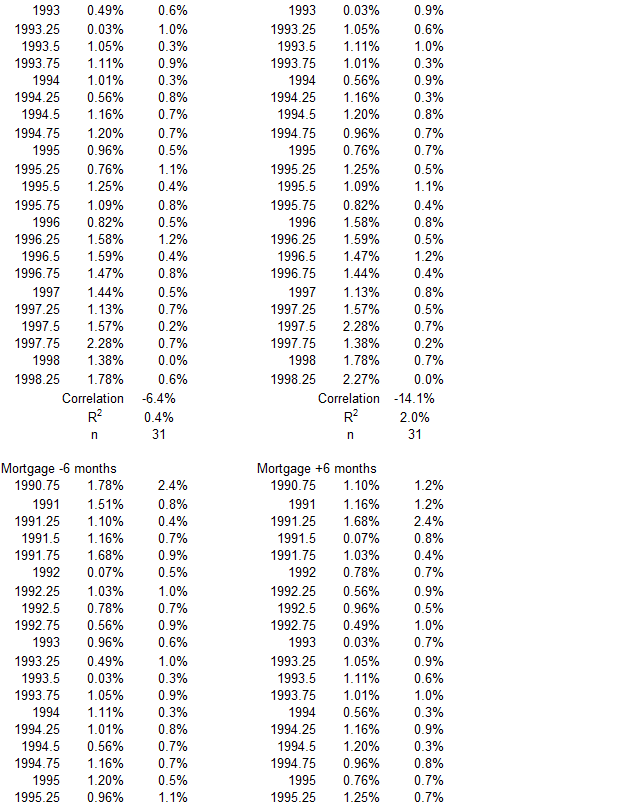
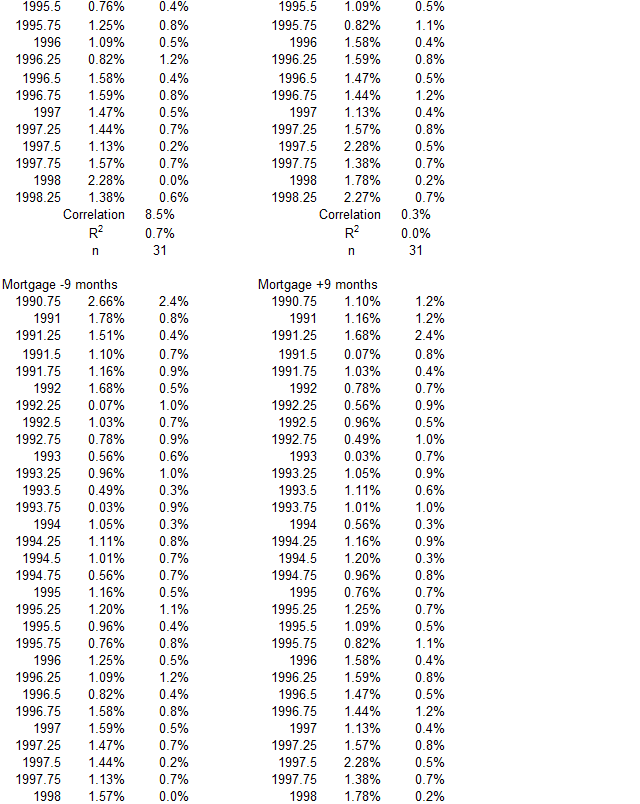
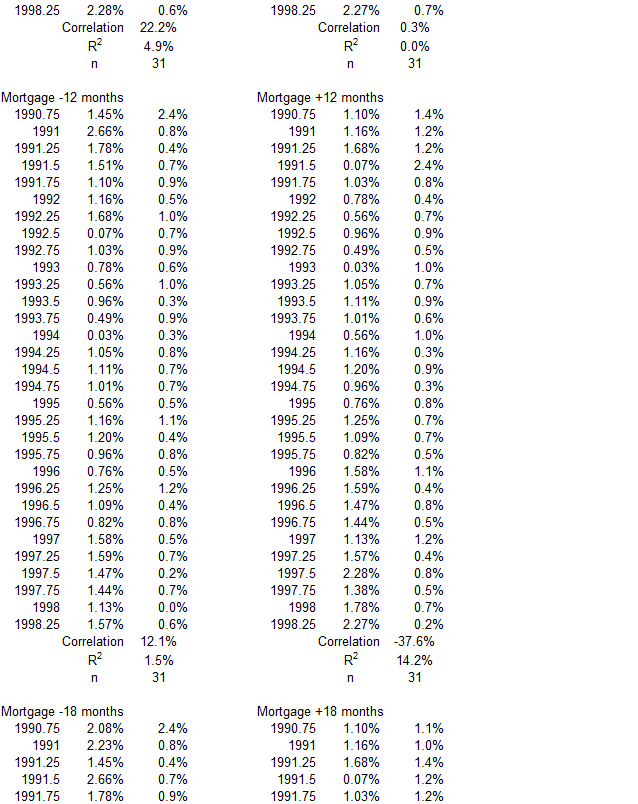
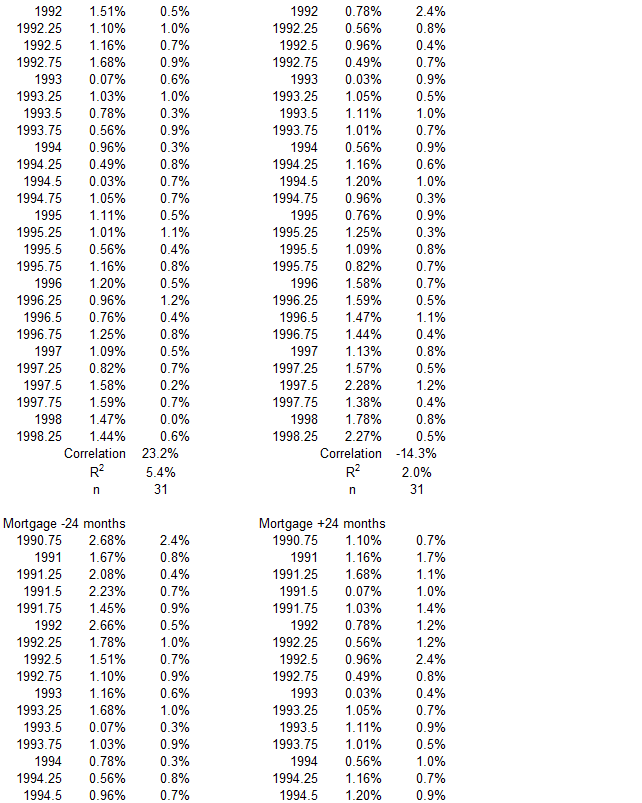
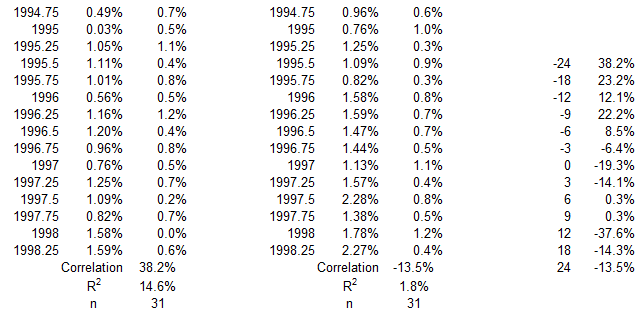
4Q 1990 – 1Q 1998
Figure 10. U.S. Mortgage Debt and Inflation 4Q 1990 – 1Q 1998
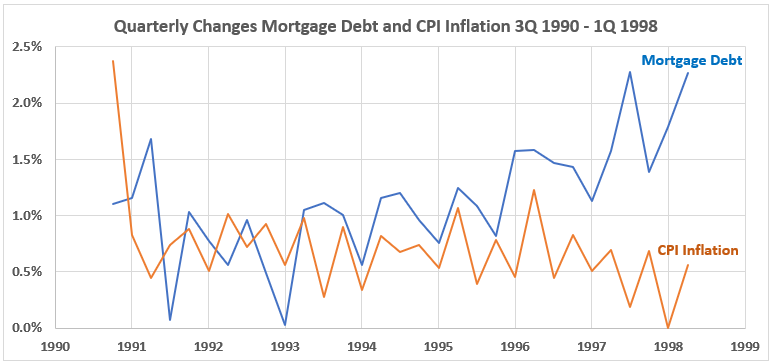
Figure 10 shows more volatility in Mortgage Debt quarterly changes than for CPI inflation. After the first two quarters, the Mortgage Debt changes start a short period in a level trend and then rise from 1993 through the first quarter of 1998. CPI Inflation maintained a level trend until the quarterly changes declined in the last two years.
Figure 11. Quarterly Changes in Mortgage Debt (x) vs. CPI Inflation (y) 4Q 1990 – 1Q 1998
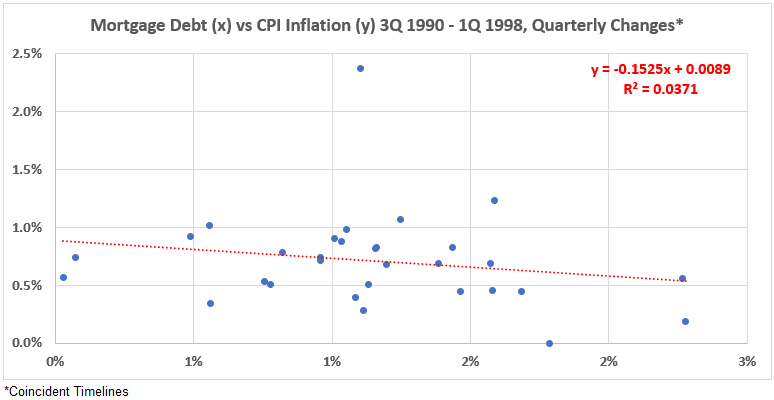
Over the eight-year time period, there is a limited (nearly negligible) negative association between mortgage debt spending and inflation, R = –19% and R2 = 3.7%.
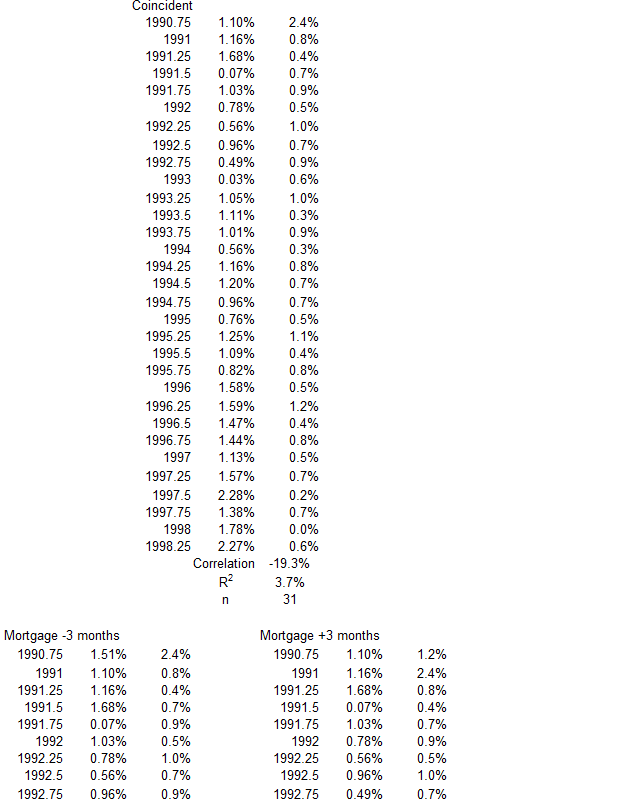
Figure 12. Correlation Between Mortgage Debt and CPI Inflation 4Q 1990 – 1Q 1998
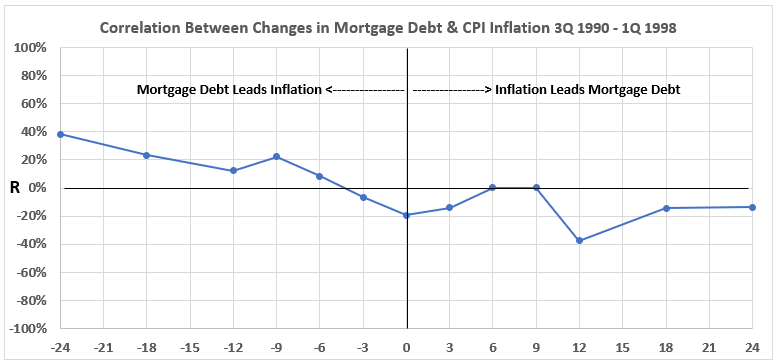
Figure 12 shows little opportunity for major cause-and-effect relationships. There are weak negative or negligible correlations on the right-hand side and weak positive or negligible correlations on the left. The largest R2 values are <15% at -24 months and +12 months. All other R2 values are 5% and less.
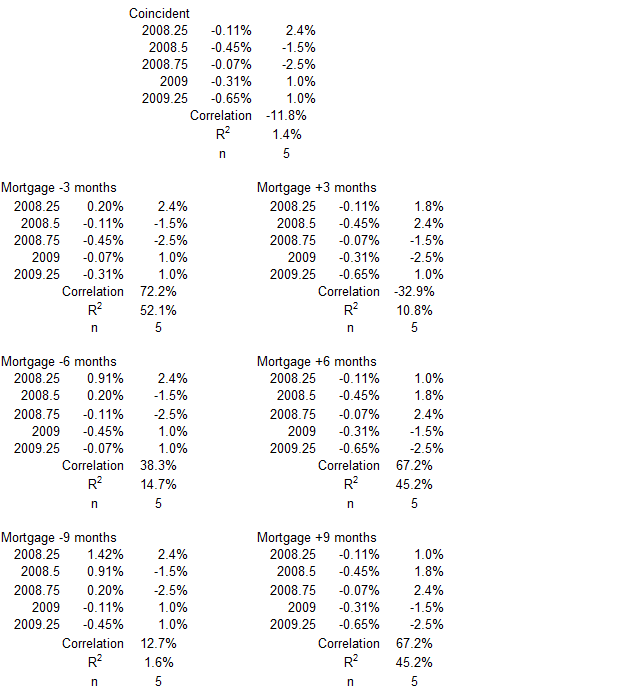
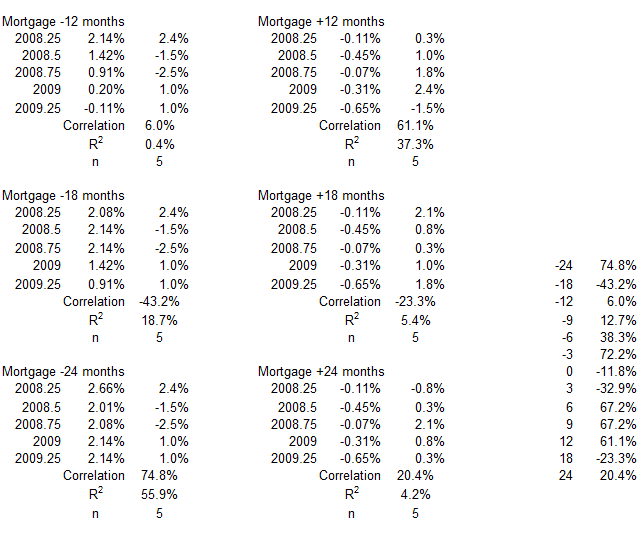
3Q 2008 – 2Q 2009
Figure 13. U.S. HNO Credit and Inflation 3Q 2008 – 2Q 2009
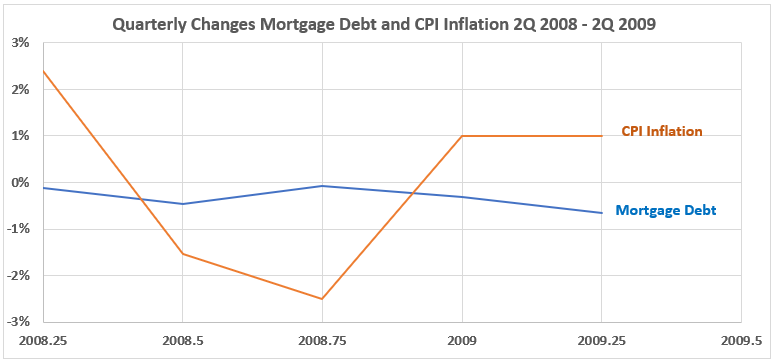
During this short period, Mortgage Debt changes were slightly negative each quarter, while there was a wild swing from inflation to deflation and back to inflation again.
Figure 14. Quarterly Changes in Mortgage Debt (x) vs. CPI Inflation (y) 3Q 2008 – 2Q 2009
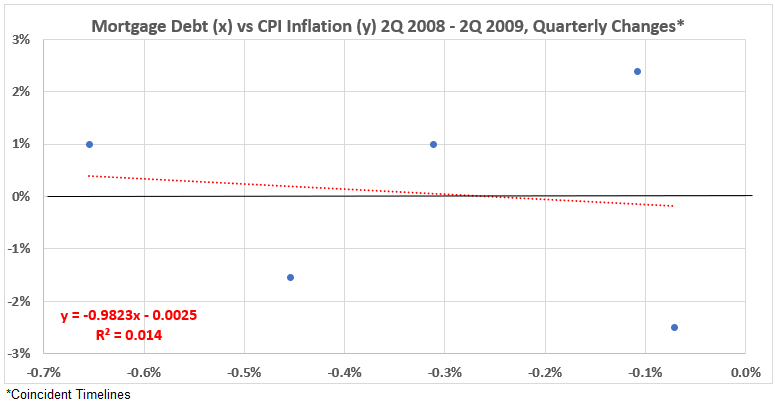
As with the other four time periods with significant decreases in inflation, the coincident data has a negative correlation. R = -12% and R2 = 1.4%.
Figure 15. Correlation Between Mortgage Debt and CPI Inflation 3Q 2008 – 2Q 2009
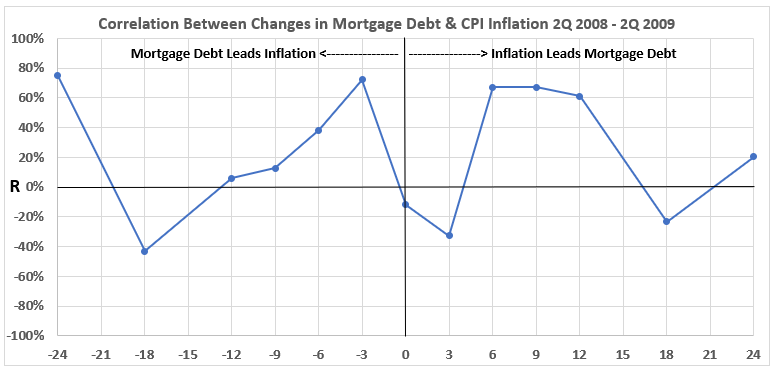
The small data set is probably the explanation for the volatility in Figure 15. There are two strong associations between the variables on the right-hand side, suggesting the possibility that Mortgage Debt might have caused a corresponding change in CPI Inflation later. However, the weak positive and negative associations for the other four data points should indicate some doubt about that possibility.
On the left, we have three consecutive data points with a high-moderate association. This suggests a possibility that CPI Inflation changes could have led to Mortgage Debt changes in the same direction 6, 9, and 12 months later.
The very small data set here should be considered before placing too much confidence in the results for 2008-09.
Conclusion
The observations for the five periods with significant deflation or disinflation:
- All five had some degree of positive associations for CPI Inflation changes coming after Mortgage Debt changes.
- One time period had some negative associations for CPI Inflation changes coming after Mortgage Debt changes.
- Four of five had negligible or negative associations for Mortgage Debt changes coming after CPI Inflation changes.
- One time period had some positive associations for Mortgage Debt changes coming after CPI Inflation changes.
After analyzing periods with no significant inflation changes, there will be more discussion of the results. That comes next week.
Appendix
The data sets for each of the periods of surging inflation are below. They come from the tables of timeline alignments1 (Mortgage Debt and Inflation: Part 1).
1Q 1952 – 4Q 1954
4Q 1974 -4Q 1976
2Q 1980 – 2Q 1983
4Q 1990 – 1Q 1998
Q 2008 – 2Q 2009
Footnotes
1. Lounsbury, John, “Mortgage Debt and Inflation: Part 1”, EconCurrents, October 1, 2023. https://econcurrents.com/2023/10/01/18942/.
2. Lounsbury, John, “Mortgage Debt and Inflation: Part 2”, EconCurrents, October 8, 2023. https://econcurrents.com/2023/10/08/mortgage-debt-and-inflation-part-2/.