The full data sets for the 71 years from 1952 to 2022 show no discernable association patterns (correlations) for household credit growth and inflation changes.1 Thus, we started an analysis by looking specifically at the various regimes of inflation change during the 71-year timeline. The most recent post2 analyzed the eight time periods over 71 years with positive inflation surges. This article analyzes the five periods for 1952-2022 with negative inflation (disinflation/deflation) surges.

From an image by Michal Jarmoluk from Pixabay
Introduction
The 71 years from 1952 to 2022 are divided into three types of inflationary behavior:1
- Significant inflation increases;
- Significant inflation decreases;
- No significant inflation changes.
An inflation change is significant if it is ≥4.0% with no intervening countertrend change >1.5%.
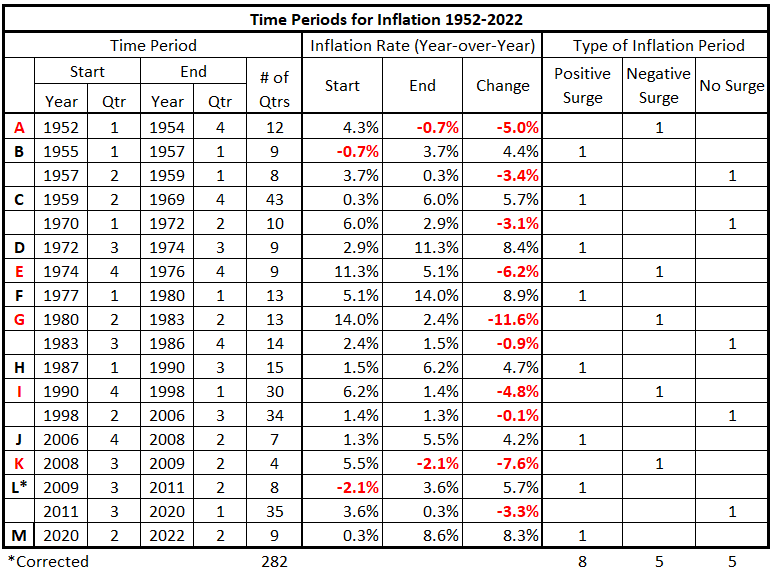
Previously, we defined the partitioning of inflation into the pattern in Table 1.
Table 1. Timeline of Inflation Data 1952-2022 (Previously Table 4*.1)
We will examine each category of inflation behavior separately. In this piece, we analyze the significantly positive periods of inflation (positive inflation surges).
Data
The data is from Tables 5-17, prepared previously.1
There are 13 quarterly timeline alignments:
- HNO Credit and CPI Inflation quarters are coincident.
- HNO Credit leads and lags CPI Inflation by one quarter (±3 months)
- HNO Credit leads and lags CPI Inflation by two quarters (±6 months)
- HNO Credit leads and lags CPI Inflation by three quarters (±9 months)
- HNO Credit leads and lags CPI Inflation by four quarters (±12 months)
- HNO Credit leads and lags CPI Inflation by six quarters (±18 months)
- HNO Credit leads and lags CPI Inflation by eight quarters (±24 months)
Analysis
1Q 1952 – 4Q 1954
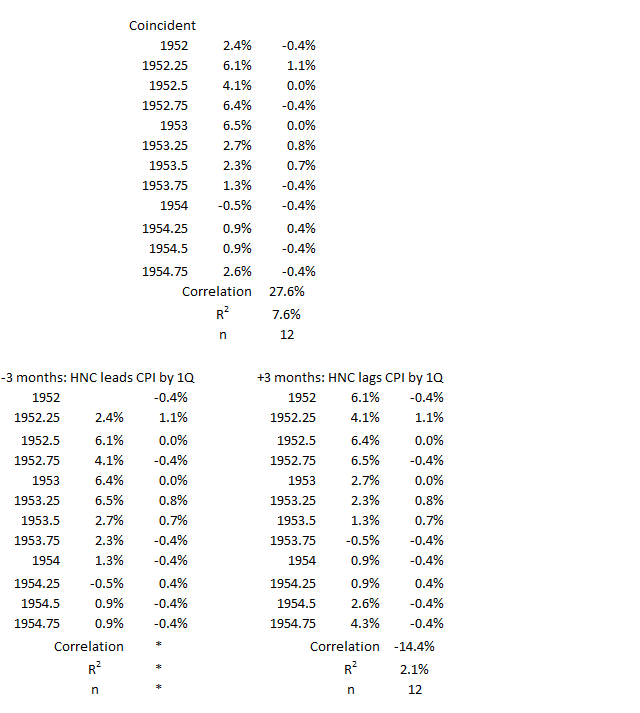
Figure 1. U.S. HNO Credit and Inflation 1Q 1952 – 4Q 1954
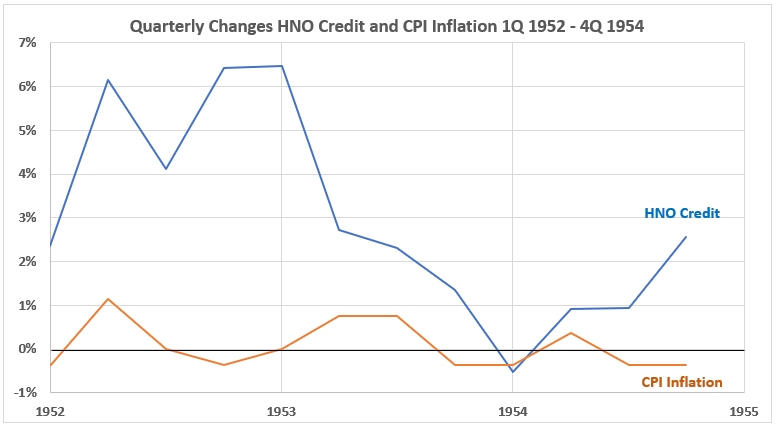
It may seem surprising that quarterly changes in CPI inflation are small compared to those for HNO Credit. But, in 1952, consumer credit was only about 7% of GDP and about 10% of consumer spending. The direction of the changes shows little consistency for the two variables, which is important to focus on.
Figure 2. Quarterly Changes in HNO Credit (x) vs. CPI Inflation (y) 1Q 1952 – 4Q 1954
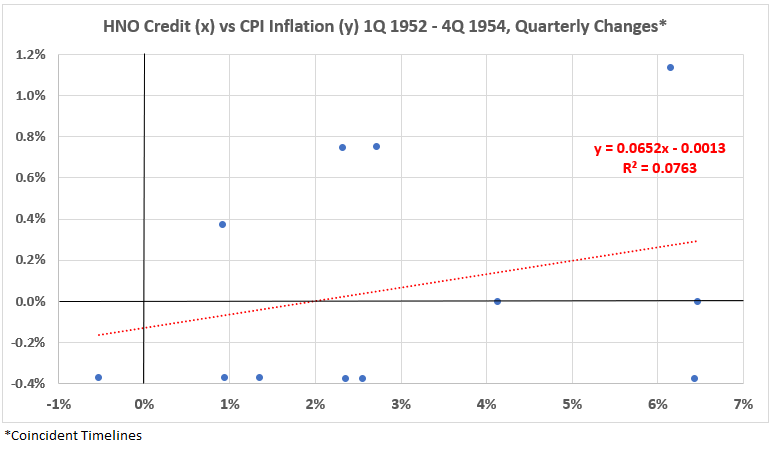
The association between the two variables is small and positive. R = 28% and R2 = 7.6%.
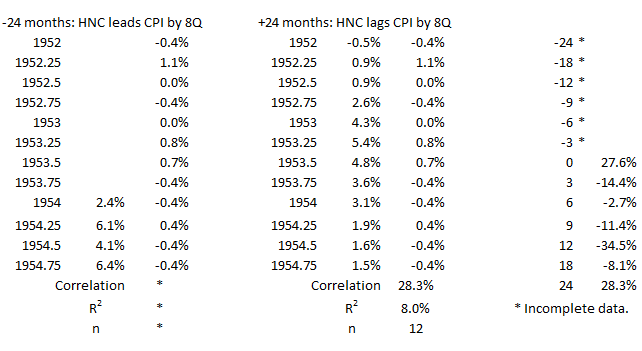
Figure 3. Correlation Between HNO Credit and CPI Inflation 1Q 1952 – 4Q 1954
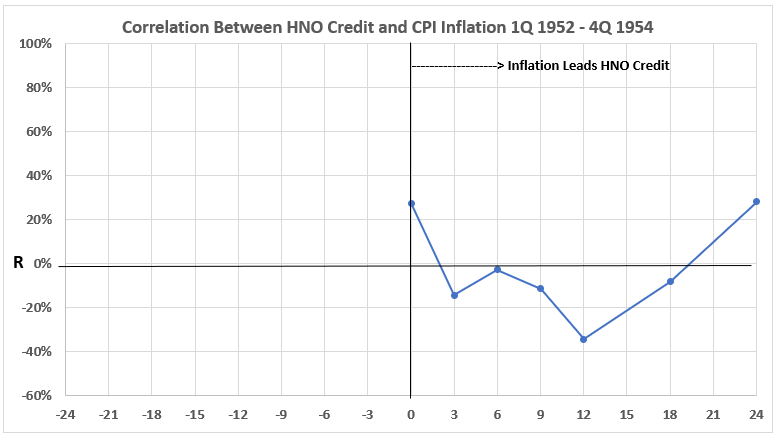
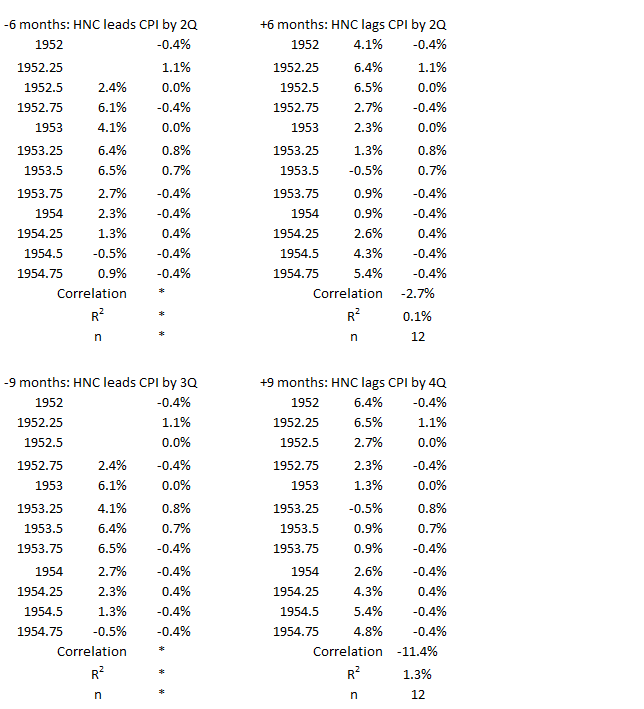
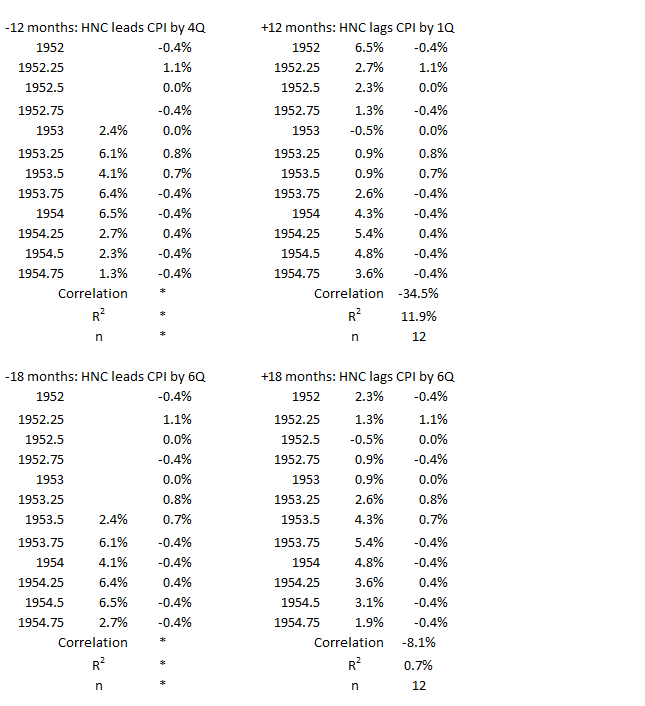
As the timelines shift relative to each other, the association (correlation) is small, both negative and positive, for coincident data and for HNO Credit following inflation by the number of months indicated. There is no data for consumer credit before 1952 in this dataset, so the left-hand side of the graph for HNO Credit occurring before CPI inflation is blank.
4Q 1974 -4Q 1976
Figure 4. U.S. HNO Credit and Inflation 4Q 1974 – 4Q 1976
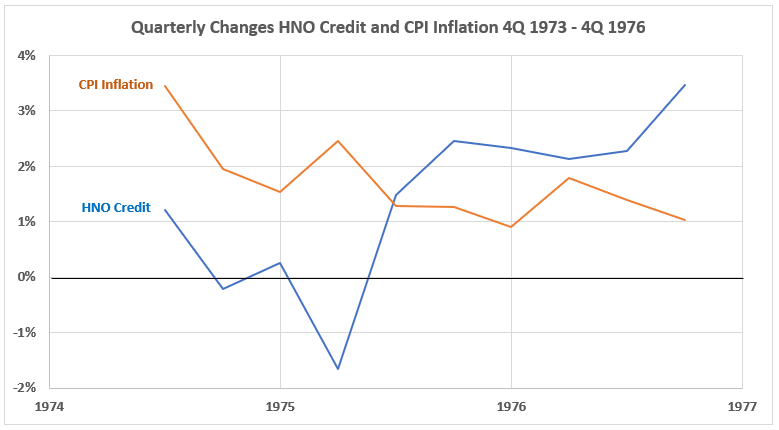
Figure 4 is a tale of two charts. For the first four quarters, HNO Credit changes are smaller than for CPI Inflation, and both are falling (except for 2Q 1975). Then the last five quarters show HNO Credit changes becoming larger and in an increasing trend, while CPI Inflation continues a general declining trend.
Figure 5. Quarterly Changes in HNO Credit (x) vs. CPI Inflation (y) 4Q 1974 – 4Q 1976
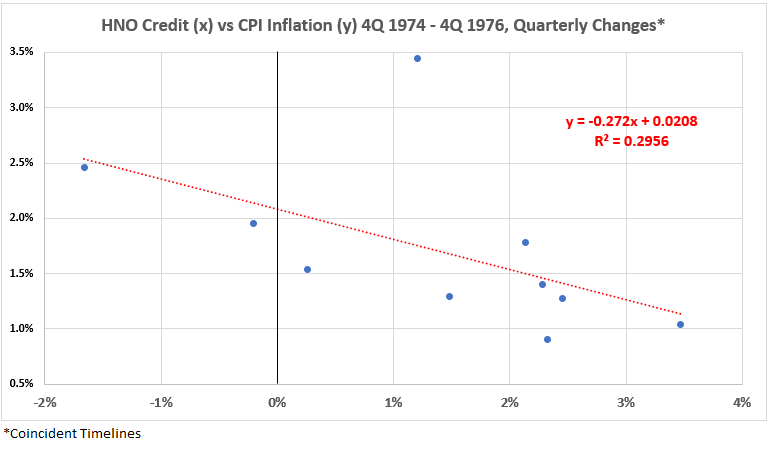
The overall association between these two variables is moderate and negative. R = –59% and R2 = 30%.
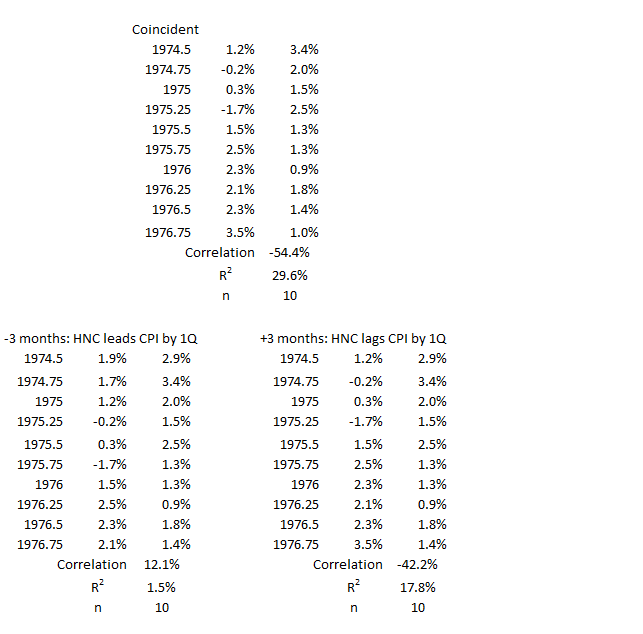
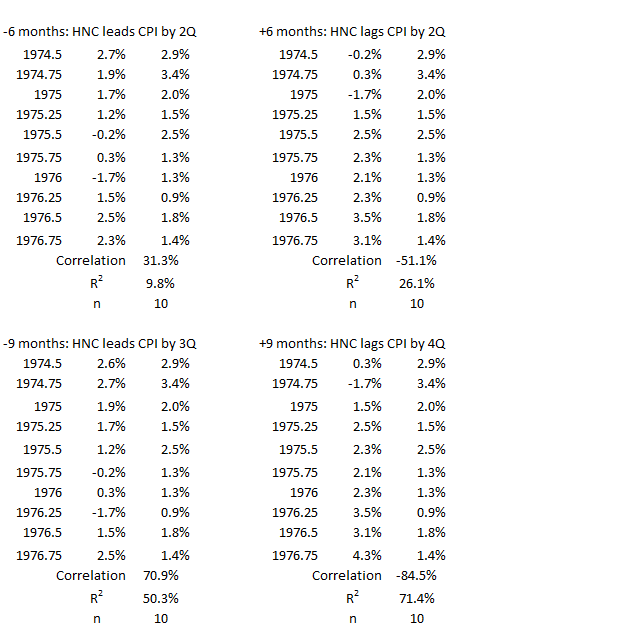
Figure 6. Correlation Between HNO Credit and CPI Inflation 4Q 1974 – 4Q 1976
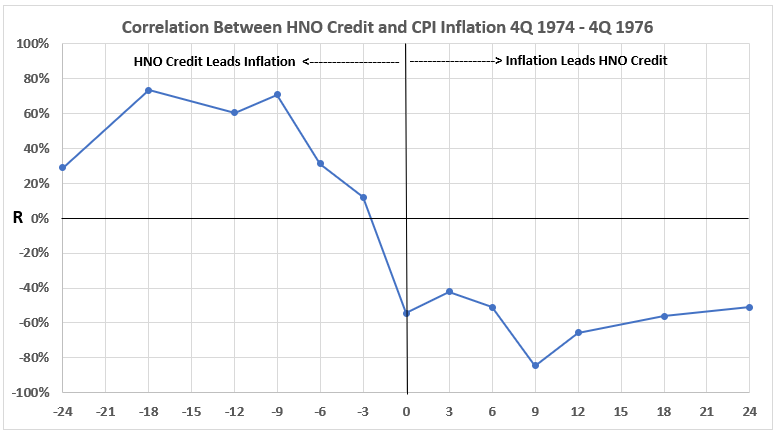
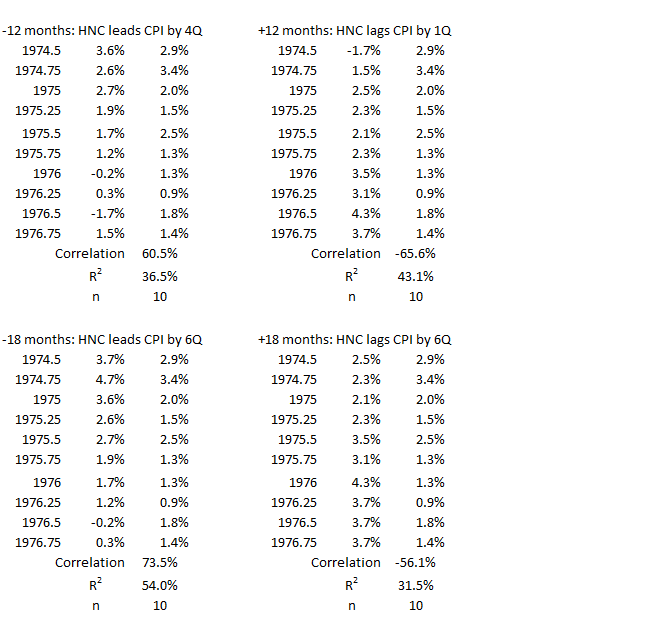
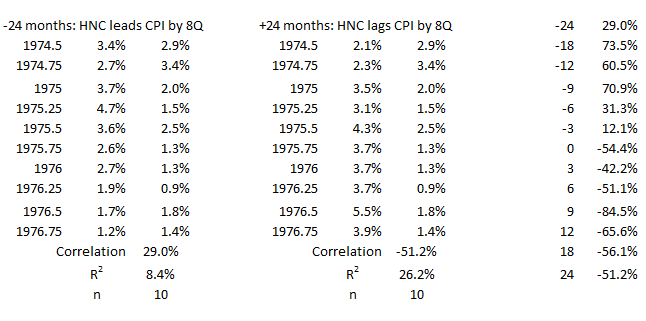
Figure 6 has a clear message. The positive association of HNO Credit with inflation is moderate to strong when credit comes before inflation. On the other hand, the association is negative (again, moderately and strongly) when inflation comes before credit spending.
Let’s restate the observations, with an emphasis on the fact that inflation is declining significantly during this time period.
From the lefthand side of Figure 6, this data indicates that decreasing HNO Credit spending is positively associated with declining inflation 9 to 18 months in the future. The inference is that if there is cause-and-effect, it takes some time for lower credit spending to have an effect on inflation.
From the right-hand side of Figure 6, we see a consistent moderate to strong negative association between the variables. This implies that either:
- There is no association between falling inflation and reduced use of consumer credit; or
- It is possible that falling inflation could cause increased use of consumer credit.
This is a good time to remind ourselves that association only means cause-and-effect might be possible. Other information is needed to determine if there is any causation at all.
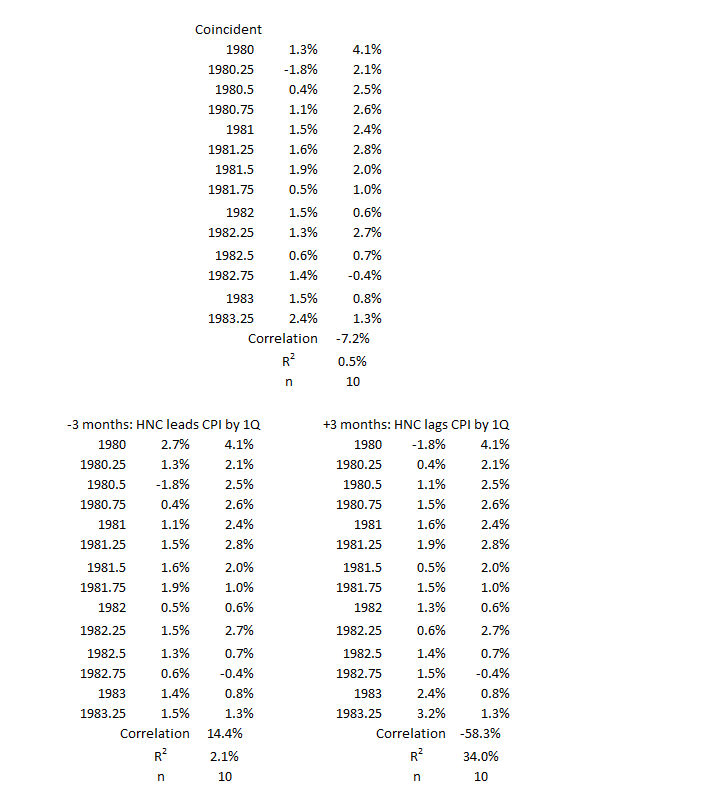
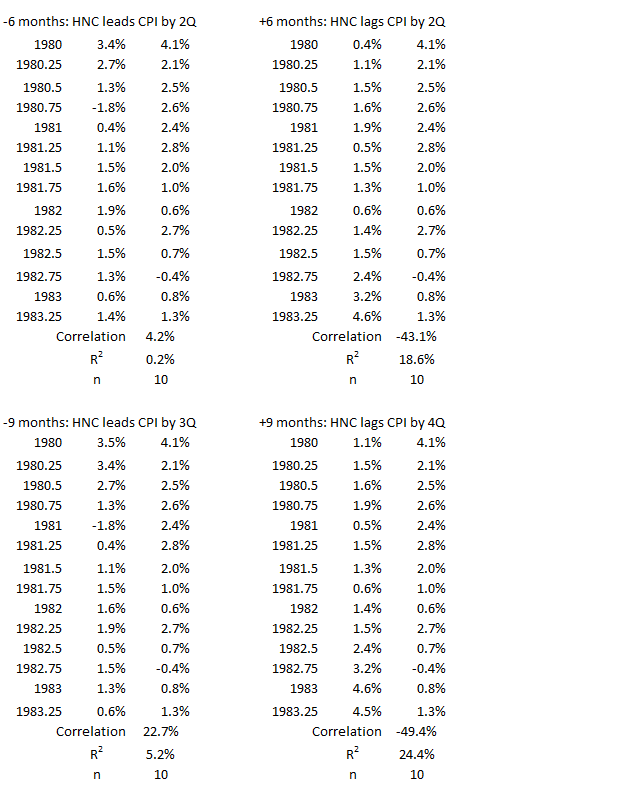
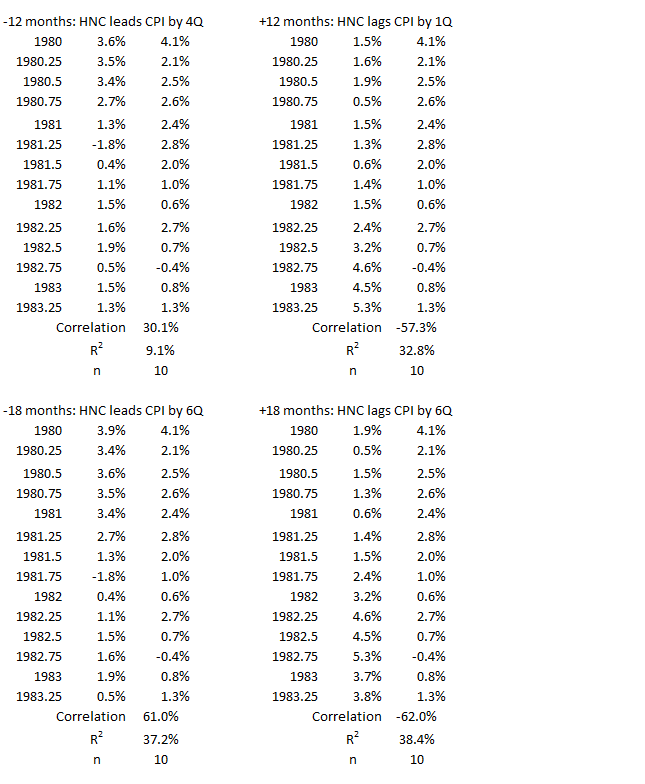
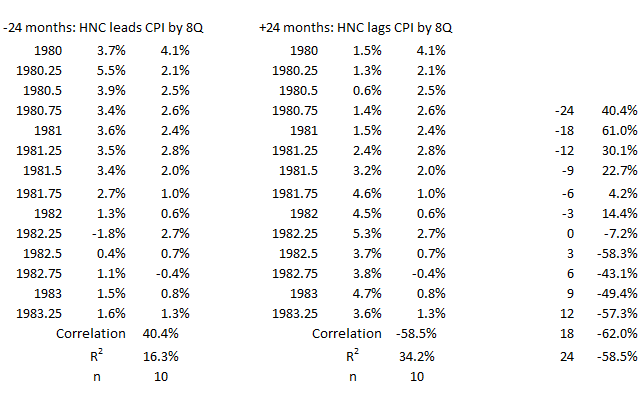
2Q 1980 – 2Q 1983
Figure 7. U.S. HNO Credit and Inflation 2Q 1980 – 2Q 1983
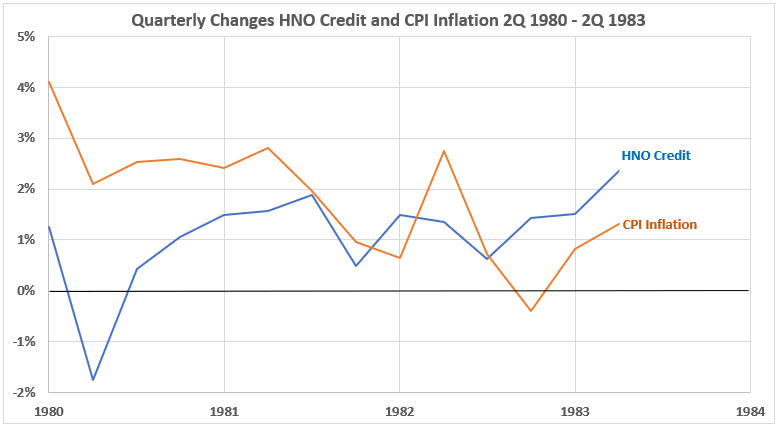
The general observation for Figure 7 is that the two variables show good correlation for the first and last two quarters and and much less in between. It appears that the trends for HNO Credit (level to up) and for CPI Inflation (down) are opposed (negative association).
Figure 8. Quarterly Changes in HNO Credit (x) vs. CPI Inflation (y) 2Q 1980 – 2Q 1983
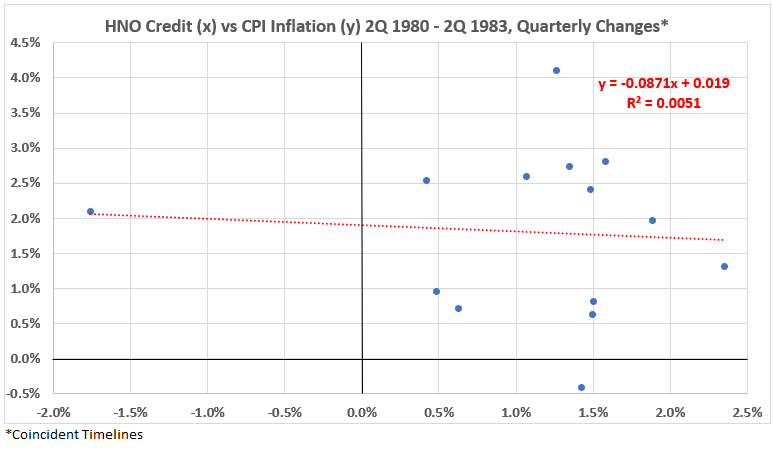
Figure 8 confirms our cursory observation about opposing trends in the discussion above (Figure 7). However, the negative association is negligible: R = –7.2% and R2 = 0.5%.
Figure 9. Correlation Between HNO Credit and CPI Inflation 2Q 1980 – 2Q 1983
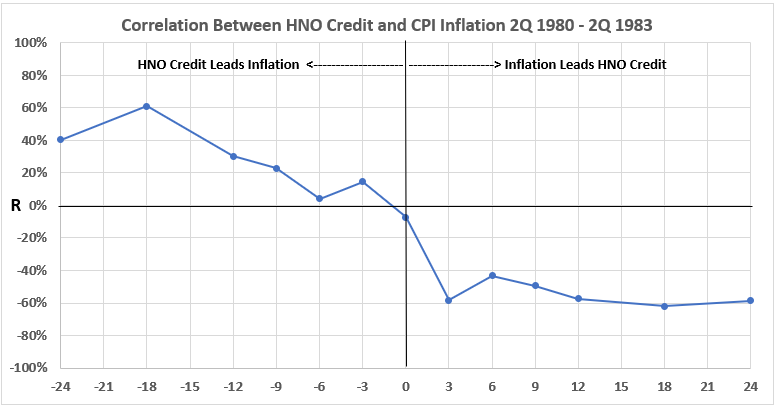
Again we see a negative association when HNO Credit follows CPI Inflation (righthand side of Figure 9). We also see a positive association for HNO Credit coming before CPI Inflation (left-hand side). It should be noted that the associations during this period are weaker (especially on the left-hand side) than in the previous period (4Q 1974 – 4Q 1976).
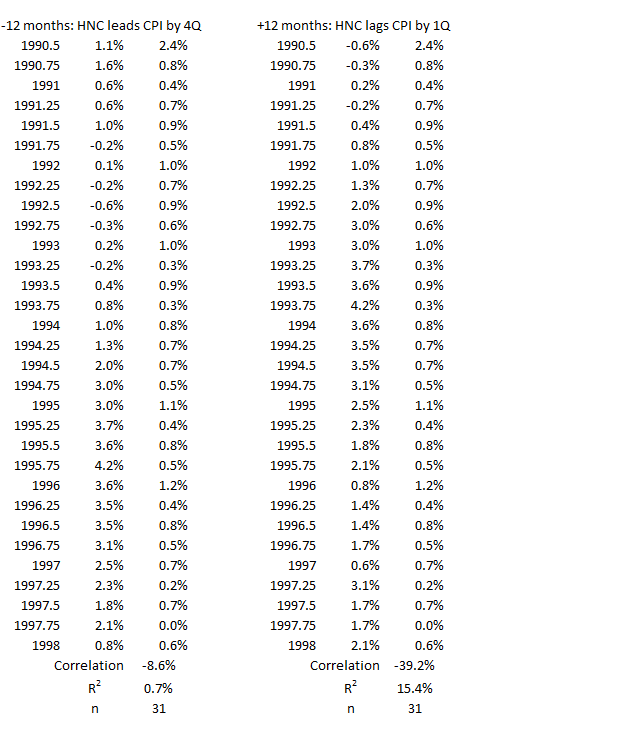
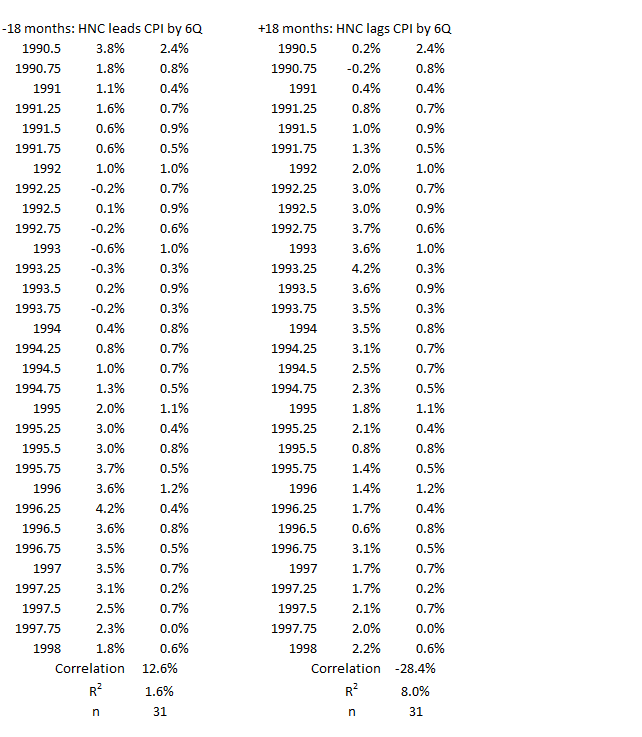
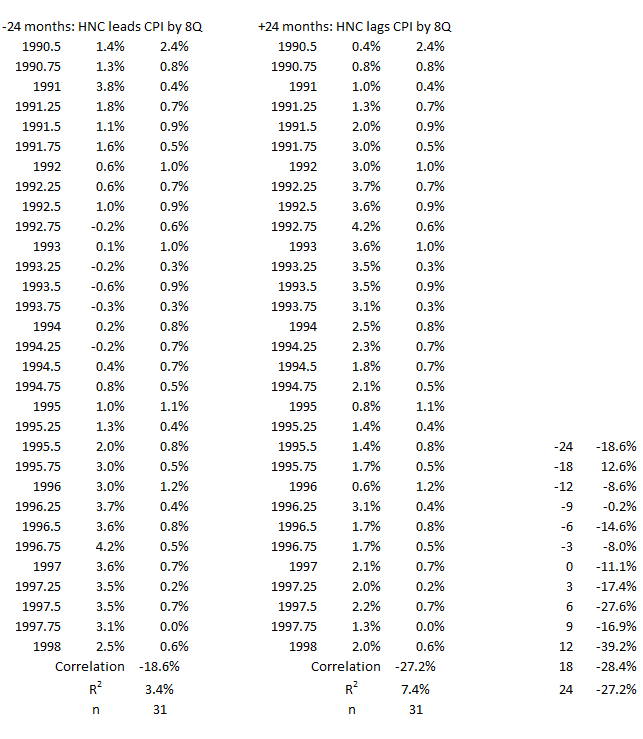
4Q 1990 – 1Q 1998
Figure 10. U.S. HNO Credit and Inflation 4Q 1990 – 1Q 1998
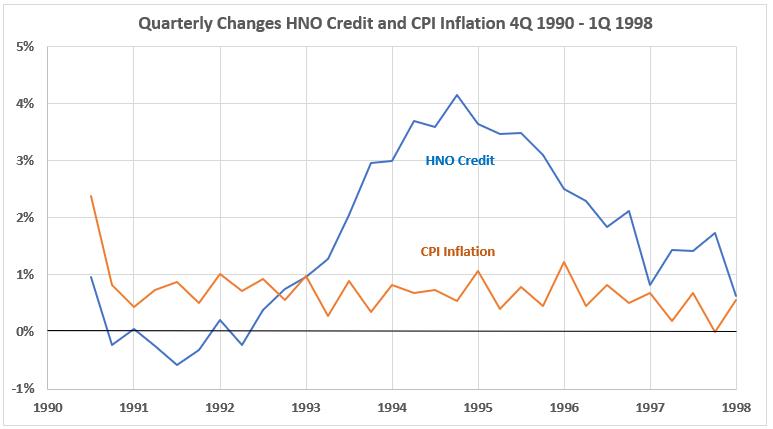
Figure 10 shows that big changes in HNO Credit appear to be associated with very small changes in CPI inflation.
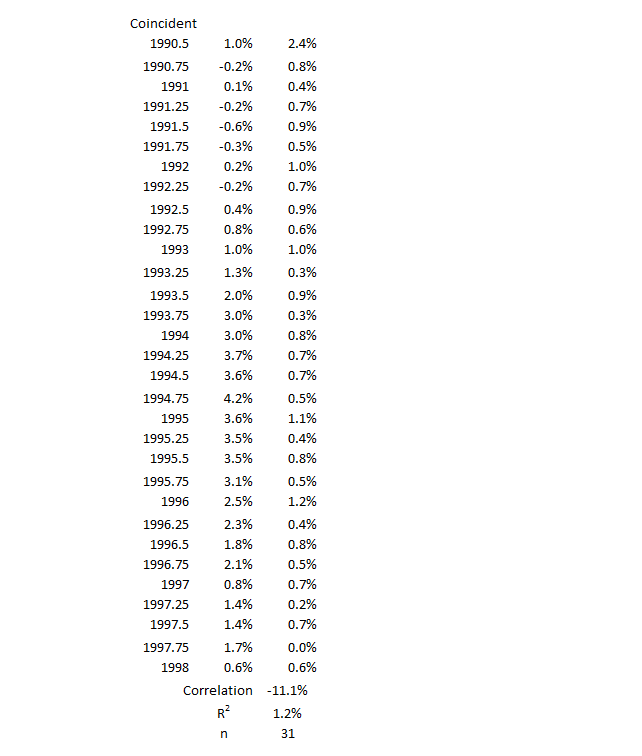
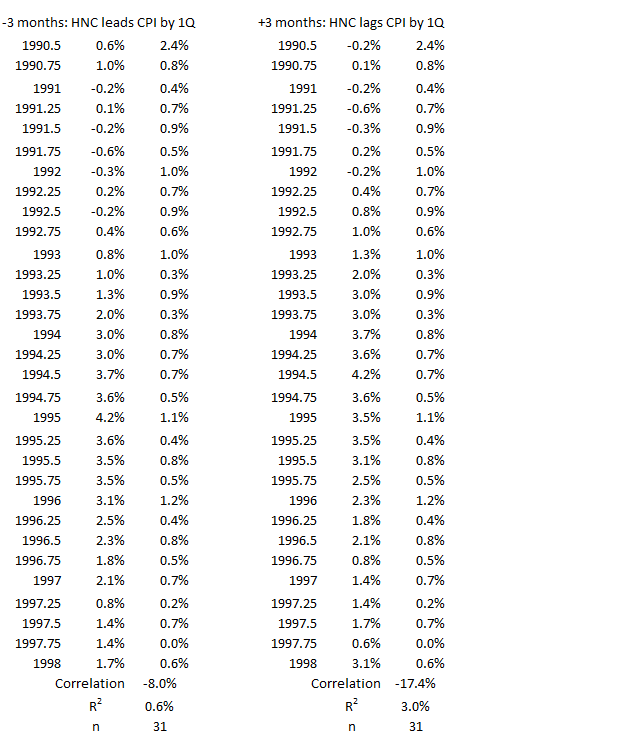
Figure 11. Quarterly Changes in HNO Credit (x) vs. CPI Inflation (y) 4Q 1990 – 1Q 1998
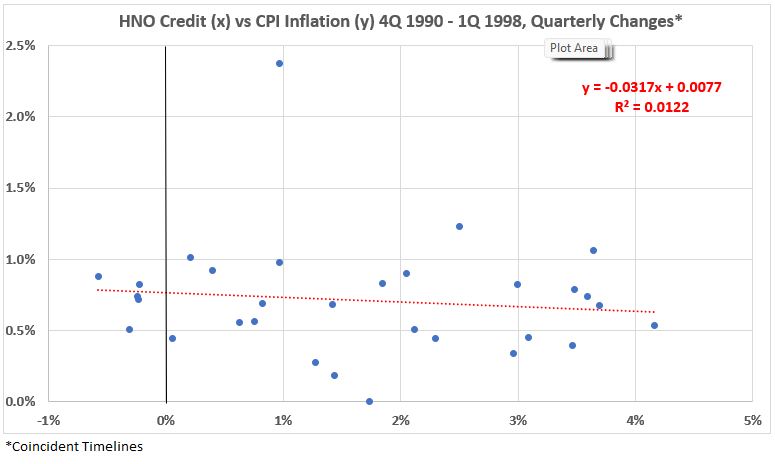
The scatter plot (Figure 11) confirms the general observation made for Figure 10: There is a limited negative association between credit spending and inflation during the 1990s. R = –11% and R2 = 1.2%.
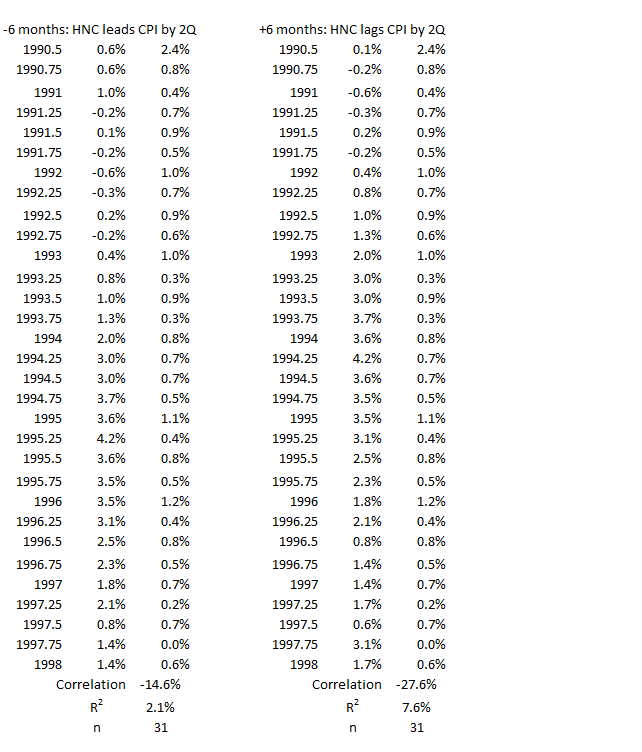
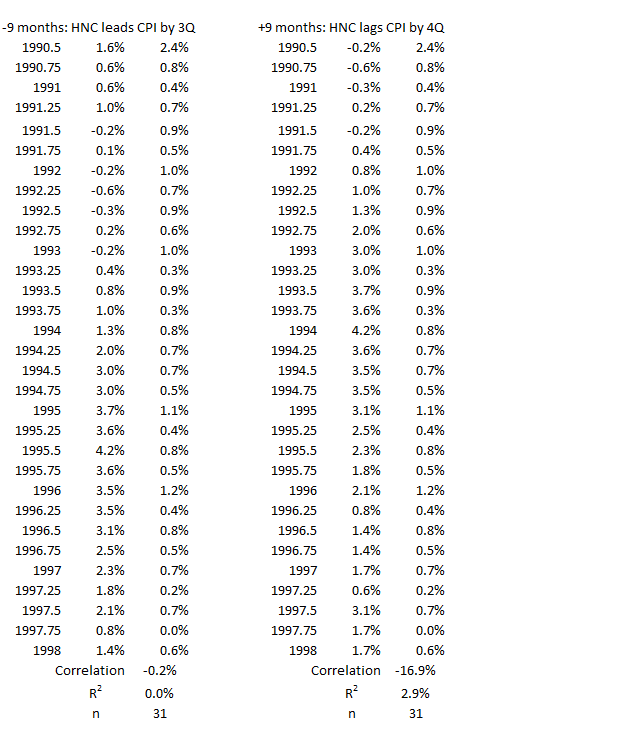
Figure 12. Correlation Between HNO Credit and CPI Inflation 4Q 1990 – 1Q 1998
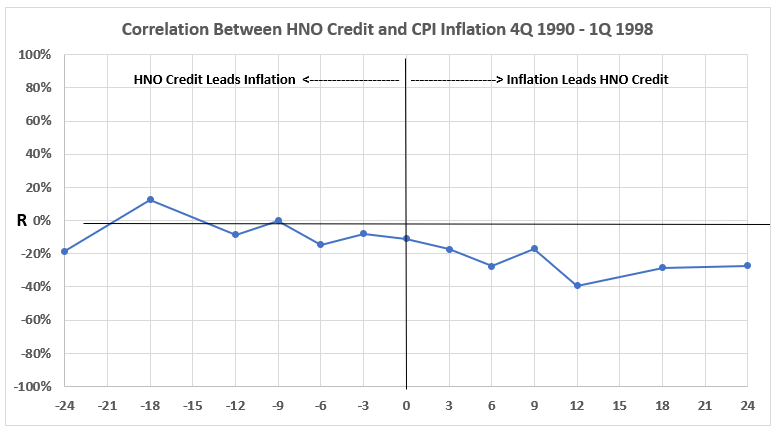
Figure 12 shows little opportunity for major cause-and-effect relationships. There are weak negative correlations on the right-hand side, but most data points on the left are near or in negligible territory.
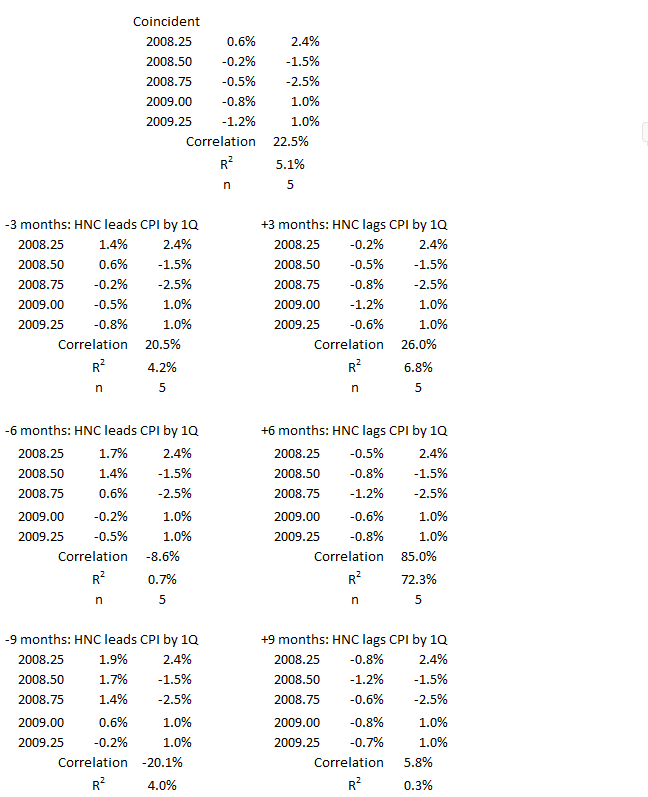
3Q 2008 – 2Q 2009
Figure 13. U.S. HNO Credit and Inflation 3Q 2008 – 2Q 2009
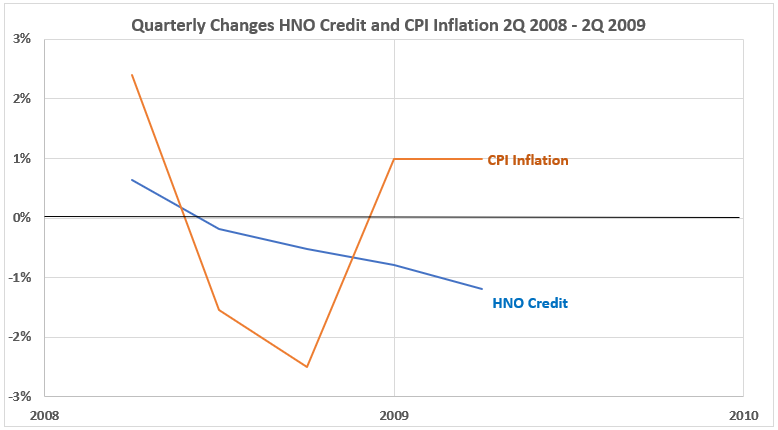
In Figure 13, we see a data set that is different from the first four we analyzed. CPI Inflation is changing in a wild pattern, while CNO Credit is showing a smooth decline in quarterly changes from slightly positive to modestly negative.
Figure 14. Quarterly Changes in HNO Credit (x) vs. CPI Inflation (y) 3Q 2008 – 2Q 2009
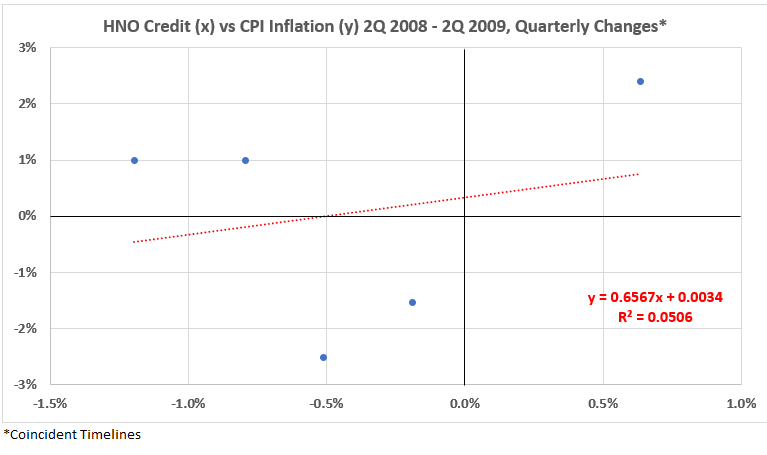
There is a lot of scatter in Figure 14, suggesting that analysis of this small data set may offer some problems. The association here is weak and positive. R = 23% and R2 = 5.1%.
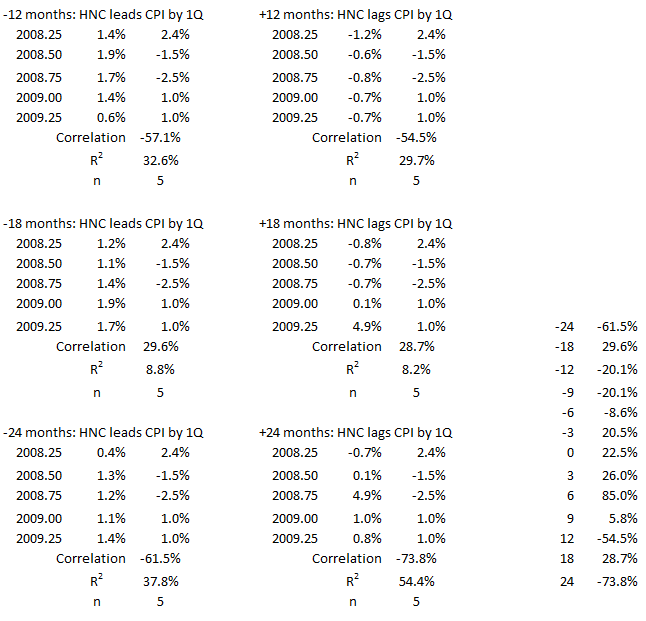
Figure 15. Correlation Between HNO Credit and CPI Inflation 3Q 2008 – 2Q 2009
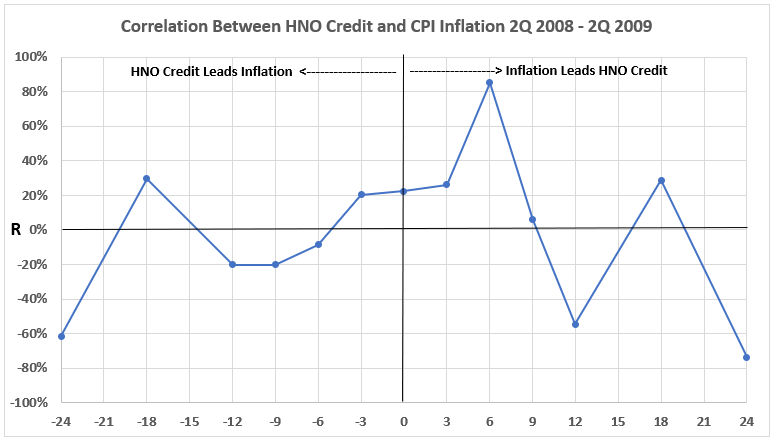
We see a different pattern in Figure 15 than for the correlation diagrams in the other time periods. Here there is a strong correlation data point for inflation leading credit spending by 6 months. The significance of this data point might be questioned because all the other right-hand side data points are weak positive, negligible, or negative. However, we cannot dismiss the data point. The erratic behavior may simply result from the very small data set.
The data on the left side also differs from three of the four preceding time periods: There is little to suggest much positive association when credit spending data precedes inflation data by up to 24 months.
Conclusion
Three of the time periods when inflation was surging downward show the same general pattern to varying degrees:
- Positive correlations for timeline offsets with credit spending changes preceding inflation changes.
- Negative correlations for timeline offsets with inflation changes preceding credit spending changes.
The 1990s and the crash of 2008-09 do not show the correlation patterns of the other three significant inflation declines. What this means is not clear at present.
After analyzing periods with no significant inflation changes, there will be more discussion of the results. That comes next week.
Appendix
The data sets for each of the periods of surging inflation are below. They come from the tables of timeline aligments1 (Consumer Credit and Inflation: Part 1).
1Q 1952 – 4Q 1954
4Q 1974 -4Q 1976
2Q 1980 – 2Q 1983
4Q 1990 – 1Q 1998
3Q 2008 – 2Q 2009
Footnotes
1. Lounsbury, John, “Consumer Credit and Inflation: Part 1”, EconCurrents, September 3, 2023. https://econcurrents.com/2023/09/03/consumer-credit-and-inflation-part-1/.
2. Lounsbury, John, “Consumer Credit and Inflation: Part 2”, EconCurrents, September 10, 2023. https://econcurrents.com/2023/09/10/consumer-credit-and-inflation-part-2/.