Here is what we are paying attention to in the next 48 to 72 hours. The article also includes weather maps for longer-term outlooks and a six-day World weather outlook.
We start with the U.S. Information. You can update this section here but these are 48 to 72-hour forecasts so if I have not been able to update this area twice daily, what is shown is still valid and the images in the body of the article update automatically but sometimes they are a bit slow to update.
Short Range Forecast Discussion
NWS Weather Prediction Center College Park MD
Sun Sep 10 2023
Valid 12Z Sun Sep 10 2023 – 12Z Tue Sep 12 2023…Dangerous heat to persist for one more day across portions of the
Southwest, before temperatures begin to steadily fall early this week……Showers and thunderstorms and cooler temperatures to spread across the
northern to central Plains and the Midwest……Locally heavy rain, with flash flooding possible today from the
southern and central Appalachians to New England…
| Notices: Recently we published an article on a court decision that relates to whether or not states can decline to store out-of-state nuclear waste and you can access that article HERE. It is part of a series of articles I am writing on nuclear waste storage which is a huge problem for the world and the U.S. and I urge readers to read this court decision.
|
First, the 48-Hour Forecast (It is a 48 to 72 Hour Forecast actually)
Daily weather maps. The Day 1 map updates twice a day and the Day 2 and 3 maps update only once a day. These maps update automatically. But if that does not happen, you can get updates by clicking HERE
TODAY (or late in the day the evening/overnight map will appear)
TOMORROW
NEXT DAY
This animation shows how things may play out over the next 60 hours. To update click here.
The NWS Climate Prediction Center’s: Watches, Warnings, and Advisories plus other information can be found HERE. We post at least one of those updates daily, sometimes both. The Highlights are shown in the lede paragraph of this article.
ATMOSPHERIC RIVERS
This tells us what is approaching the West Coast. Click HERE to update If I have not gotten around to doing the update. Here is some useful information about Atmospheric Rivers.
Continuation of the NWS Short Range Forecast. It is updated by NWS twice a day and these updates can be found here
Temperatures will remain well-above normal and will likely reach record
levels today across portions of southern Texas and the southwestern U.S.
Excessive heat warnings remain in effect for the lower deserts of southern
California and southeastern Arizona, including the Phoenix metro, where a
strong upper high will support temperatures climbing once again to near
110F in some locations. Temperatures are forecast to start decreasing
beginning Monday as the upper high begins to break down and moisture
associated with tropical cyclone Jova supports increasing cloud cover. By
Tuesday, temperatures across the Southwest are expected to be near
seasonal to below-normal, with widespread shower and thunderstorms
expected.Much cooler temperatures will also be spreading south and east from the
northern Plains today into the central Plains and the upper to mid
Mississippi Valley by Monday, before reaching into the Great Lakes, Ohio
Valley and parts of the southern Plains on Tuesday. In addition to
below-normal temperatures, periods of showers and thunderstorms will
follow a well-defined cold front as it moves across the region. Some
storms may become strong to severe, producing large hail, damaging winds,
and heavy to excessive rainfall. The greatest threat today is expected to
center near western Kansas and the Oklahoma Panhandle, with SPC
highlighting the severe weather threat and WPC noting the excessive
rainfall threat across this area.Showers and thunderstorms are also expected to develop farther south near
the trailing end of a stalled frontal boundary that extends from the
northern Gulf of Mexico northwestward into the southern High Plains.In the East, a stalled frontal boundary, ample moisture, and an upper
disturbance lifting out of the Southeast, will support widespread showers
and thunderstorms today. Areas of heavy rainfall are expected, with
localized flash flooding possible. The greatest threat for heavy rainfall
is forecast to center from the central Appalachians northeastward through
the Mid Atlantic into New England.
Learn about wave patterns HERE.
Below is the current five-day cumulative forecast of precipitation (Updates can be found HERE)
Now we look at Intermediate-Term “Outlook” maps for three time periods. Days 6 – 10, Days 8 – 14, and Weeks 3 and 4. An outlook differs from a forecast based on how NOAA uses these terms in that an “outlook” presents information as deviation from normal and the likelihood of these deviations.
Below are the links to obtain updates and additional information. They are particularly useful if you happen to be reading this article significantly later than when it was published. I always try to provide readers with the source of the information in my articles.
| Days 6 – 10 (shown in Row 1) | Days 8 – 14 (Shown in Row 2) | Weeks 3 and 4 (Shown in Row 3 but updates only on Fridays) |
| https://www.cpc.ncep.noaa. gov/products/predictions/610day/ | https://www.cpc.ncep .noaa.gov/products/predictions/814day/ | https://www.cpc.ncep.noaa.gov/products/predictions/WK34/ |
Showing the actual maps. They should now update automatically. The Week 3 – 4 Outlook only updates on Fridays. So below is what I call the Intermediate-term outlook. On Fridays, it extends out 28 Days. That declines day by day so on Thursday it only looks out 22 days until the next day when the Week 3 – 4 Outlook is updated and this extends the outlook by one additional week.
| 6–
10
|
|
|
| 8–
14 |
|
|
| 3–
4 |
|
|
HAZARDS OUTLOOKS
Click here for the latest complete Day 3 -7 Hazards forecast which updates only on weekdays. Once a week probably Monday or Tuesday I will update the images. I provided the link for readers to get daily updates on weekdays. Use your own judgment to decide if you need to update these images. I update almost all the images Friday Night for the weekend edition of this Weather Report. So normally readers do not need to update these images but if the weather is changing quickly you may want to.
Temperature month to date can be found at https://hprcc.unl.edu/products/maps/acis/MonthTDeptUS.png
Precipitation month to date can be found at https://hprcc.unl.edu/products/maps/acis /MonthPNormUS.png
World Forecast
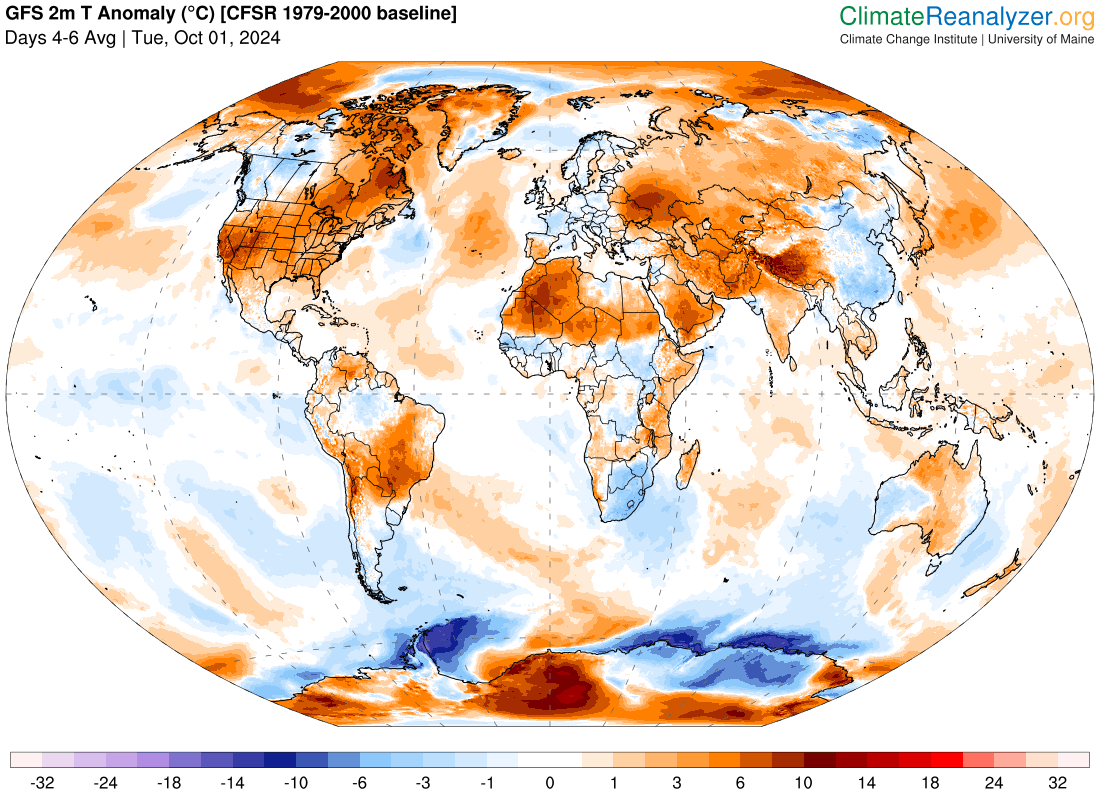
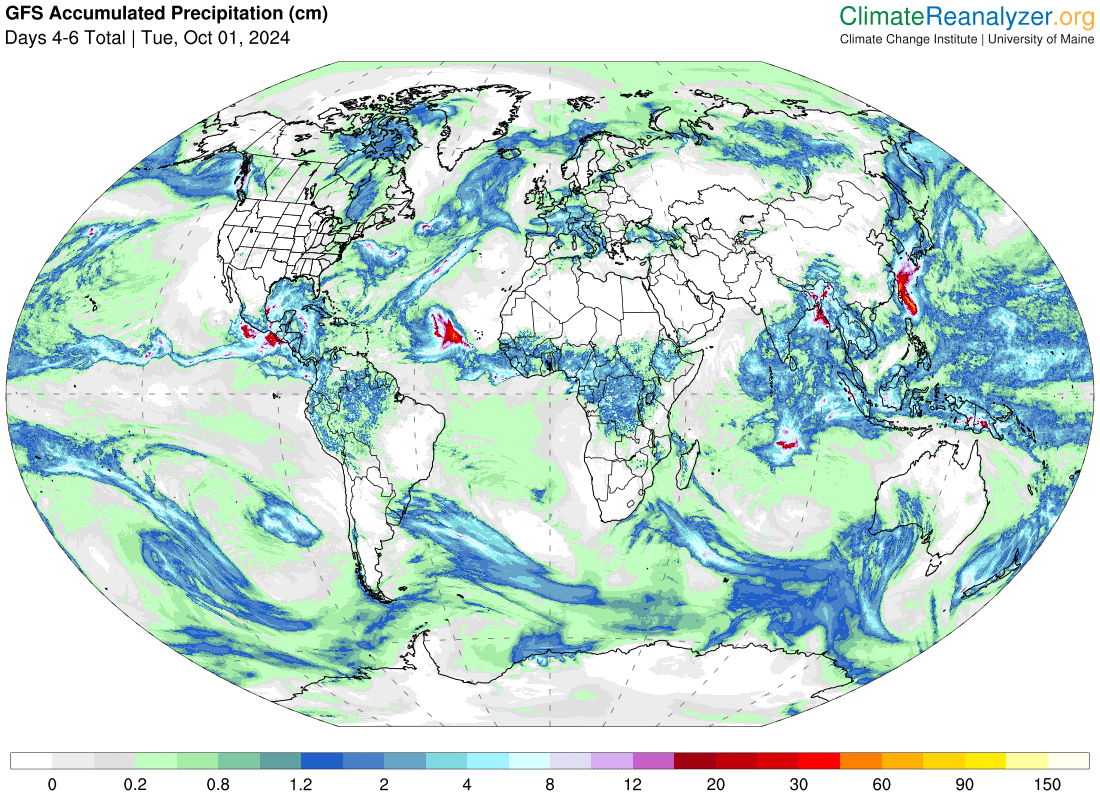
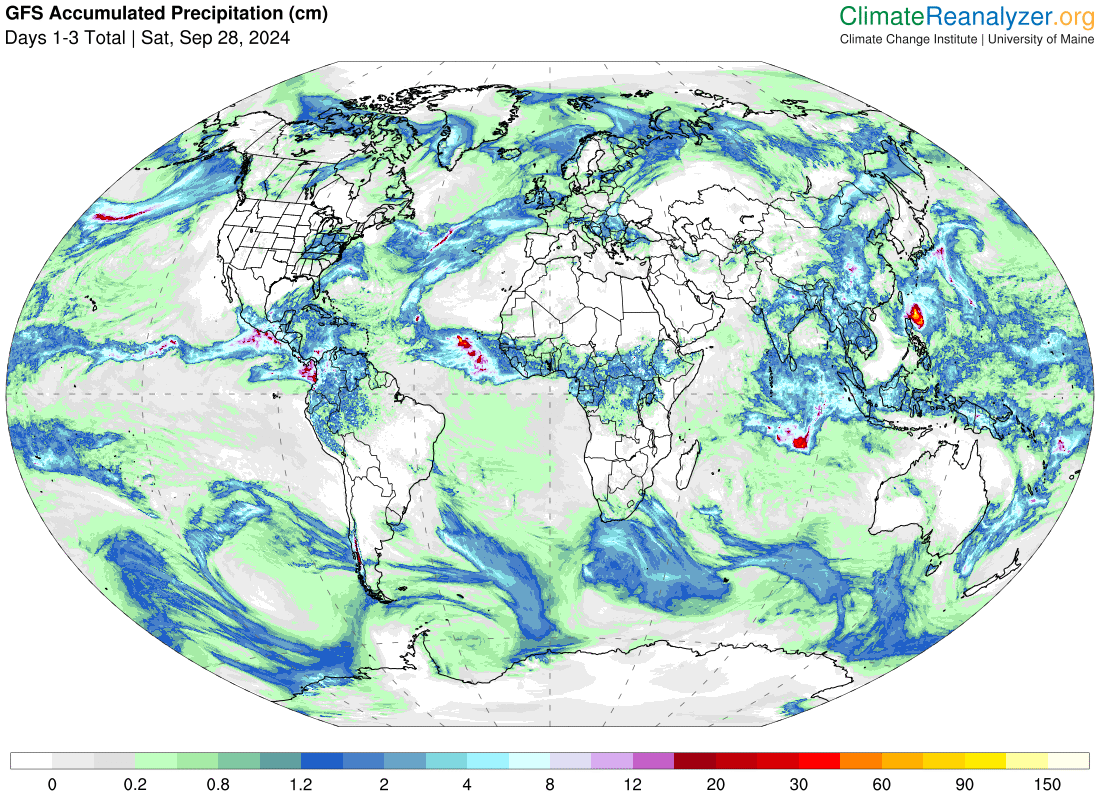
Below are the Day 1 -3 and 4-6 forecasts for temperature and precipitation. Updates and much additional information can be obtained HERE
World Temperature Anomalies

World Accumulated Precipitation

This information is provided by the University of Maine. They draw upon many different sources. There is a lot of information available at the link provided. I have just provided two useful forecasts. There are probably over a hundred different forecasts available from this source.
Worldwide Tropical Forecast (This is a NOAA Product)
This graphic updates on Tuesdays) If it has not been updated, you can get the update by clicking here Readers will only have to do that if they are reading this article much later than the date of it being published.
Information on Tropical Storms can be found HERE. Western Pacific information can be found HERE.

Hurricane Lee Discussion Number 19
NWS National Hurricane Center Miami FL AL132023
1100 PM AST Sat Sep 09 2023
While the geostationary satellite appearance of Lee has not changed appreciably since the prior advisory, data from a NOAA P-3 reconnaissance mission in the storm, in addition to earlier GPM and SSMIS microwave imagery, indicate that Lee is in the middle of an eyewall replacement cycle (ERC). The aircraft has been reporting both an inner and outer eyewall, with the outer eyewall gradually contracting in size. However, this outer eyewall continues to exhibit some asymmetry, consistent with modest vertical wind shear still affecting the storm. In addition, the aircraft has reported that the inner-core wind field is becoming weaker, but broader, with a more muted wind profile outside of the radius of maximum wind. This observation is also evident comparing TDR data between the morning and evening NOAA-P3 missions. The peak 700 mb flight level winds were down to 94 kt, with SFMR only in the 75-85 kt range. The initial intensity has been adjusted to a somewhat generous 90 kt for this advisory.
Lee continues to move west-northwestward this evening at 300/9 kt. As discussed previously, the mid-level ridge axis currently north of Lee is soon expected to shift to its west-southwest, resulting in Lee slowing its forward motion, and perhaps making a slight westward bend over the next 24-36 hours. Afterwards, an eastward-moving mid-latitude trough is expected to erode this ridge and allow Lee to turn northward by the end of the forecast period. There remains a significant amount of spread in both the deterministic and ensemble guidance on when this turn occurs, and then how quickly Lee accelerates northward. For now the NHC track forecast remains closest to the consensus aids, which have slowed a bit from the prior cycle, and the latest track forecast is a bit slower but near the same trajectory as the prior advisory.
While vertical wind shear over Lee appears to be gradual decreasing over the system, the ongoing ERC seems to be resulting in the wind field broadening versus allowing Lee to re-intensify so far. However, once this cycle is complete, reintensification is still anticipated, and the NHC intensity forecast still takes Lee back to a category 4 hurricane in 36-48 hours, in good agreement with the latest HAFS-A/B forecasts, which both explicitly show the ongoing ERC. However, Lee’s growing wind field, in combination with its slowing forward motion, could make the hurricane susceptible to
feeling the effects of its own cold wake, which the atmospheric-ocean coupled HAFS and HWRF models suggest could begin to occur beyond 36 hours. Thus, the latest NHC intensity forecast shows gradual weakening beginning by that time, with more pronounced weakening by the end of the forecast period as the hurricane traverses already cooled sea-surface temperatures from Franklin and Idalia last week along its forecast track. This intensity forecast is in good agreement with the simple consensus aids, but is a little lower than the HFIP corrected consensus early on.
KEY MESSAGES:
- Lee’s core is expected to move well north of the northern Leeward Islands, the Virgin Islands, and Puerto Rico this weekend and early next week.
- Dangerous surf and life-threatening rip currents are affecting portions of the northern Leeward Islands. These conditions are spreading westward and northward and will affect Puerto Rico,Hispaniola, the Turks and Caicos, the Bahamas, and Bermuda during the next several days.
- It remains too soon to know what level of impacts, if any, Lee might have along the U.S. East Coast, Atlantic Canada, or Bermuda late next week, especially since the hurricane is expected to slow down considerably over the southwestern Atlantic. Regardless, dangerous surf and rip currents are expected along most of the U.S. East Coast beginning tomorrow and continuing into next week as Lee grows in size. Users should continue to monitor updates to the forecast of Lee during the next several days.
FORECAST POSITIONS AND MAX WINDS
INIT 10/0300Z 21.0N 59.9W 90 KT 105 MPH
12H 10/1200Z 21.6N 60.9W 100 KT 115 MPH
24H 11/0000Z 22.4N 62.3W 110 KT 125 MPH
36H 11/1200Z 23.0N 63.5W 120 KT 140 MPH
48H 12/0000Z 23.3N 64.7W 115 KT 130 MPH
60H 12/1200Z 23.6N 65.6W 110 KT 125 MPH
72H 13/0000Z 24.0N 66.6W 105 KT 120 MPH
96H 14/0000Z 25.6N 68.0W 95 KT 110 MPH
120H 15/0000Z 28.8N 68.3W 85 KT 100 MPH
–
| I hope you found this article interesting and useful. |
–


