On the third Thursday of the month right on schedule NOAA issued their updated Seasonal Outlook which I describe as their Four-Season Outlook because it extends a bit more than one year into the future. The information released also included the Mid-Month Outlook for the following month plus the weather and drought outlook for the next three months. I present the information issued by NOAA and try to add context to it. It is quite a challenge for NOAA to address the subsequent month, the subsequent three-month period as well as the twelve successive three-month periods for a year or a bit more. A seasonal drought outlook is also issued.
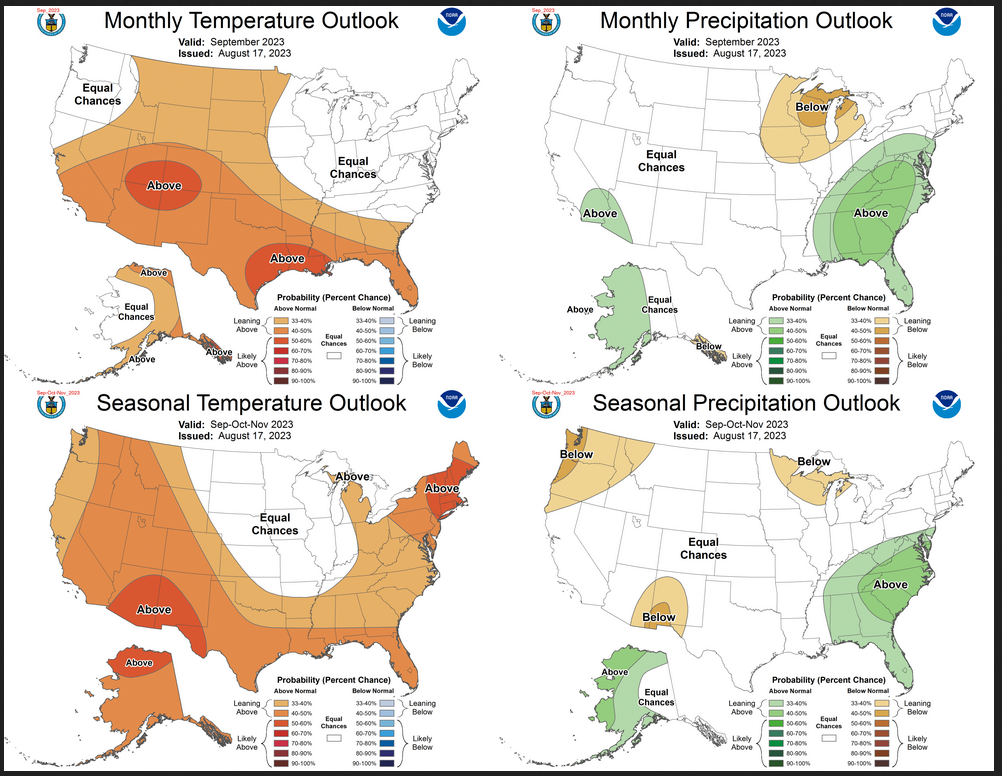
Take a look at September and the three-month period that includes September. The first row in this graphic is the Mid-Month forecast for September. The bottom row shows the outlook for the next three months including September.
The full NOAA Seasonal Outlook extends through August/September/October of 2024. All the maps are in the body of the article.
NOAA provides an excellent discussion to support the maps and the changes (which are minimal) from what was issued a month ago. It is best to read the full discussion but here are some of the highlights:
Re ENSO:
- The median North American Multi-Model Ensemble (NMME) consolidation forecast exceeds +1.5 degrees C at its peak in late autumn and early winter before decreasing at longer leads with greater uncertainty.
- The CPC consensus ENSO outlook indicates greater than a 90 percent chance that El Niño will continue through winter, with greater than a 60 percent chance that the strength of the Niño 3.4 anomaly will exceed +1.5 degrees C at its peak.
[Editor’s Note: How do we define the strength of El Nino? It is very informal but over 1.0 is considered moderate versus weak, over 1.5 is considered strong and over 2.0 is considered very strong.) It is a logical approach since the warmer the temperature anomaly the more we expect the Walker Circulation to be impacted. But it does not work out that way in all cases for all areas and some think the rate of change of the Nino 3.4 reading is also very important]
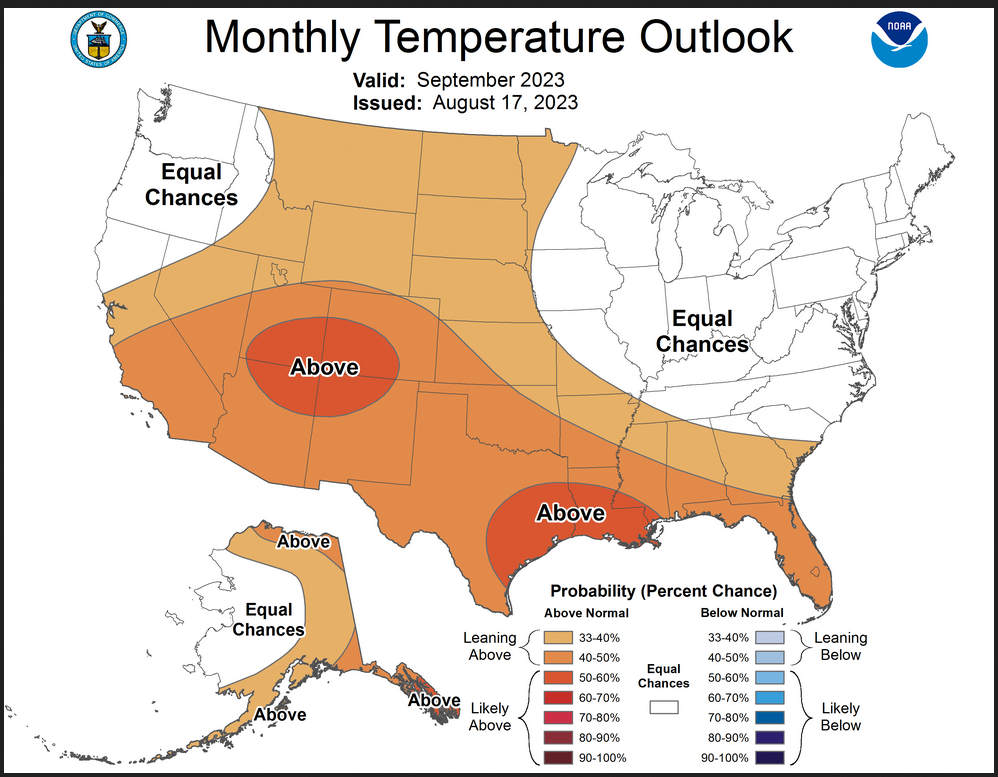
For September:
- Above normal temperatures are favored for most of the western CONUS, consistent with anomalous ridging.
- The strongest probabilities (greater than 50 percent) of above-normal temperatures are indicated near the Four Corners region.
- However, probabilities of warmer than normal conditions are tempered across much of the northwestern CONUS for the weeks 3-4 period, which includes most of the first half of September. [Editors’ Note: Remember this Outlook was issued on August 17 so three to four weeks from then is early September]
- Farther to the south and east, enhanced above-normal temperature probabilities are indicated across the Southern Plains, Lower Mississippi Valley, and parts of the Southeast.
- Equal chances (EC) of above, near, and below normal temperatures are indicated for the remainder of the eastern CONUS.
- Above-normal temperatures are favored for southern, eastern, and northern Alaska.
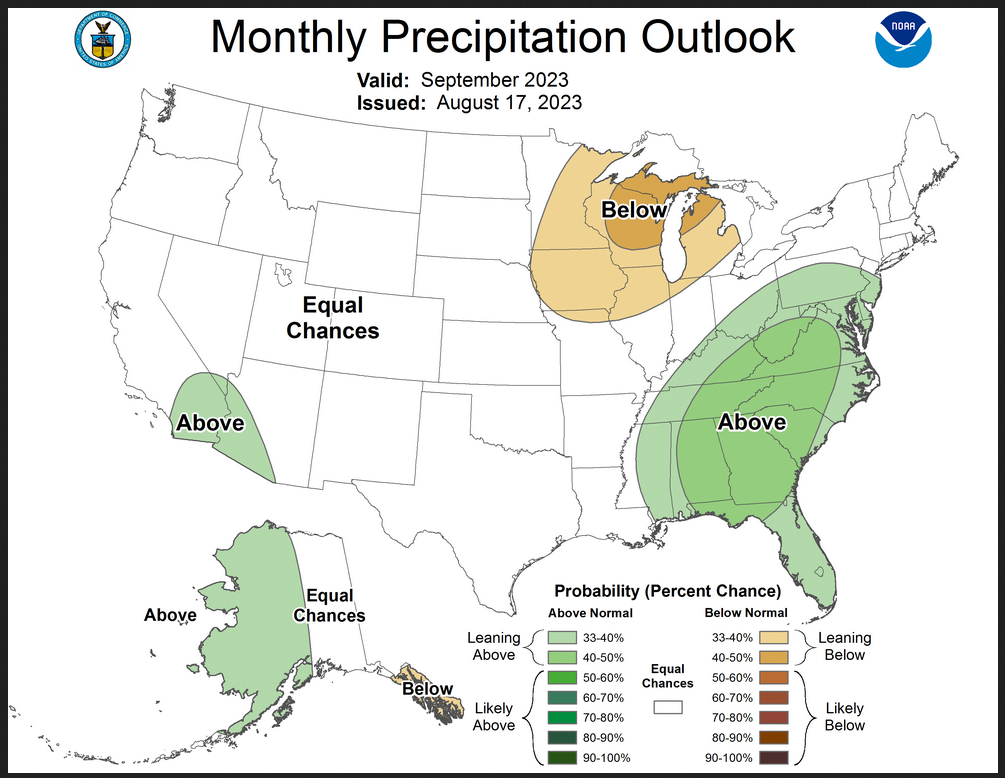
- Above-normal precipitation is favored across the Southeast northward to the Mid-Atlantic and westward to parts of the Tennessee and Ohio Valleys
- Conversely, below-normal precipitation is favored farther to the north and west for the western Great Lakes and Upper Mississippi Valley
- Latest weeks 3-4 guidance from the ECMWF and GEFS depict a wet signal across the Baja Peninsula and the Gulf of California, suggestive of potential tropical cyclone (TC) activity. This potential TC activity leads to a slight tilt toward above-normal precipitation for parts of the southwestern CONUS.
- Farther to the north, above-normal precipitation is favored for western Alaska
- A weak tilt toward below-normal precipitation is indicated for Southeast Alaska due to weeks 3-4 guidance
For SON 2023
- Above-normal temperatures are favored across Alaska and the western CONUS in the SON and OND 2024 temperature outlooks.
- The greatest probabilities exceed 50 percent for northern Alaska and parts of the Southwest, due to decadal trends.
- Above-normal temperatures are also favored eastward across the southern Contiguous United States (CONUS) into the Southeast and northward through the eastern CONUS into the eastern Great Lakes region, consistent with the consolidation of tools.
- Decadal trends lead to higher probabilities of above-normal temperatures over the Northeast.
- Potential El Niño impacts for the SON and OND seasons include cooler temperatures over much of the central CONUS, leading to weaker probabilities for above-normal temperatures
- During SON 2023, above-normal precipitation is favored for western and northern Alaska and the southeastern CONUS,
- Below-normal precipitation is favored for the Pacific Northwest, a small area of the Southwest, and the western Great Lakes region.
- Enhanced probabilities of above-normal precipitation for parts of Alaska are supported by dynamical and statistical tools.
- Below-normal precipitation for the Pacific Northwest and Great Lakes and above-normal precipitation for the Southeast are consistent with El Niño impacts, and largely persist through the next several leads.
- Below-normal precipitation for parts of the Southwest in the SON season is consistent with the persistence of a weaker-than-normal Southwest monsoon, while the outlook for the month of September favors above-normal precipitation in areas of southern California, Nevada and Arizona to the west due to shorter-term moisture flow from the East Pacific.
Beyond SON 2023:
- From the NDJ 2023-24 to the FMA 2024 seasons, as the leads extend through autumn into winter, increasing probabilities of above-normal temperatures are forecast from the Pacific Northwest across the northern tier of the CONUS into the Midwest and Northeast, consistent with increasing impacts of a strengthening El Niño.
- Equal chances of above, near, and below normal temperatures (EC) is forecast across the southern tier of the CONUS with a tendency towards cooler temperatures arising from El Niño impacts.
- For MAM 2024 and longer leads through SON 2024, the outlooks relied heavily on the ENSO-OCN tool, and decadal trends provide most of the available climate signals.
- The seasonal temperature outlooks evolve toward a similar pattern at the longest leads (MAM 2024 through SON 2024), and the forecasts generally depict a u-shaped pattern of enhanced probabilities of above-normal temperatures over the CONUS, and EC in the northern central CONUS into the central Mississippi valley.
- Below-normal precipitation is forecast across much of the northern tier of the CONUS from parts of the Pacific Northwest to the Great Lakes region from NDJ 2023-24 to FMA 2024, due to the expected strengthening El Niño.
- The enhanced probabilities of above-normal precipitation for the Southeast increase and extend westward incrementally across the Southern Plains into the Southwest for these leads, also consistent with a strengthening El Niño.
- For the MAM 2024 season and longer leads, areas of above- and below-normal precipitation coincide with signals due to decadal trends, including enhanced probabilities for below-normal precipitation in areas of the northwestern CONUS and enhanced probabilities for above-normal precipitation in the lower Mississippi Valley and Mid-Atlantic region.

Let’s Take Another Look at the Mid-Month Outlook for September.
Combination Mid-Month Outlook for next month (September) and the Three-Month Outlook
The top row is what is now called the Mid-Month Outlook for next month which will be updated at the end of this month. There is a temperature map and a precipitation map. The second row is a three-month outlook that includes next month. I think the outlook maps are self-explanatory. What is important to remember is that they show deviations from the current definition of normal which is the period 1991 through 2020. So this is not a forecast of the absolute value of temperature or precipitation but the change from what is defined as normal or to use the technical term “climatology”.
| Notice that the outlook for next month and the three-month outlooks are somewhat different with respect to temperature. This always raises the question of what will month two and month three look like. |
| For both temperature and precipitation, if you assume the colors in the maps are assigned correctly, it is a simple algebra equation to solve the month two/three anomaly probability for a given location = (3XThree-Month Probability – Month One Probability)/2*. So you can derive the month two/three outlook this way. You can do that calculation easily for where you live or for the entire map. |
| The current weather report is always available at econcurrents.com To return to this article, hit the return arrow in the upper left-hand corner of your screen. |
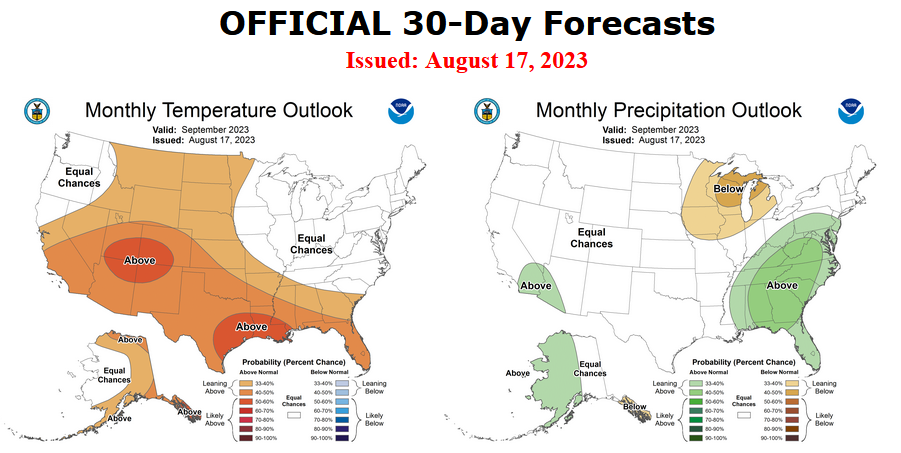
Here are larger versions of the Temperature and Precipitation Outlook maps for next month.
The maps are pretty clear in terms of the outlook.
And here are large versions of the three-month JAS 2023 Outlook
First temperature followed by precipitation.
| These maps are larger versions of what was shown earlier. The JAS precipitation pattern is classic for a weak Southwest Monsoon. The drivers of a weak Monson or delayed Monsoon at least early on benefit the area shown in the Great Plains as wetter than normal. The reverse tends to happen with a strong Southwest Monsoon. |
Drought Outlook
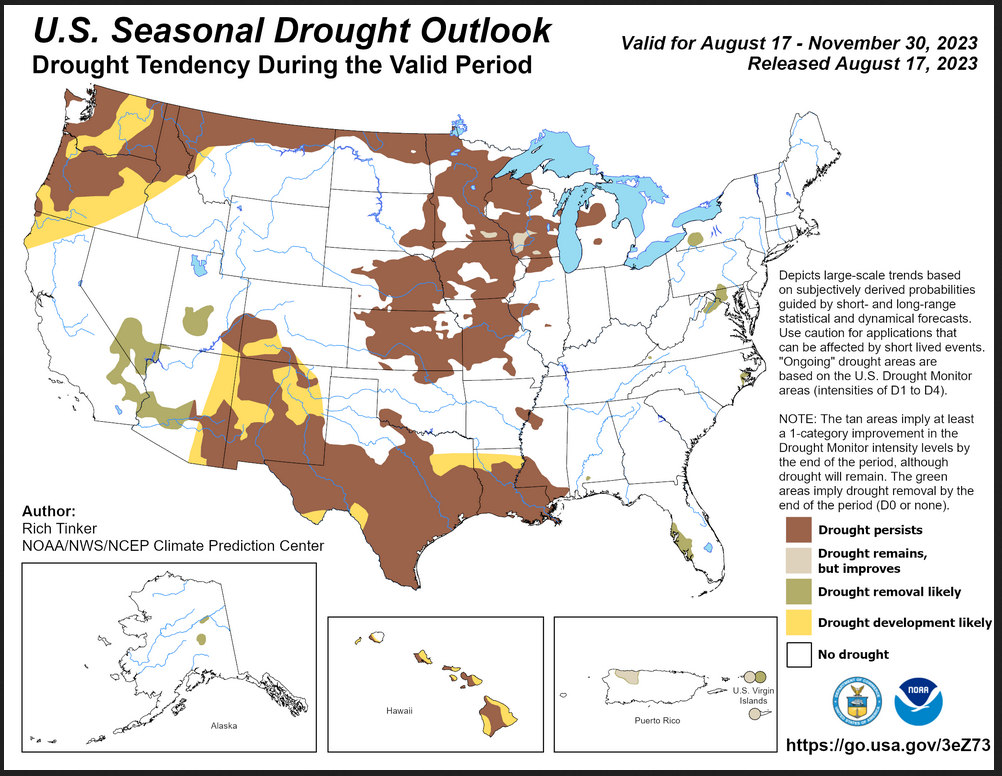
| The yellow is the bad news. There is a larger area where drought development is likely than the area where drought removal is likely plus there is a large area where drought is expected to persist. |
Short CPC Drought Discussion
Latest Seasonal Assessment – There was a distinctive pattern to the changes in the Drought Monitor over the past four weeks. Broadscale improvement was noted across affected areas in the Northeast, the Mid-Atlantic Region, the Middle Mississippi Valley, the central Plains, and most of the Great Lakes. Dramatic Improvements by up to 3 categories were noted in some areas near the Mississippi/Ohio Rivers’ confluence and near the Great Lakes Region. Meanwhile, similar broadscale deterioration occurred from the Upper Mississippi Valley westward into the Pacific Northwest, and along the southern tier of states from the Desert Southwest eastward through the Lower Mississippi Valley. A few areas in northwestern New Mexico and the central and southern portions of Texas saw severe intensification by up to 3 Drought Monitor categories. Excessive heat made a significant contribution to the current drought conditions along the southern tier of states, and to a lesser extent the Pacific Northwest. The southern Plains and Lower Mississippi Valley felt the worst of the heat, and Excessive Heat Warnings were frequent during the past month, especially along the central and western Gulf Coast Region. Lakefront Airport in New Orleans reported heat indexes topping 115F every day during August 5-15, topping out at 124F late afternoon on the 15th. For 69 hours, from 7:15 CDT August 7 through 3:45 CDT August 10, the heat index remained at or above 100F. Drought intensification was also observed in Hawaii, contributing to fatal wildfires that scorched parts of Maui.A surge of tropical moisture – partially fueled by Tropical Storm Hilary – is expected to push into the Southwest, from the southeastern California deserts to eastern Arizona. This should bring some relief from dryness that has developed during the hot and drier-than-normal Southwest Monsoon. The dwindling patches of drought from the Appalachians to the Atlantic Coast are also expected to ease, along with the areas of drought currently affecting the Virgin Islands, Puerto Rico, and Alaska. For the rest of the country, not much relief is expected outside the most severely affected areas in extreme [D3] drought across the Upper Midwest. Heat and a lackluster Monsoon should keep drought intact along the southern tier of the country from the Southern Rockies through the central Gulf Coast Region, with some development expected in parts of the Four Corners Region, across central and northeastern Texas, and in northern Louisiana. Drought is also expected to persist and locally worsen from the Upper Mississippi Valley westward through the Pacific Northwest, with some expansion in the latter region, where the wet season beginning in late October is expected to get off to a slow start. Also, drought is expected to persist and develop across Hawaii, with all but central and eastern Kauai expected to be in moderate drought [D1 or worse] by the end of autumn.
Looking out Four Seasons.
Twelve Temperature Maps. These are overlapping three-month maps (larger versions of these and other maps can be accessed HERE)
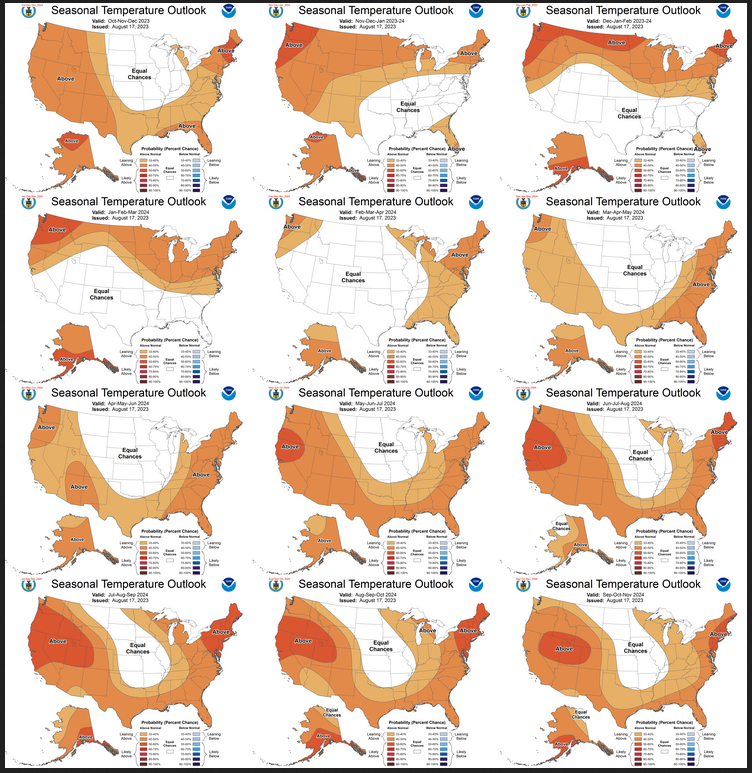
Notice that this presentation starts with October/November/December 2023 (OND) since SON is considered the near-term and is covered earlier in the presentation. The changes over time are generally discussed in the discussion but you can see the changes easier in the maps.
Comparing the new outlook with the prior Outlook,
The 12 temperature maps issued last month.
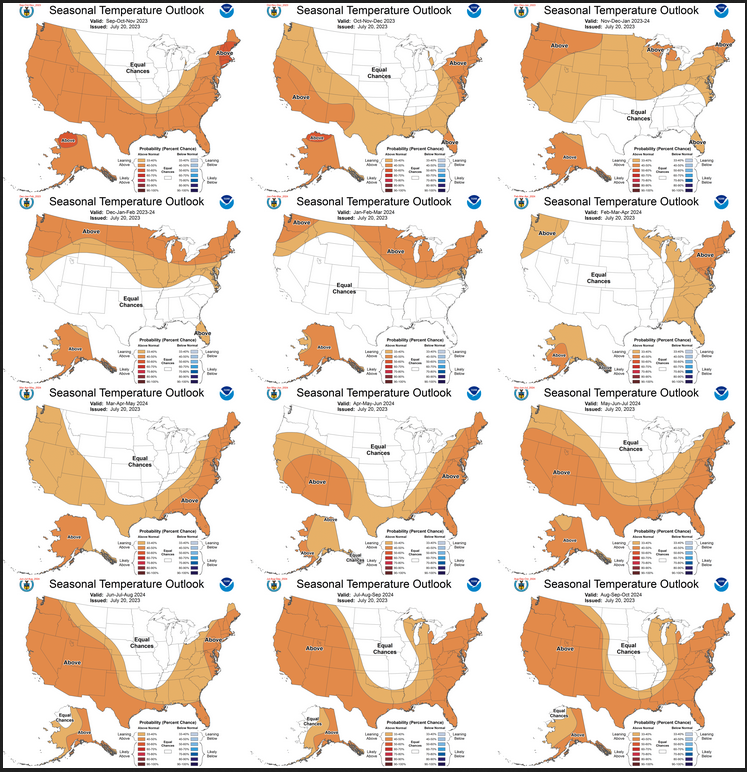
The easiest way to do the comparison is to print out both maps. If you have a color printer that is great but not needed. What I do is number the images from last month 1 – 12 starting with “1” and going left to right and then dropping down one row. Then for the new set of images, I number them 2 – 13. That is because one image from last month in the upper left is now discarded and a new image on the lower right is added. Once you get used to it, it is not difficult. In theory, the changes are discussed in the NOAA discussion but I usually find more changes. It is not necessarily important. I try to identify the changes but believe it would make this article overly long to enumerate them. The information is here for anyone who wishes to examine the changes. I comment below on some of the changes from the prior report by NOAA and important changes over time in the pattern.
| Basically, there are no significant changes from last month’s set of maps. |
Now the Twelve New Precipitation Maps
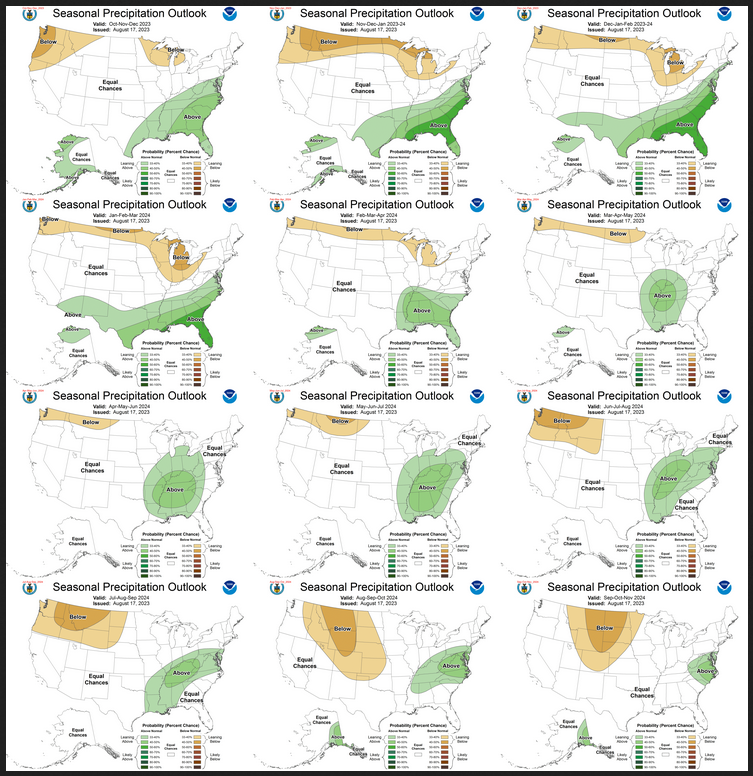
Similar to Temperature in terms of the organization of the twelve overlapping three-month outlooks.
Comparing the new outlook with the prior Outlook,
The maps that were released last month.
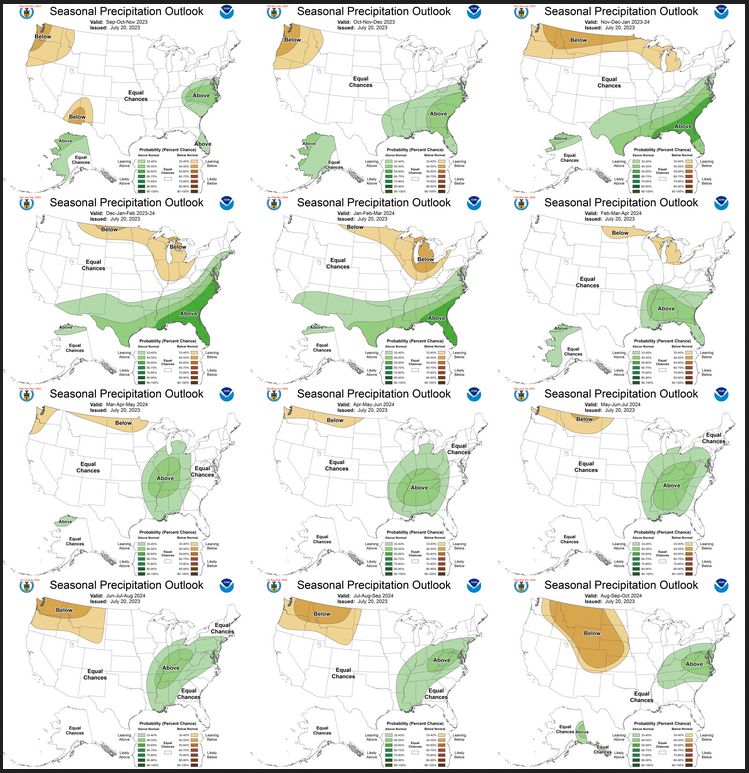
A good approach for doing this comparison is provided with the temperature discussion.
| There were basically no significant changes from last month’s set of maps. |
NOAA Discussion
Maps tell a story but to really understand what is going you need to read the discussion. I combine the 30-day discussion with the long-term discussion and rearrange it a bit and add a few additional titles (where they are not all caps the titles are my additions). Readers may also wish to take a look at the article we published last week on the NOAA ENSO forecast. That can be accessed here.
I will use bold type to highlight some things that are especially important. My comments, if any, are enclosed in brackets [ ].
CURRENT ATMOSPHERIC AND OCEANIC CONDITIONS
Oceanic and atmospheric observations across the equatorial Pacific reflect continuing El Niño conditions. The latest observed weekly SSTs indicate positive anomalies across the equatorial Pacific with anomalies exceeding +1 degree C near and east of the Date Line and exceeding +2 degrees C in the East Pacific. Equatorial upper-ocean heat anomalies (averaged between 180 to 100 °W and 0-300m depth) remain strongly positive but have shown some recent weakening at depths of more than 100 meters in the east-central Pacific. Outgoing longwave radiation (OLR) anomalies are negative near the Date Line, indicating enhanced convective precipitation, consistent with El Niño conditions. Low-level wind anomalies at the 850-hPa level were westerly over the western equatorial Pacific and easterly over the eastern Pacific, while upper-level wind anomalies at the 200-hPa level were westerly over the eastern tropical Pacific.
Strongly positive SST anomalies are present near the northern coast of Alaska. SST anomalies remain strongly positive along the Gulf Coast and the Southeast Atlantic coast as well, while positive SST anomalies near the Northeast Atlantic coast have decreased in the last two weeks.
PROGNOSTIC DISCUSSION OF SST FORECASTS
The CPC SST Consolidation for the Niño 3.4 region indicates an increase in the magnitude of positive anomalies through autumn into early winter, with a peak median anomaly exceeding +1 degree C through the DJF winter season. The median North American Multi-Model Ensemble (NMME) consolidation forecast exceeds +1.5 degrees C at its peak in late autumn and early winter before decreasing at longer leads with greater uncertainty. The CPC consensus ENSO outlook indicates greater than a 90 percent chance that El Niño will continue through winter, with greater than a 60 percent chance that the strength of the Niño 3.4 anomaly will exceed +1.5 degrees C at its peak.
30-DAY OUTLOOK DISCUSSION FOR SEPTEMBER 2023
The September 2023 outlooks are issued against the backdrop of an ongoing El Niño signal. The latest Niño 3.4 weekly sea surface temperature (SST) departures stood at +1.2 degrees Celsius and positive subsurface temperature anomalies dominate the equatorial Pacific Ocean. Meanwhile, the magnitude of the Real-time Multivariate (RMM) based Madden Julian Oscillation (MJO) index has strengthened during early August, with the amplitude of the signal rising above the RMM unit circle. However, there is little evidence of eastward propagation at this time which is reflective of disorganized intraseasonal activity. The MJO is generally favored to weaken during the next several weeks with a possible re-emergence later in August over the western Pacific or western Hemisphere. Farther to the north, across the extratropics of the Northern Hemisphere, both the Arctic Oscillation (AO) and the North Atlantic Oscillation (NAO) have generally been negative during early August while the Pacific North America (PNA) index has exhibited a positive signal in recent days. Combined natural analog composites derived from the recent evolution of equatorial Pacific, MJO, and extratropical indices depict a 500-hPa flow pattern dominated by below normal heights across the Bering Sea and western Alaska as well as over the northeastern Pacific off the coasts of Southeast Alaska and the Pacific Northwest. Anomalous ridging is generally favored across the western and north-central Contiguous United States (CONUS). Farther to the east, natural analog composites depict near normal heights across the Southern Plains, Southeast, and northward to much of the Great Lakes and Northeast. Meanwhile, trends during the last 15 years favor above normal heights across most of the western and northern two-thirds of the CONUS as well as the Aleutians and parts of eastern mainland Alaska during the month of September, with the strongest positive anomalies over the north-central CONUS. Natural analog composites, trends , and dynamical guidance from the Copernicus Climate Change Service (C3S), North American Multi-Model Ensemble (NMME), the Couple Forecast System Version 2 (CFSv2), and the Forecast Consolidation Tool (CON) (which includes both dynamical model input and statistical guidance) form the basis of the September outlooks. The latest CPC Weeks 3-4 Outlooks and associated ensemble guidance from the European Centre for Medium Range Weather Forecasts (ECMWF), Global Ensemble Forecast System (GEFS), and the CFS also contributed. Antecedent conditions such as extratropical SSTs, sea ice extent, and soil moisture conditions were also considered where appropriate.
Temperature
Above normal temperatures are favored for most of the western CONUS, consistent with anomalous ridging. The strongest probabilities (greater than 50 percent) of above normal temperatures are indicated near the Four Corners region, where dynamical and statistical guidance show the strongest agreement. However, probabilities of warmer than normal conditions are tempered across much of the northwestern CONUS, due to cold signals depicted by the ECMWF and CFS ensembles for the weeks 3-4 period, which includes most of the first half of September. Farther to the south and east, enhanced above normal temperature probabilities are indicated across the Southern Plains, Lower Mississippi Valley, and parts of the Southeast, due to good agreement among dynamical model guidance. Probabilities of above normal temperatures exceed 50 percent for parts of the Gulf Coast region, where SSTs in adjacent waters are much warmer than normal. Equal chances (EC) of above, near, and below normal temperatures are indicated for the remainder of the eastern CONUS due to weak signals exhibited by NMME and CFSv2 output as well as due to conflicting statistical guidance. Above normal temperatures are favored for southern, eastern, and northern Alaska, consistent with the consensus of dynamical model guidance. Above normal SSTs also contributed to increased above normal temperature probabilities along the South Coast and North Slope of Alaska. However, EC is indicated for much of western mainland Alaska due to conflicting signals between generally warmer dynamical model guidance and colder natural analogs as well as the presence of below normal SSTs adjacent to southwestern mainland Alaska.
Precipitation
Above normal precipitation is favored across the Southeast northward to the Mid-Atlantic and westward to parts of the Tennessee and Ohio Valleys due to good agreement among the CON, El Niño Southern Oscillation (ENSO)-based natural analogs, and the latest CPC Weeks 3-4 Outlooks. Conversely, below normal precipitation is favored farther to the north and west for the western Great Lakes and Upper Mississippi Valley as the CON, CFSv2, and natural analog composites tilt dry across these regions. Latest weeks 3-4 guidance from the ECMWF and GEFS depict a wet signal across the Baja Peninsula and the Gulf of California, suggestive of potential tropical cyclone (TC) activity. This potential TC activity coupled with a wet signal depicted by the CON leads to a slight tilt toward above normal precipitation for parts of the southwestern CONUS. Farther to the north, above normal precipitation is favored for western Alaska due to good agreement between NMME and CON guidance. A weak tilt toward below normal precipitation is indicated for Southeast Alaska due to monthly guidance from the CON, CFSv2, and weeks 3-4 guidance from the ECMWF and GEFS.
SUMMARY OF THE OUTLOOK FOR NON-TECHNICAL USERS (focus on September, October and November)
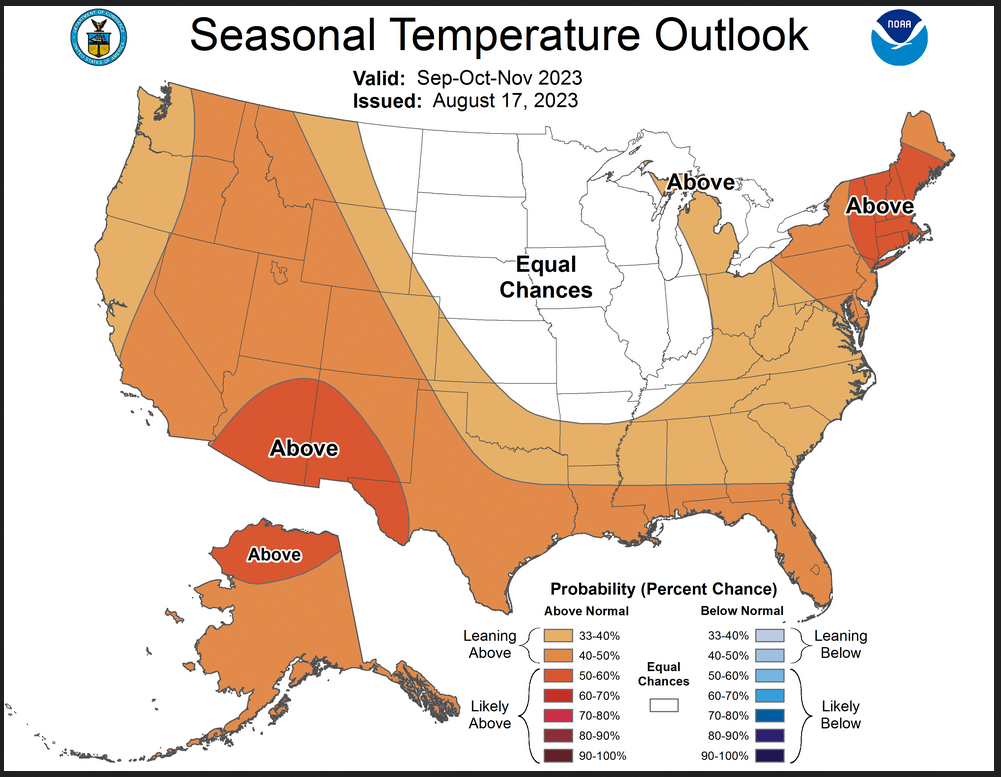
Temperature
The September-October-November (SON) 2023 temperature outlook favors above-normal seasonal mean temperatures across a majority of the U.S., including all of Alaska, the western CONUS, the Southeast, and the Northeast. The highest probabilities for above-normal temperatures exceed 50 percent for parts of northern Alaska, the Southwest, and the Northeast.
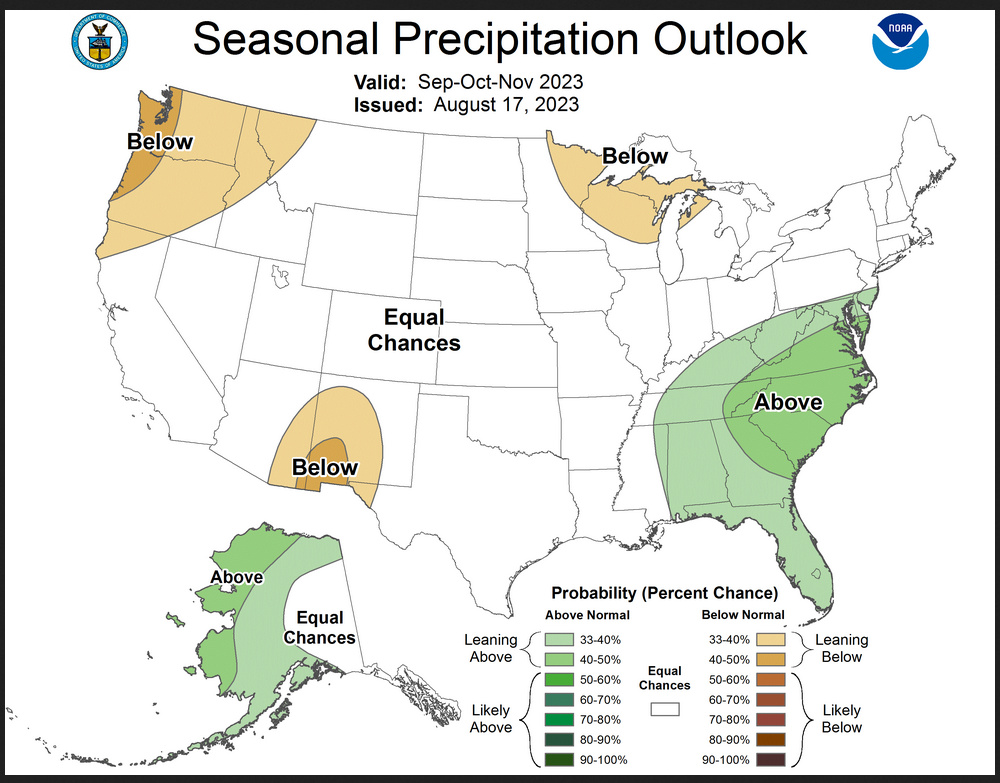
Precipitation
The SON precipitation outlook favors above-normal precipitation for western and northern Alaska and a large area of the southeastern CONUS from Florida to parts of the Mid-Atlantic region. Below-normal precipitation is favored for the Pacific Northwest, the western Great Lakes region, and a small area of the Southwest, including southeastern Arizona, western New Mexico, and a small part of West Texas.
ENSO
El Niño conditions are present and equatorial sea surface temperatures (SSTs) are above average across the central and eastern equatorial Pacific Ocean. El Niño is expected to strengthen and persist through the winter of 2023-24.
BASIS AND SUMMARY OF THE CURRENT LONG-LEAD OUTLOOKS
PROGNOSTIC TOOLS USED FOR U.S. TEMPERATURE AND PRECIPITATION OUTLOOKS
The seasonal outlooks relied on dynamical model guidance from the NMME, including hybrid statistical-dynamical guidance from the Calibration, Bridging, and Merging (CBaM) post-processing of the NMME, and a version of the NMME that post-processes and weights the models using Probability Anomaly Correlation (PAC). Statistical tools are also used, such as Constructed Analog, Canonical Correlation Analysis (CCA), and a regression forecast based on the predicted median Niño 3.4 SST anomaly from the CPC SST forecast consolidation with the addition of Optimum Climate Normals (OCN) to represent decadal trends . A final consolidation tool combines the consolidation of NMME model forecasts with a consolidation of statistical tools.
El Niño temperature and precipitation correlations to surface temperatures and precipitation were relied upon from SON 2023 through FMA 2024. Decadal trends in temperature and precipitation were a factor at all time leads but relied upon the most at the longer leads from MAM 2024 onward, when signals due to El Niño decrease. Current soil moisture conditions were a consideration in the upper Midwest and Southern Plains in the SON temperature outlook.
PROGNOSTIC DISCUSSION OF OUTLOOKS – SON 2023 TO SON 2024
TEMPERATURE
Above-normal temperatures are favored across Alaska and the western CONUS in the SON and OND 2024 temperature outlooks, consistent with dynamical and statistical model guidance and the consolidation of both. The greatest probabilities exceed 50 percent for northern Alaska and parts of the Southwest, due to decadal trends . Above-normal temperatures are also favored eastward across the southern Contiguous United States (CONUS) into the Southeast and northward through the eastern CONUS into the eastern Great Lakes region, consistent with the consolidation of tools. Decadal trends lead to higher probabilities of above-normal temperatures over the Northeast. Potential El Niño impacts for the SON and OND seasons include cooler temperatures over much of the central CONUS, leading to weaker probabilities for above-normal temperatures in tools that explicitly consider ENSO, such as CBaM. A forecast of Equal Chances (EC) of above-, near-, and below-normal temperatures is indicated over this region for the first two leads.
From the NDJ 2023-24 to the FMA 2024 seasons, as the leads extend through autumn into winter, increasing probabilities of above-normal temperatures are forecast from the Pacific Northwest across the northern tier of the CONUS into the Midwest and Northeast, consistent with increasing impacts of a strengthening El Niño. Equal chances of above, near, and below normal temperatures (EC) is forecast across the southern tier of the CONUS with a tendency towards cooler temperatures arising from El Niño impacts. For MAM 2024 and longer leads through SON 2024, the outlooks relied heavily on the ENSO-OCN tool, and decadal trends provide most of the available climate signals . The seasonal temperature outlooks evolve toward a similar pattern at the longest leads (MAM 2024 through SON 2024), and the forecasts generally depict a u-shaped pattern of enhanced probabilities of above-normal temperatures over the CONUS, and EC in the northern central CONUS into the central Mississippi valley.
PRECIPITATION
During SON 2023, above-normal precipitation is favored for western and northern Alaska and the southeastern CONUS, while below-normal precipitation is favored for the Pacific Northwest, a small area of the Southwest, and the western Great Lakes region. Enhanced probabilities of above-normal precipitation for parts of Alaska are supported by the consolidation of dynamical and statistical tools. Below-normal precipitation for the Pacific Northwest and Great Lakes and above-normal precipitation for the Southeast are consistent with El Niño impacts, and largely persist through the next several leads. Below-normal precipitation for parts of the Southwest in the SON season is consistent with the persistence of a weaker than normal Southwest monsoon, while the outlook for the month of September favors above-normal precipitation in areas of southern California, Nevada and Arizona to the west due to shorter term moisture flow from the East Pacific.
Below-normal precipitation is forecast across much of the northern tier of the CONUS from parts of the Pacific Northwest to the Great Lakes region from NDJ 2023-24 to FMA 2024, due to the expected strengthening El Niño. The enhanced probabilities of above-normal precipitation for the Southeast increase and extend westward incrementally across the Southern Plains into the Southwest for these leads, also consistent with a strengthening El Niño. For the MAM 2024 season and longer leads, areas of above- and below-normal precipitation coincide with signals due to decadal trends , including enhanced probabilities for below-normal precipitation in areas of the northwestern CONUS and enhanced probabilities for above-normal precipitation in the lower Mississippi Valley and Mid-Atlantic region.
Review of the ENSO Assumptions utilized by NOAA (CPC) in Preparing this Four-Season OutlookThe key information used by NOAA follows.
IRI CPC ENSO STATE Probability Distribution (IRI stands for the International Research Institute for Climate and Society)
Here are the new forecast probabilities. This information is released twice a month and the first release is based on a survey of Meteorologists, the second is based on model results. The probabilities are for three-month periods e.g. JAS stands for July/August/September. I am just showing the first release which is what we have and presumably what NOAA (actually their CPC Division) worked from.

| It looks like El Nino through the forecast period. It does start to reduce intensity in DJF 2023/2024 but this may simply be the higher level of uncertainty that far out into the future. |
Tropical Subsurface Temperature Anomalies

| You can update this graphic by clicking HERE and scrolling down to “Mean and anomalous equatorial temperatures“. One has to differentiate between the surface and at depth. Last month the surface still fit with ENSO Neutral but below the surface, there was a lot of anomalously warm water. Now the ocean clearly is consistent with El Nino and based on the new NOAA CPC Division Advisory, the atmosphere has confirmed that we are in El Nino. That is why this looks like a very sustainable El Nino. |

| The image will update if you click HERE. This model is predicting a fairly strong El Nino lasting a while. |
Resources
–
| I hope you found this article interesting and useful. |
–