This is a continuation of the analysis of each significant period of rising inflation since 1914. The first part1 covered the years up to the start of World War II. The second part2 covered the inflationary periods following World War II through 2022. This is an addendum to the second part.

From a photo by Colton Sturgeon on Unsplash
Introduction
It was discovered after the fact that a period of significant inflation was omitted in the previous work.2 This post adds that four-year period from 1987 to 1990.
The conclusion of the previous work was that, even with disaggregation of the data using broad descriptors, no clear hypotheses about time variation of the associations between deficit spending and consumer inflation could be proposed. The conclusion was that it would be necessary to characterize each of the individual periods with significant inflation increases or decreases to determine what (if any) time variation patterns of the correlations between deficit spending and consumer inflation existed over the 109 years.
Data
Previously,3 we sorted the 109 years from 1914-2022 into three groups.
The corrected list is now:
- Years belonging to periods in which inflation increased by at least 4% without any pullback exceeding 1.5%. (11 periods, 38 years)
- Years belonging to periods in which inflation decreased by at least 4% without any pullback exceeding 1.5%. (11 periods, 37 years)
- The remaining years are not part of a period with significant inflation changes. (34 years)
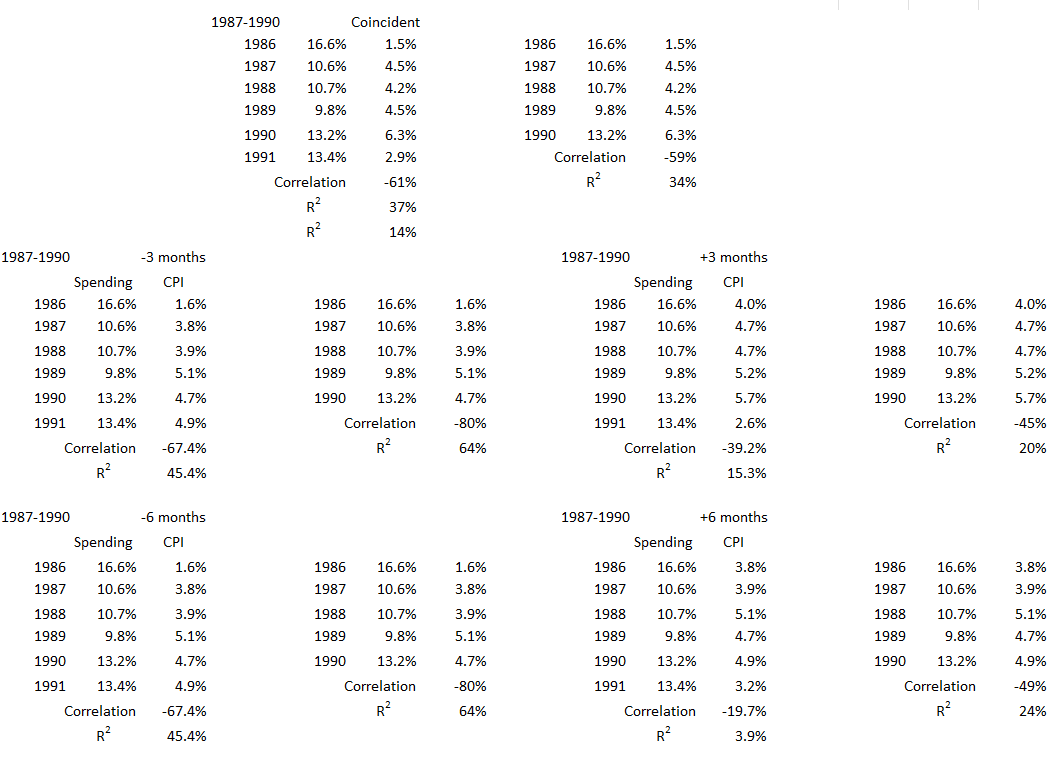
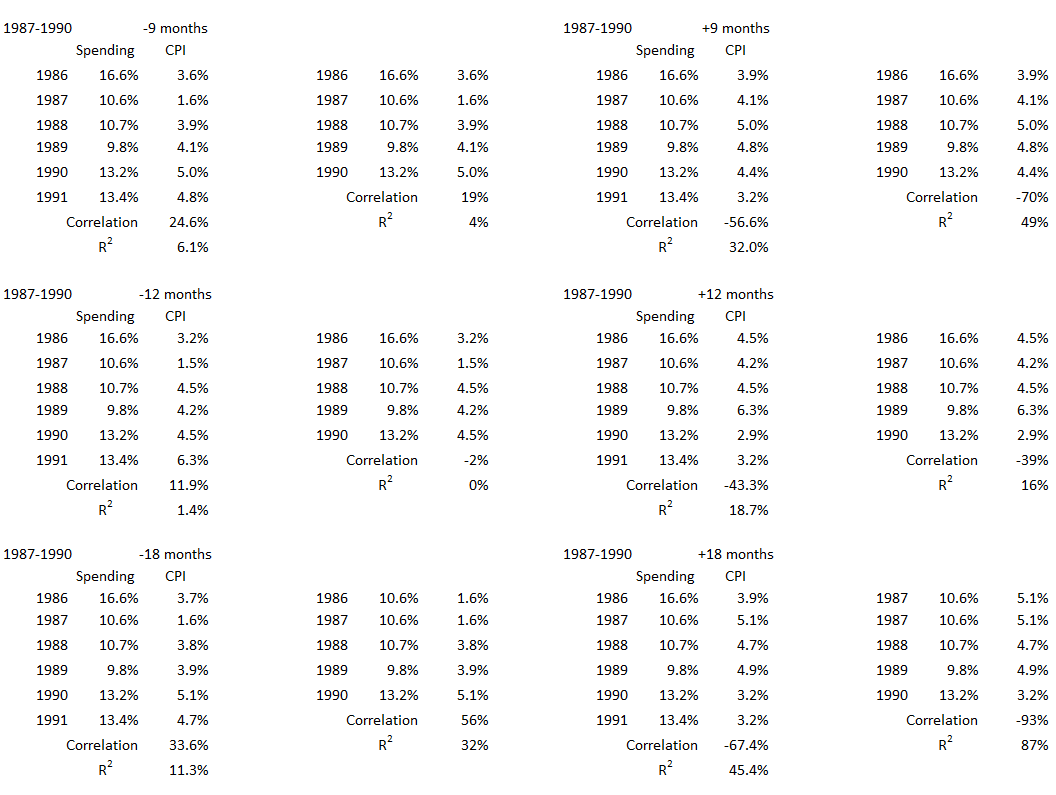
The data used in the analysis presented here is the same that has been used previously:1 The time series and correlations for the two data sets coincident for each federal fiscal year as well as inflation offsets by ±3, ±6, ±9, ±12, ±18, and ±24 month amounts with respect to the fiscal years. The thirteen data tables are shown in Part 13A, Appendix 1.2
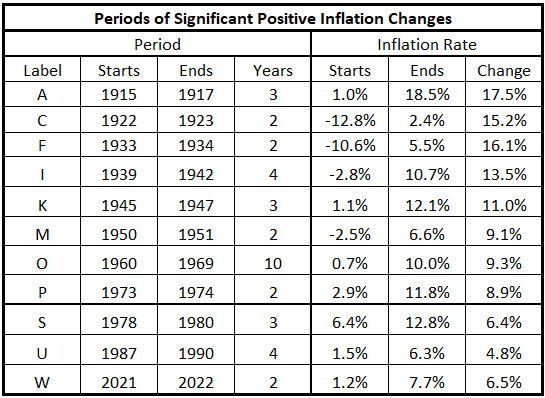
The periods of significant increases in inflation are given in Table 1, corrected from what was posted previously.1
Table 1. Periods of Significant Increases of Inflation 1914-2022
Analysis
1987-1990
Figure 1. U.S. Federal Deficit Spending and Inflation for the Fiscal Years 1986-1991
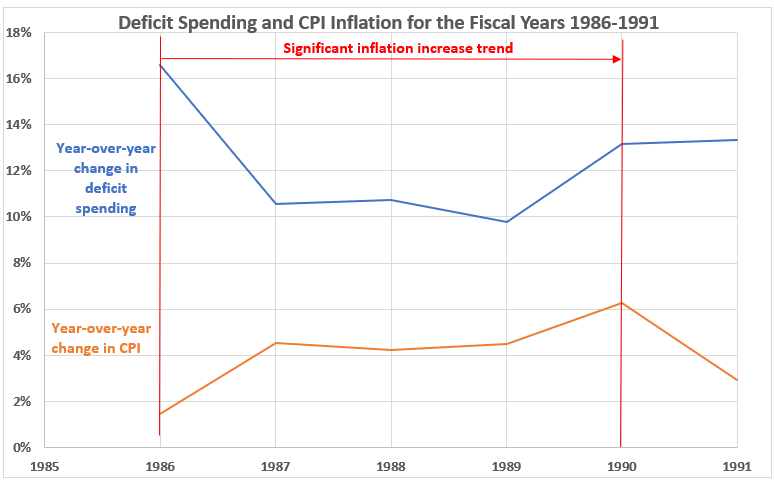
There is a positive correlation only for the final year (1990) of this inflation surge.
Figure 2. Annual Changes in Deficit Spending vs. Inflation for the Fiscal Years 1986-1991
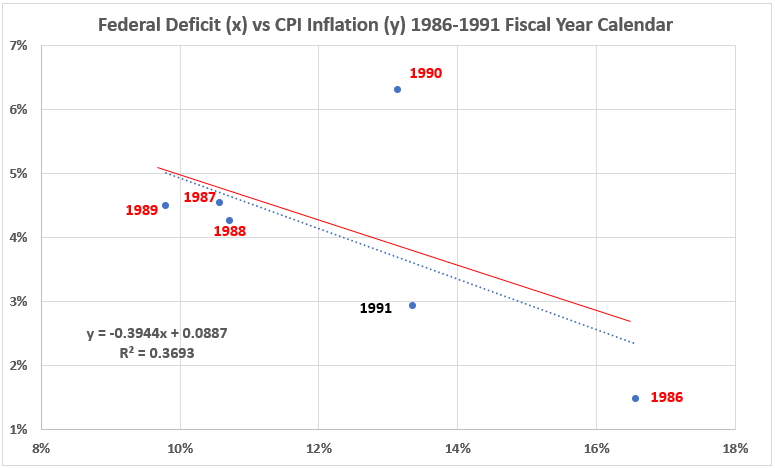
Consistent with the observation made for Figure 1, above, the year 1990 is obviously different than the other three years in the surge. The year 1986 is also different. That year is the final year of a significant deflationary trend (1981-1986) and is included in this data set because it defines the starting data point for the year 1987. (Remember, the data for a year in the December 31 data which is the same as the January 1 data for the following year.) The R2 value is defined by R = –59%.
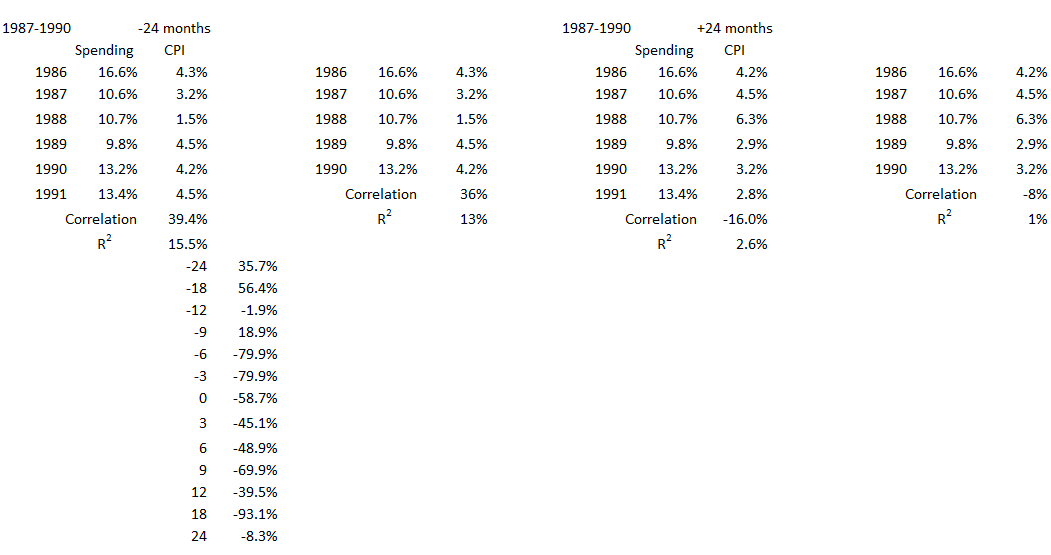
Figure 3. Correlation Between Deficit Spending and Inflation 1987-1990
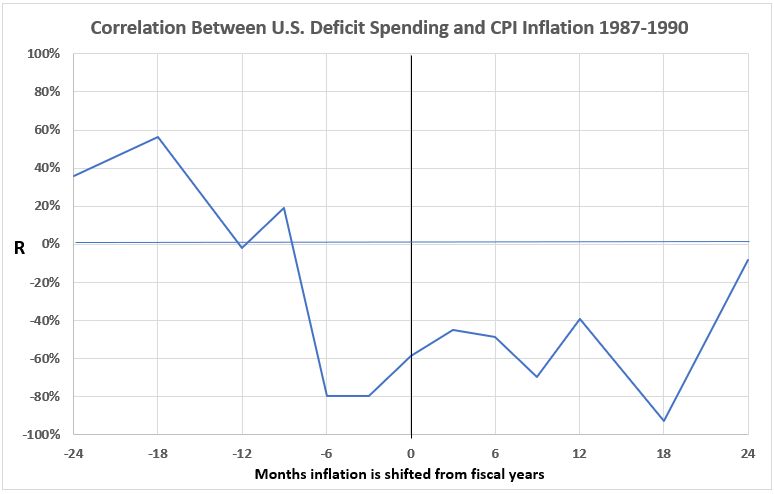
Except for inflation leading deficit spending by 18 and 24 months, there is little to no association between the two variables in this time period.
Conclusion
For the purposes of the analysis above, the following definitions regarding correlations were made.
Table 2. Definitions Regarding Correlations

Using the classifications in Table 2, the analysis results here and in Part 13A are summarized in Table 3. This table is a correction of the table published previously2 with the addition of the U time period (1987-1990).
Table 3. Correlations for Inflationary Surges and Federal Deficits 1914-2022
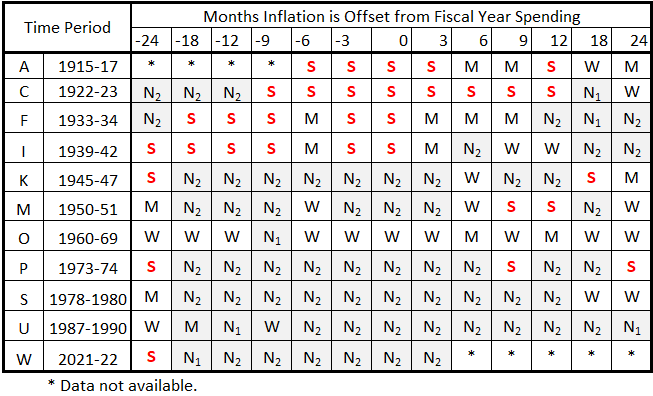
The additional time period does not change the previous conclusions.2 This has added another inflationary time period showing a limited association between federal government deficit spending and consumer inflation.
Next week we hope to finish the conclusion of this series with “Government Spending and Inflation: Reprise and Summary.”
Appendix
Here we show all data selections from the tables in Part 13A, Appendix 11 for the analysis of this significant inflation period.
1987-1990
Footnotes
1. Lounsbury, John, “Government Spending and Inflation. Part 13A”, EconCurrents, June 4, 2023. https://econcurrents.com/2023/06/04/government-spending-and-inflation-part-13a/
2. Lounsbury, John, “Government Spending and Inflation. Part 13B”, EconCurrents, June 25, 2023. https://econcurrents.com/2023/06/25/government-spending-and-inflation-part-13b/
3. Lounsbury, John, “Government Spending and Inflation. Part 11”, EconCurrents, May 7, 2023, Tables 15 and 16.
https://econcurrents.com/2023/05/07/government-spending-and-inflation-part-11/.