This is the second of two posts to analyze the eleven significant deflationary periods for the years 1914-2022. The first post was Part 14A.1

From image by Nicolae Baltatescu from Pixabay
Introduction
In Part A, the first six significant deflationary periods were analyzed. This brought us to and included the World War II years. The five remaining significant periods are covered in this post. For more information about the definition and determination of significant deflationary periods, see Part A.1
Data
The data used in the analysis presented here is the same that has been used previously. The time series and correlations for the two data sets coincident for each federal fiscal year as well as inflation offsets by ±3, ±6, ±9, ±12, ±18, and ±24 month amounts with respect to the fiscal years. The thirteen data tables are shown in Part 13A, Appendix 1.2
The periods of significant increases in inflation are given in Table 1, corrected from what was posted previously.3
Table 1. Periods of Significant Decreases of Inflation 1914-2022

Analysis
1948-1949
This period includes a recession from November 1948 to October 1949. Nine months after the end of the recession, the U.S. involvement started in the conflict in Korea that became the Korean War.
Figure 1. U.S. Federal Deficit Spending and Inflation for the Fiscal Years 1946-1951
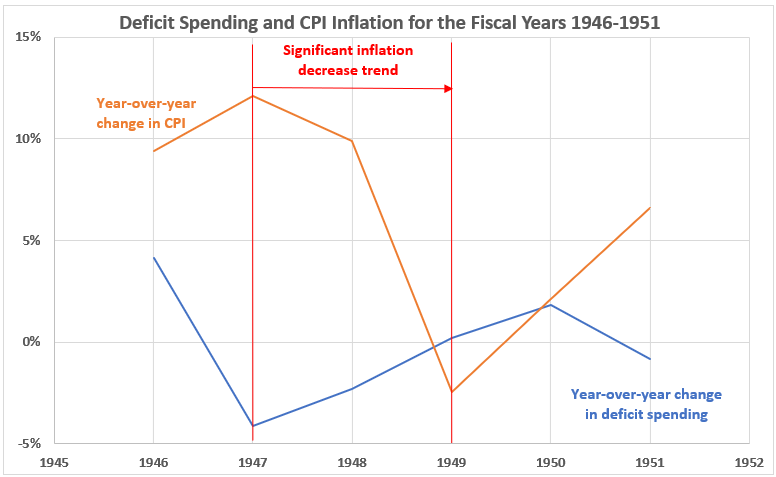
Deficit spending and inflation move in opposite directions every year except for 1950. Stated differently, deflation (disinflation) is gaining as deficit spending increases in five of the six years shown.
Figure 2. Annual Changes in Deficit Spending vs. Inflation for the Fiscal Years 1946-1951
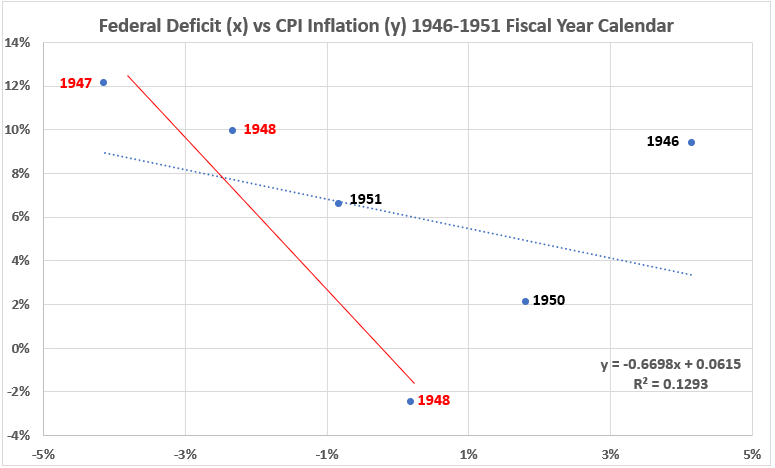
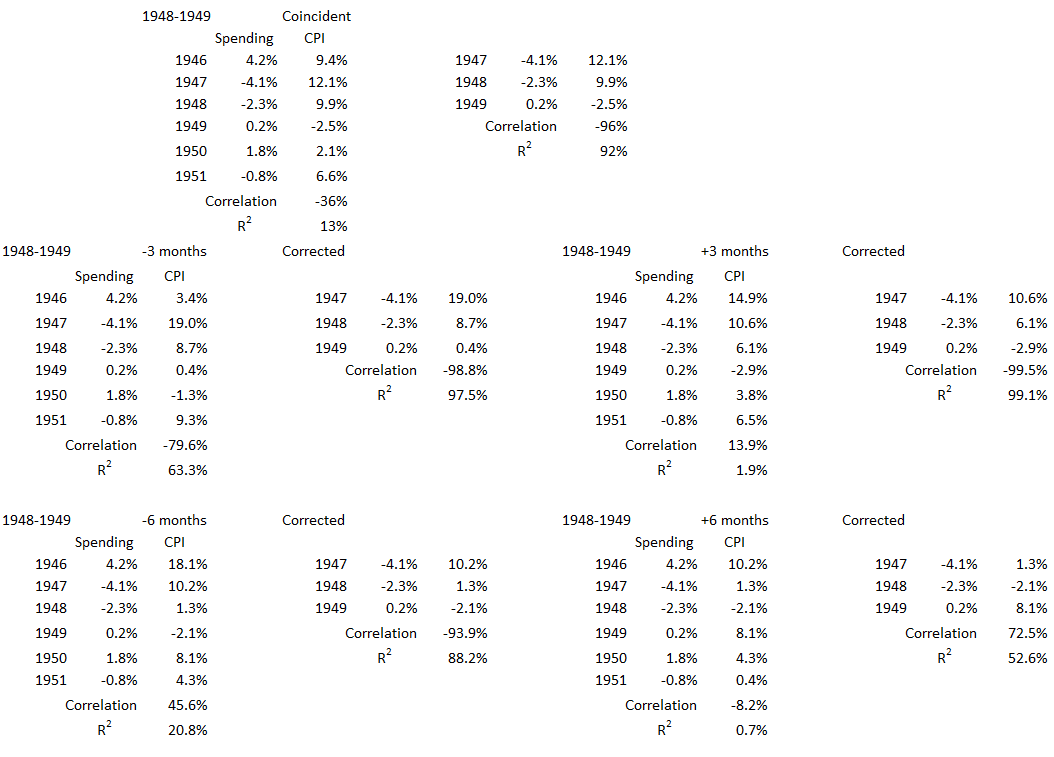
The correlation between inflation and deficit spending is negative for all six years (R = –36%, R2 = 13%) and for the two surge years (R = –96%, R2 = 92%). This indicates that decreasing inflation (deflation) has no association with declining deficit spending in these years.
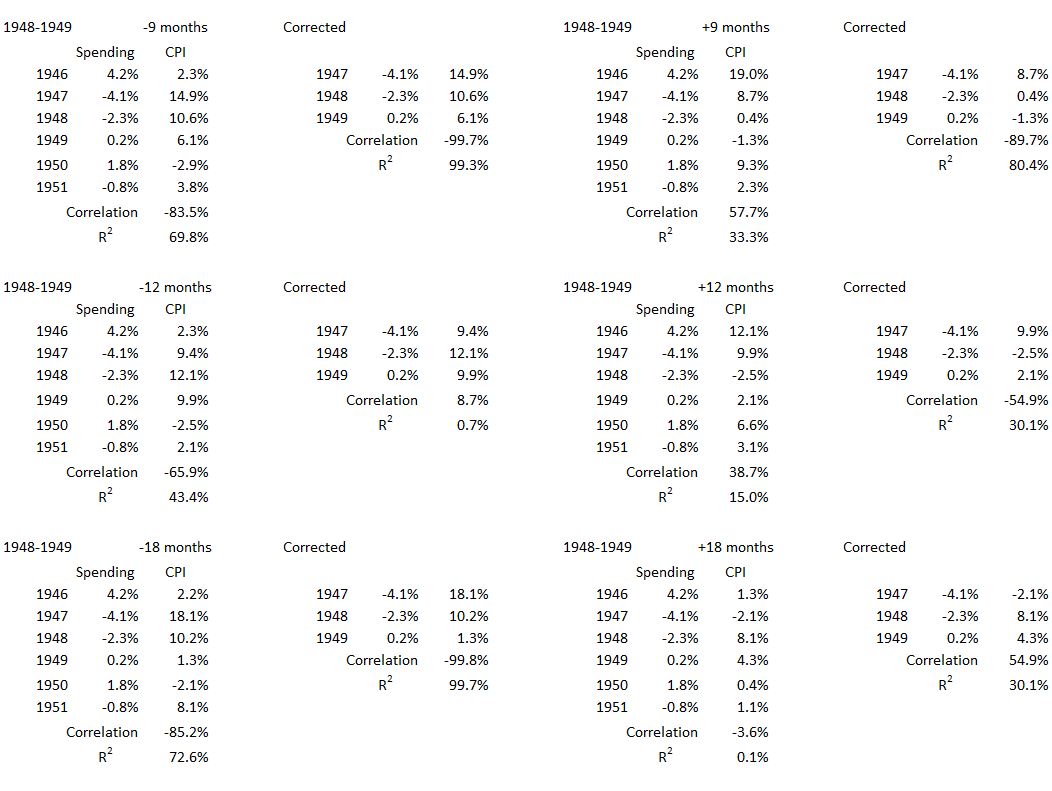
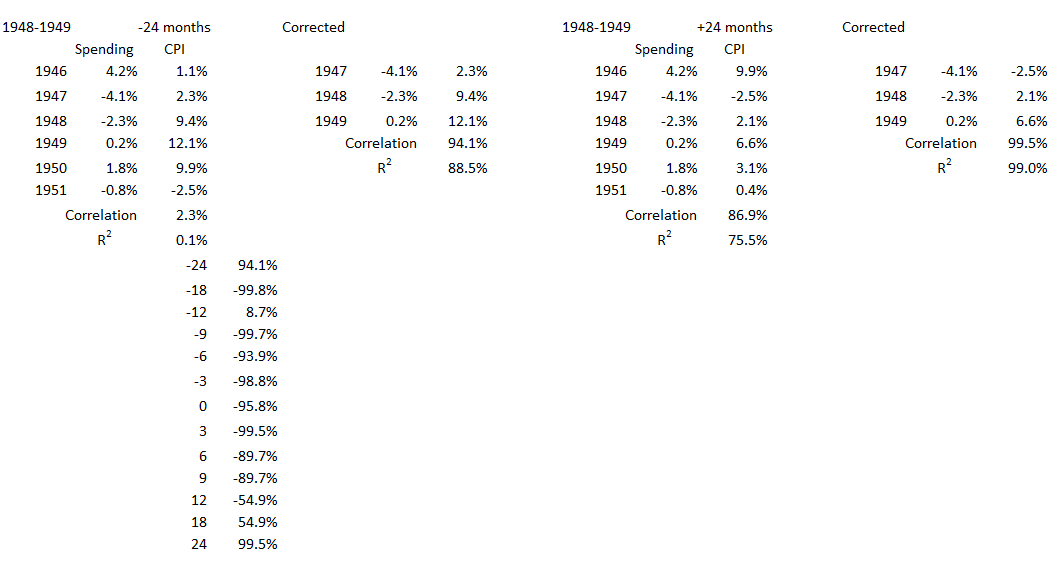
Figure 3. Correlation Between Deficit Spending and Inflation 1948-1949
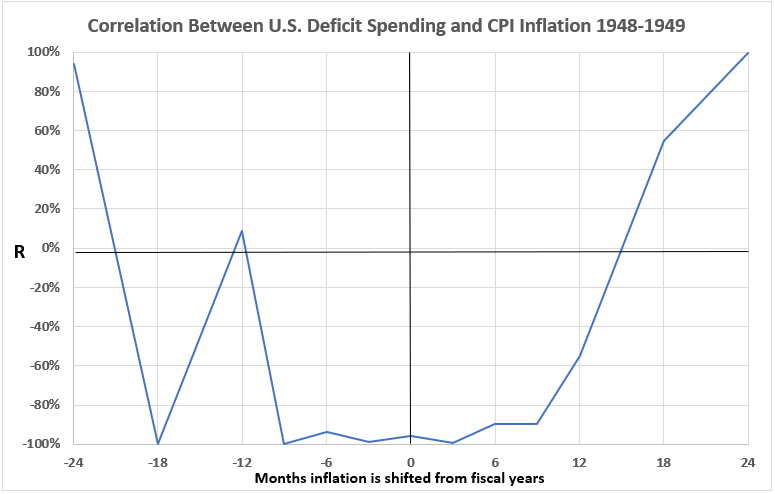
There is no indication of any association between decreasing deficit spending and deflation in this data for the deflationary surge in the years 1948 and 1949. The alignment shifts of -24, +18, and +24 show association, but that requires some careful justification if cause and effect are to be considered. It is clear the deflationary trend during this surge comes from some other sources than government spending.
1952-1955
This time period includes the latter portion of the Korean War (June 1950 to September 1953). It also includes another recession from July 1953 to May 1954.
Figure 4. U.S. Federal Deficit Spending and Inflation for the Fiscal Years 1951-1956
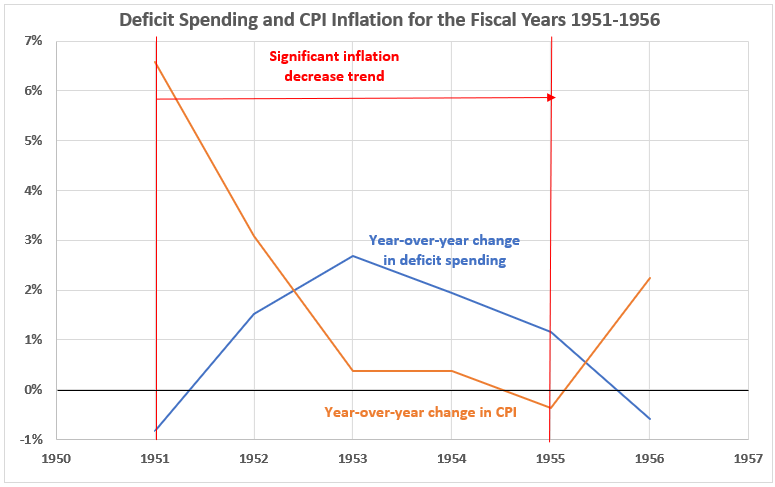
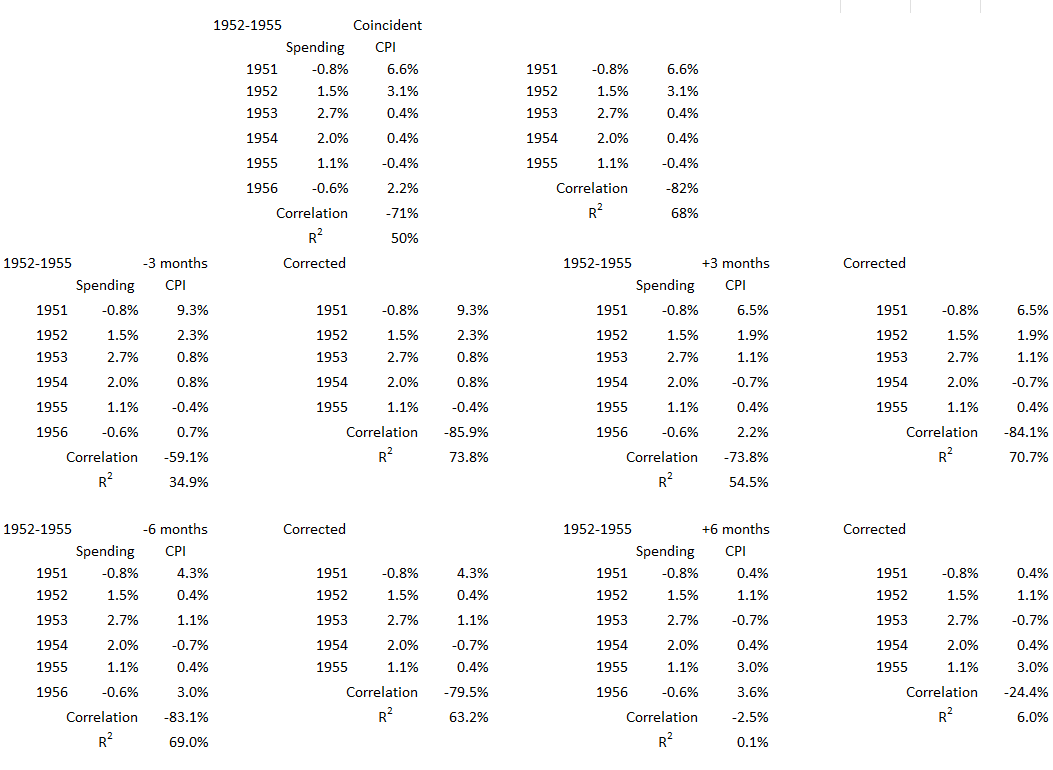
The associations are similar between deficit sending and inflation during all five years (R = –71%, R2 = 50%) and the four-year deflationary CPI plunge (R = –82%, R2 = 68%). During the years 1954 and 1955, both deficit spending and inflation declined. But we see just the opposite for 1952,1953, and 1956 when the two variables moved in strongly in opposite directions.
Figure 5. Annual Changes in Deficit Spending vs. Inflation for the Fiscal Years 1951-1956
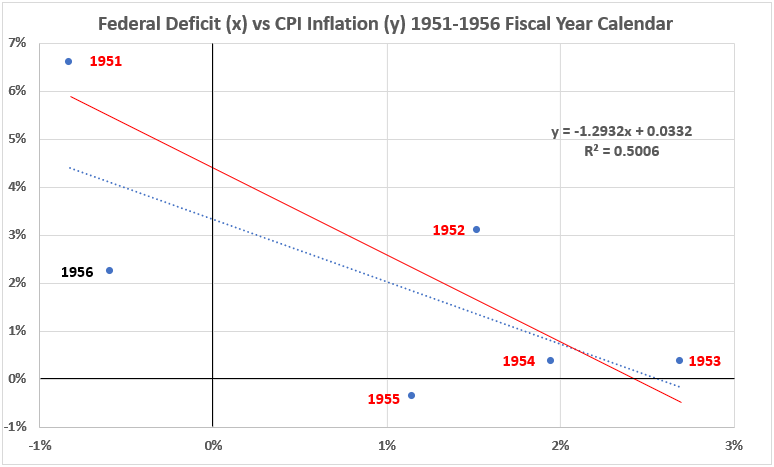
Figure 5 reinforces the observation that deficit spending and inflation coaligned to the fiscal year calendar show a negative association during the years 1951-1956.
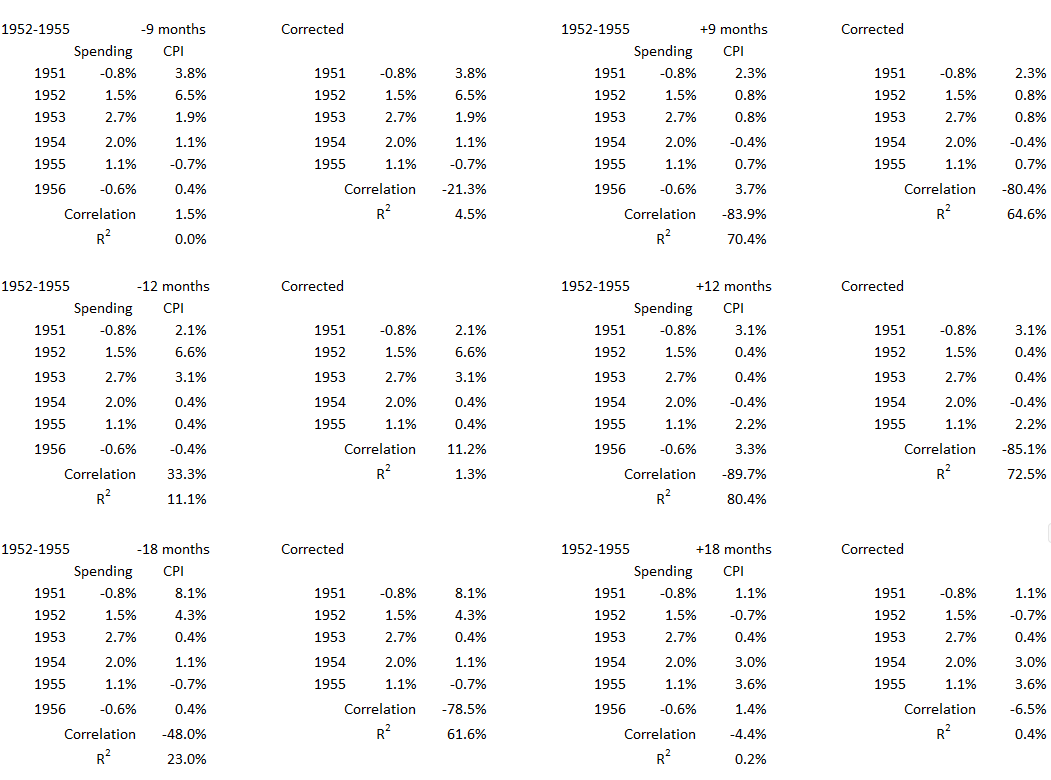
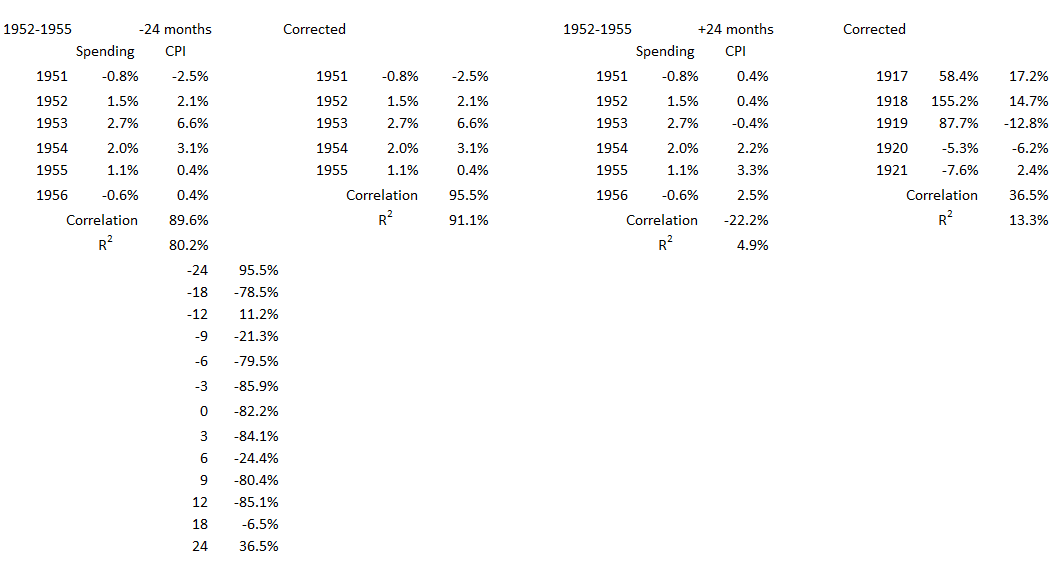
Figure 6. Correlation Between Deficit Spending and Inflation 1952-1955
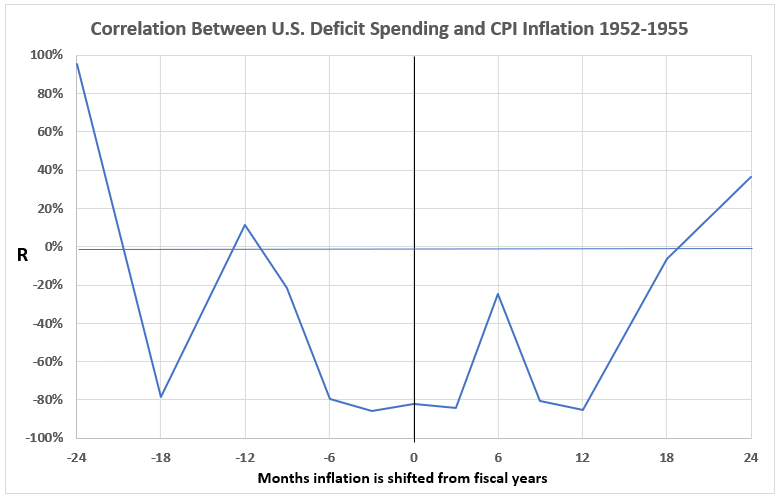
When the calendar alignments of deficit spending and inflation are varied, negative associations are found for all but inflation occurring 12 and 24 months before deficit spending and 24 months following deficit spending. The -12 month data point is not considered important because the correlation is extremely weak (R2 = 11%), and very close to the null region (R2 < 10%). These results suggest there is no possibility of any important cause-and-effect relationships between federal deficit spending and consumer inflation during this time period.
1975-1977
This time period includes the worst U.S. recession since the Great Depression (November 1973 to May 1975) and the Arab oil embargo from October 1973 to March 1974. The price of oil rose from $2.90 a barrel before the embargo to $11.65 a barrel in early 1974. Another significant event in this time period was the end of the Vietnam War with the fall of Saigon (now officially Ho Chi Minh City) on April 30, 1975. The two years 1973 and 1974 saw a significant inflation surge of 8.9%.4 Inflation at the end of 1974 (which is the number for the start of 1975) was 11.8%. Inflation surging during a recession was considered a novel occurrence and gave rise to the term “stagflation”.
Figure 7. U.S. Federal Deficit Spending and Inflation for the Fiscal Years 1973-1978
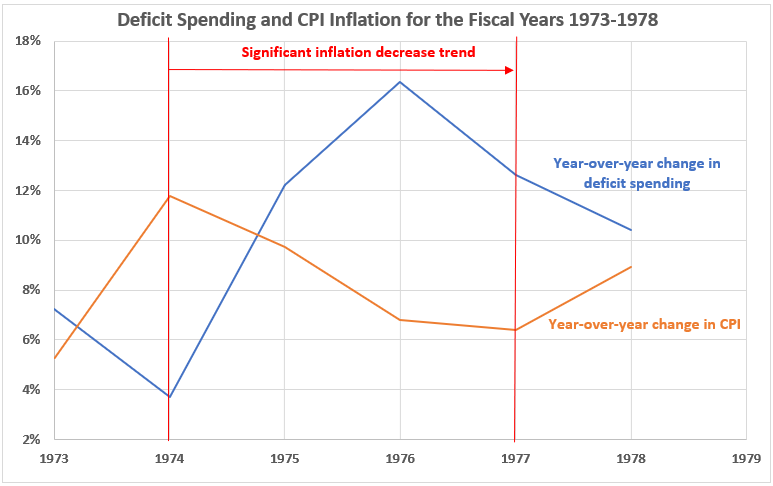
Figure 7 is similar to Figure 4 in that five of the six years show inflation moving in the opposite direction of deficit spending. Only the year 1977 has both variables declining.
Figure 8. Annual Changes in Deficit Spending vs. Inflation for the Fiscal Years 1973-1978
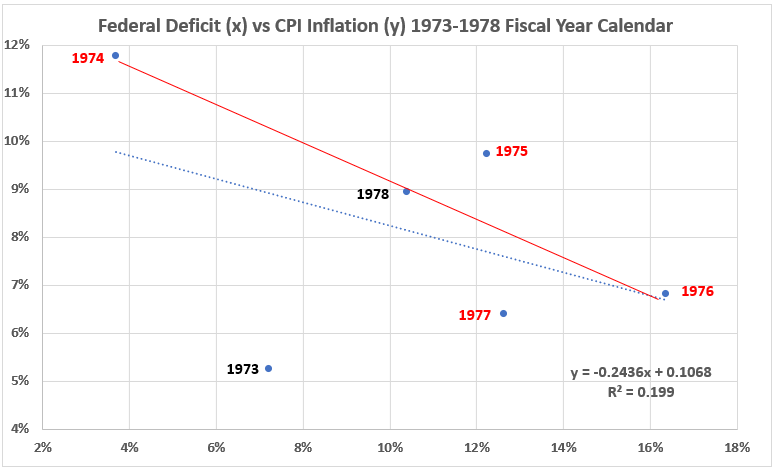
The associations for the three-year deflationary plunge with deficit spending (R = –86%, R2 = 74%) and all six years on the chart (R = –45%, R2 = 20%) are negative.
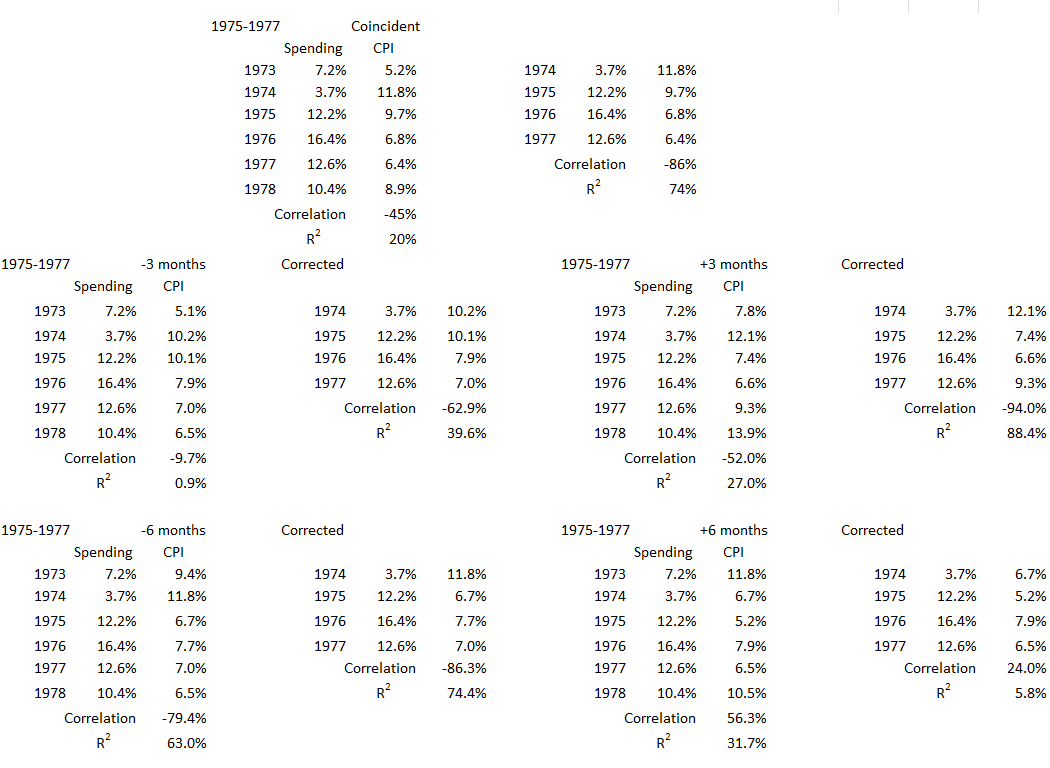
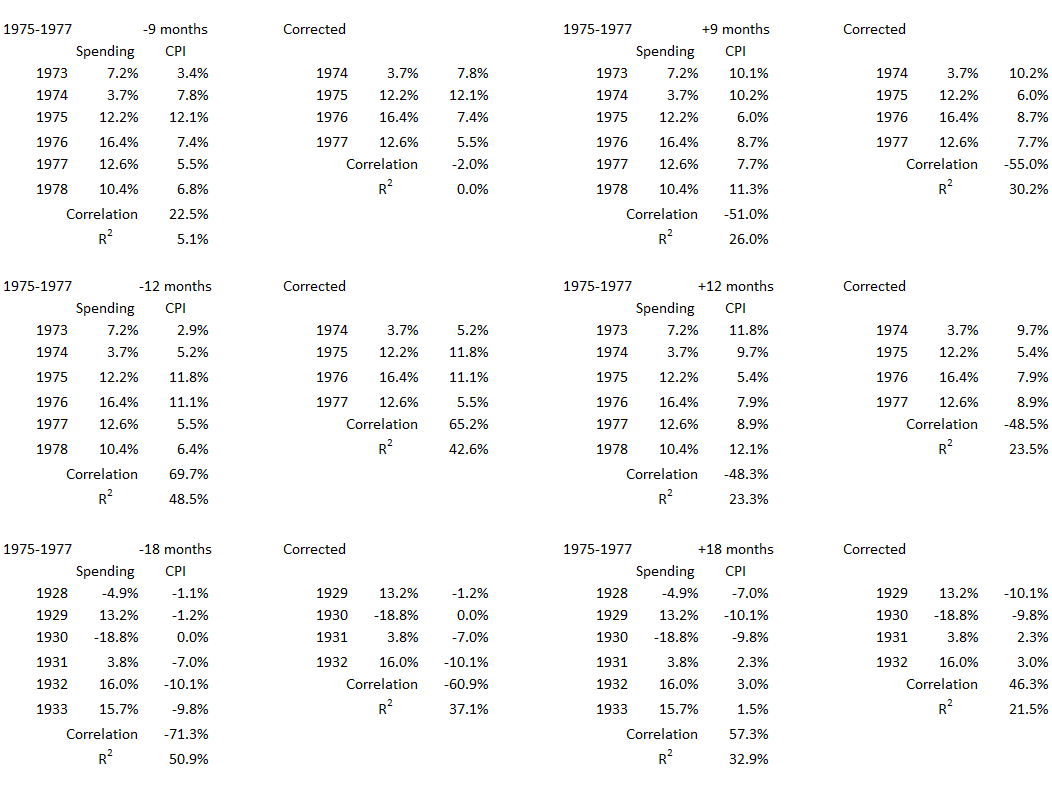
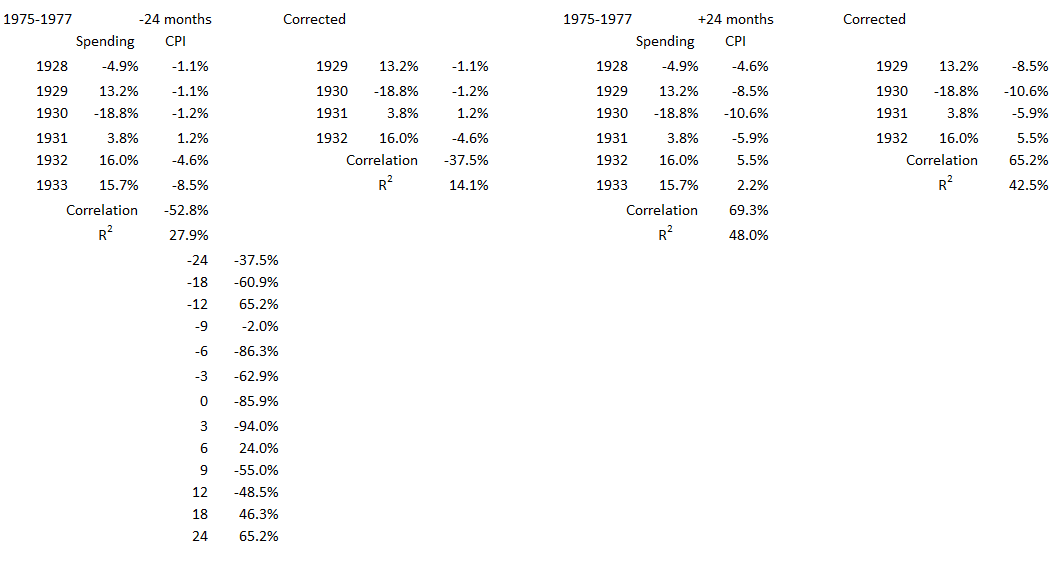
Figure 9. Correlation Between Deficit Spending and Inflation 1975-1977
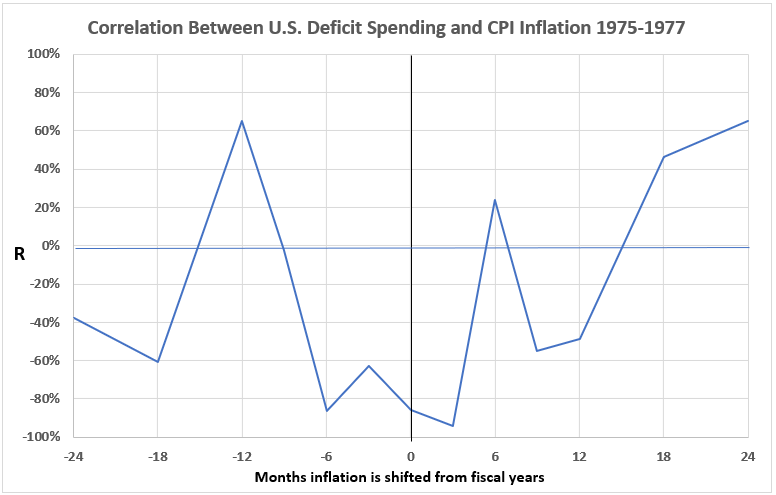
Only four of the timeline offsets produced positive correlations: Inflation 12 months before spending and 24 months after spending have moderate correlations; Inflation 6 months and 12 months after spending have weak correlations. The other nine data points show negative associations, with three below –71% (significant). This data indicates little possibility for important cause-and-effect relationships between federal deficit spending and consumer inflation during this time period.
1981-1986
There were two recessions during the early 1980s. The first, from January to June 1980, was a moderate decline. The second was from July 1981 to November 1982 and was severe, comparable to the 1973-75 recession. Interest rates are the most notable factor during the early and mid-80s. This time period starts with the Fed Funds target of 19-20% in December 1980. The highest market rate was 19.8% in July 1981,5 coinciding with the start of the 1981-82 recession. By the end of 1986, the Fed Funds rate had fallen to 5.77%. In 1987, Fed Funds rose to 7.58% by October 4 before rates were eased because of the stock market crash in October that year.
Figure 10. U.S. Federal Deficit Spending and Inflation for the Fiscal Years 1980-1987
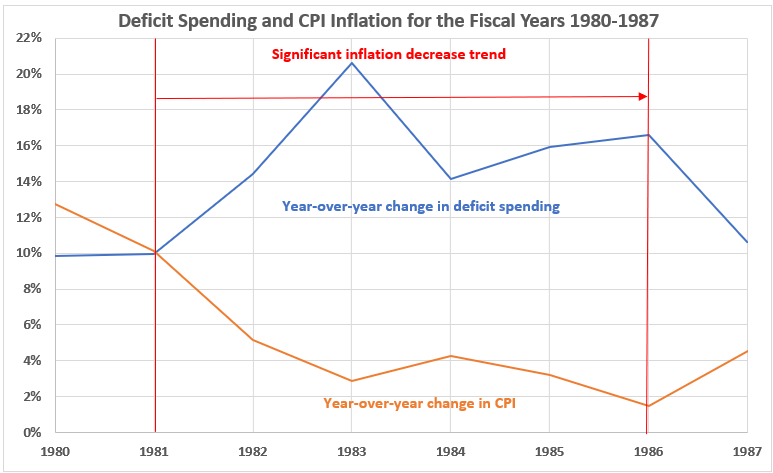
Every year in Figure 10 shows deficit spending and inflation changing in opposite directions.
Figure 11. Annual Changes in Deficit Spending vs. Inflation for the Fiscal Years 1980-1987
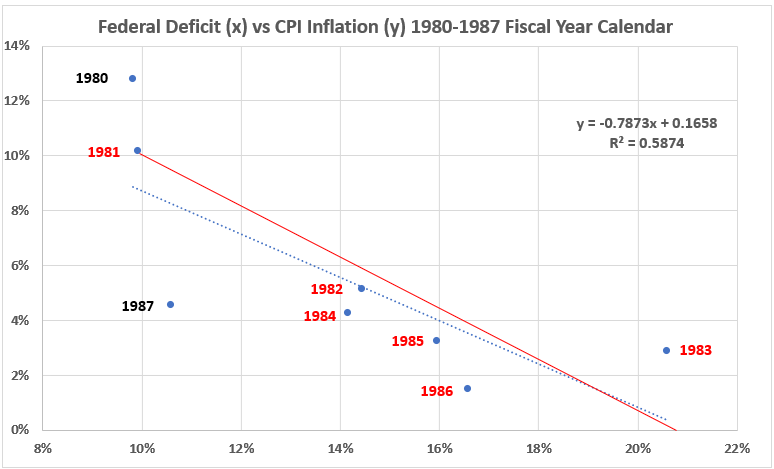
All eight years and the six in the significant inflation decline have negative associations between deficit spending and coincident inflation. For the eight-year period, (R = –77%, R2 = 59%) and for the six deflationary years (R = –87%, R2 = 76%).
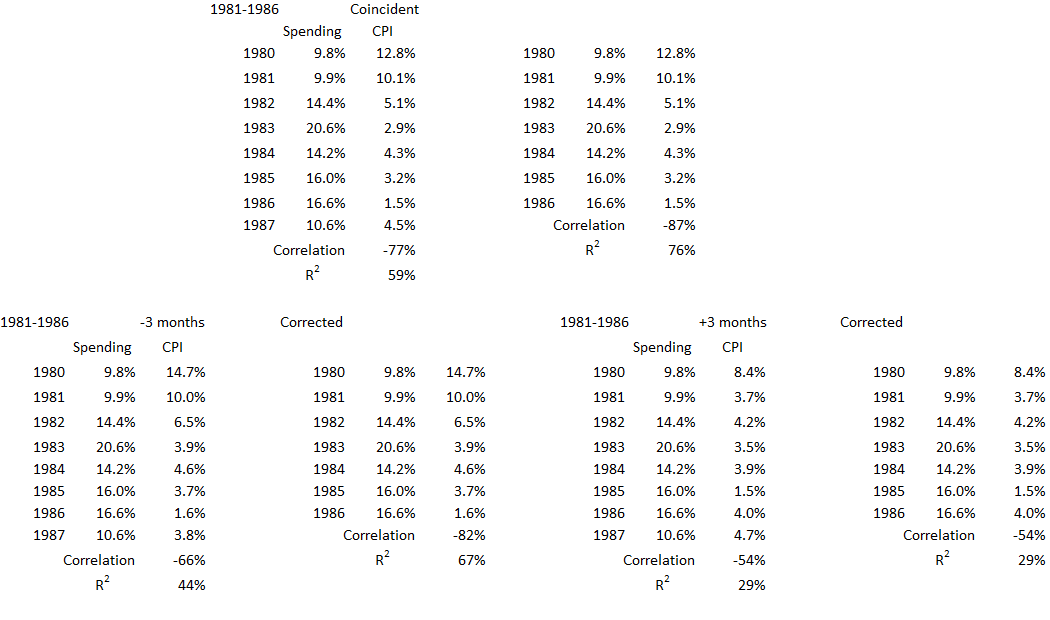
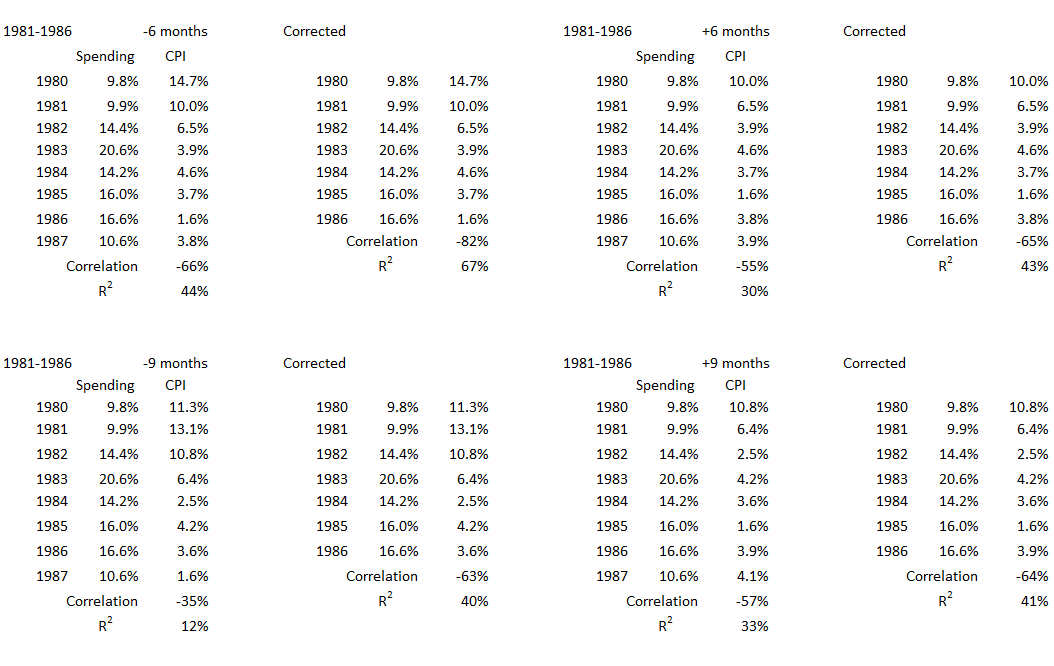
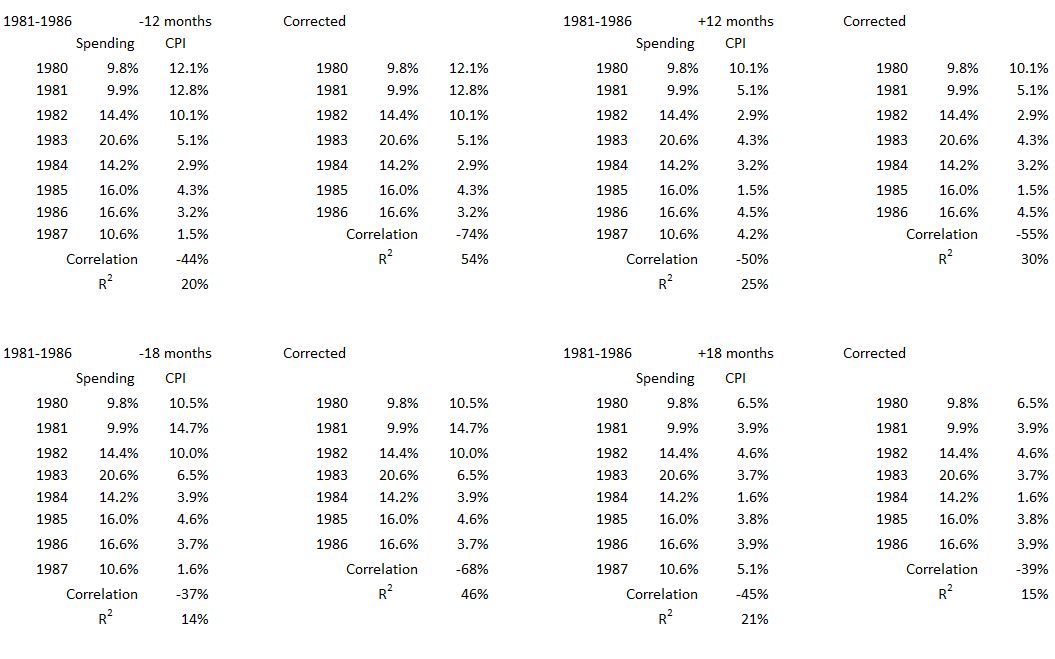
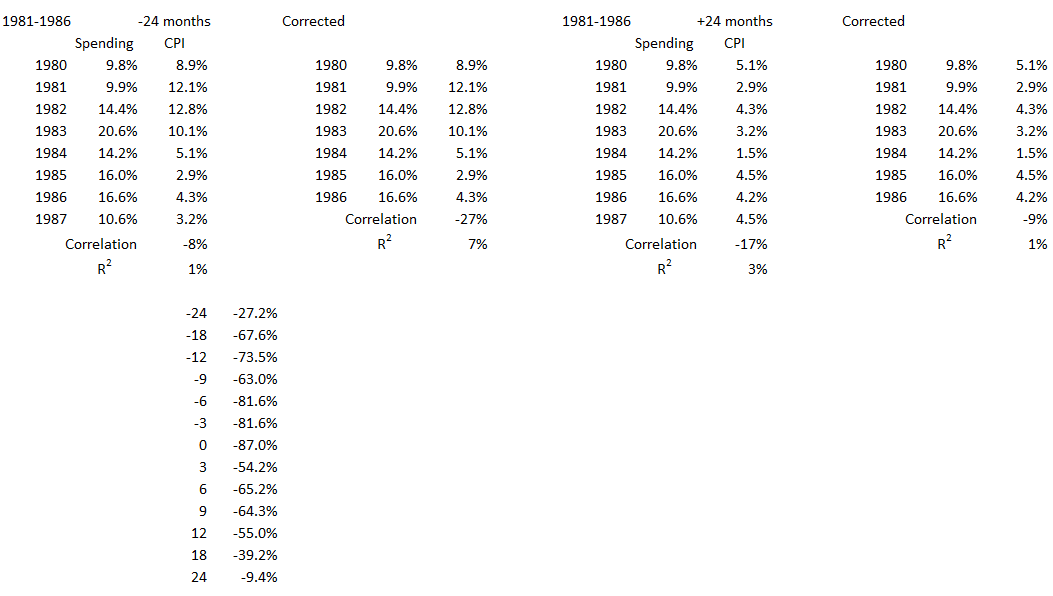
Figure 12. Correlation Between Deficit Spending and Inflation 1981-1986

Correlations are negative for all 13 alignments of inflation with deficit spending in the deflationary period during the 1908s. This suggests there are no possible cause-and-effect scenarios here.
1991-1998
This period started with a recession from July 1990 to March 1991 and the first Iraq war (the Gulf War) in 1991. The 90s ended with the dot.com boom (which reached a bubble top in 2000). Interest rates were also a dominant feature of this decade, with the Fed Funds rate declining from a high of 8.2% in January 1990 to less than 3% for much of 1993.5 After rising briefly above 6% a few times in 1995 and remaining above 5% from late 1994 until the middle of 1998, the Fed Funds rate dropped to 4% by the end of 1998. The rate rose again by the end of 1999 to 5.6%. This decade is in the heart of what economists have called The Great Moderation,6 which covers a period from the mid-1980s to 2007.
Figure 13. U.S. Federal Deficit Spending and Inflation for the Fiscal Years 1990-1999
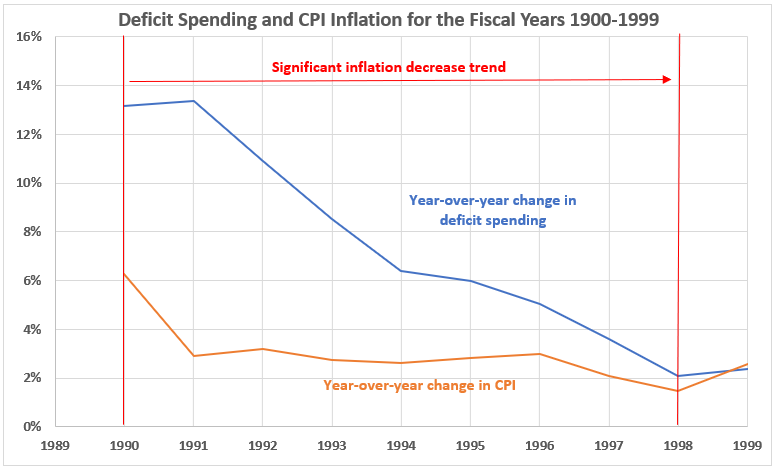
The deflationary period in the 1990s was different than all the other such periods since World War II: Inflation and deficit spending both declined or were little changed every year of the decade except for 1999.
Figure 14. Annual Changes in Deficit Spending vs. Inflation for the Fiscal Years 1990-1999
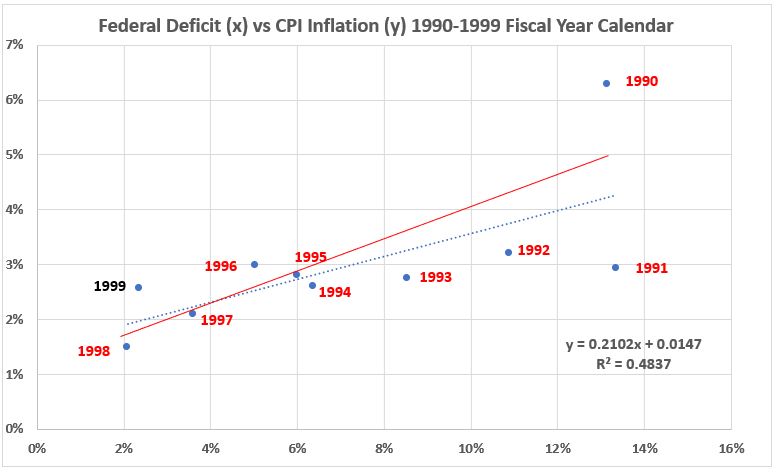
With the exception of 1990, the data in Figure 14 has a remarkable linear appearance. This is unusual when compared to all the previous data we have seen for the ten significant inflationary periods and the ten other deflationary periods between 1914 and 2022. The slopes of the two trend lines are increased by the presence of 1990 data. This produces a bigger change in inflation for each change in deficit spending than would be the case without 1990 data included. Whether this is a point for further investigation is deferred. We do not even know at this point whether it might be important at all in the final analysis.
Not surprisingly, the associations between inflation and deficit spending are relatively strong here: R = 70%, R2 = 48% for the entire decade and R = 71%, R2 = 51% for the eight deflationary years.
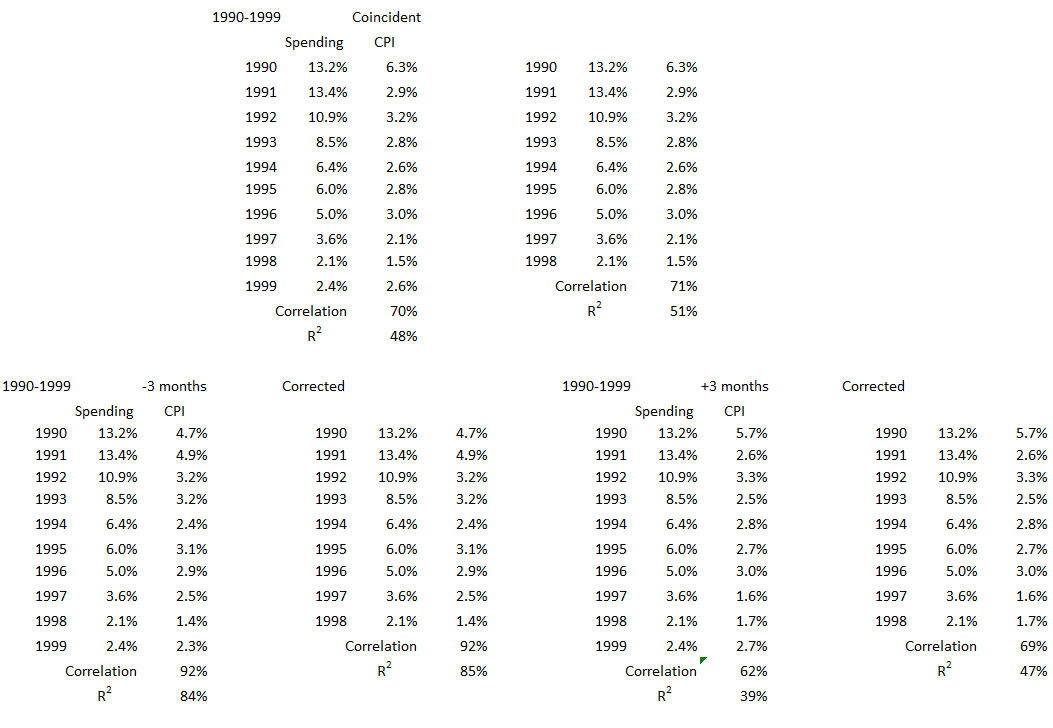
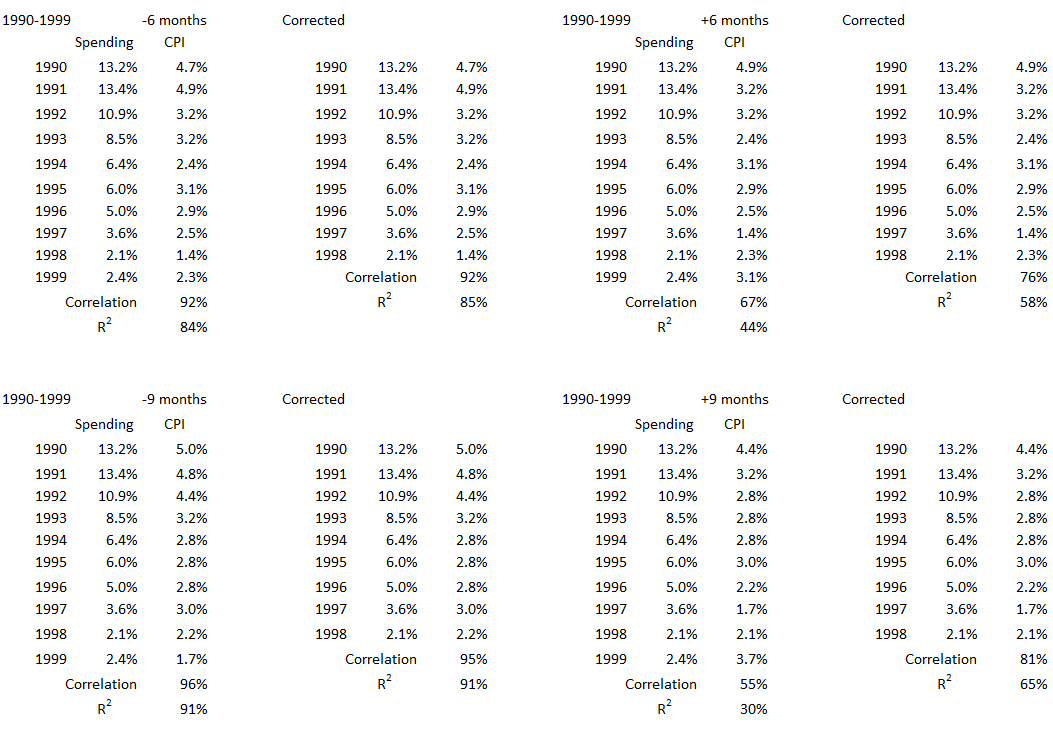
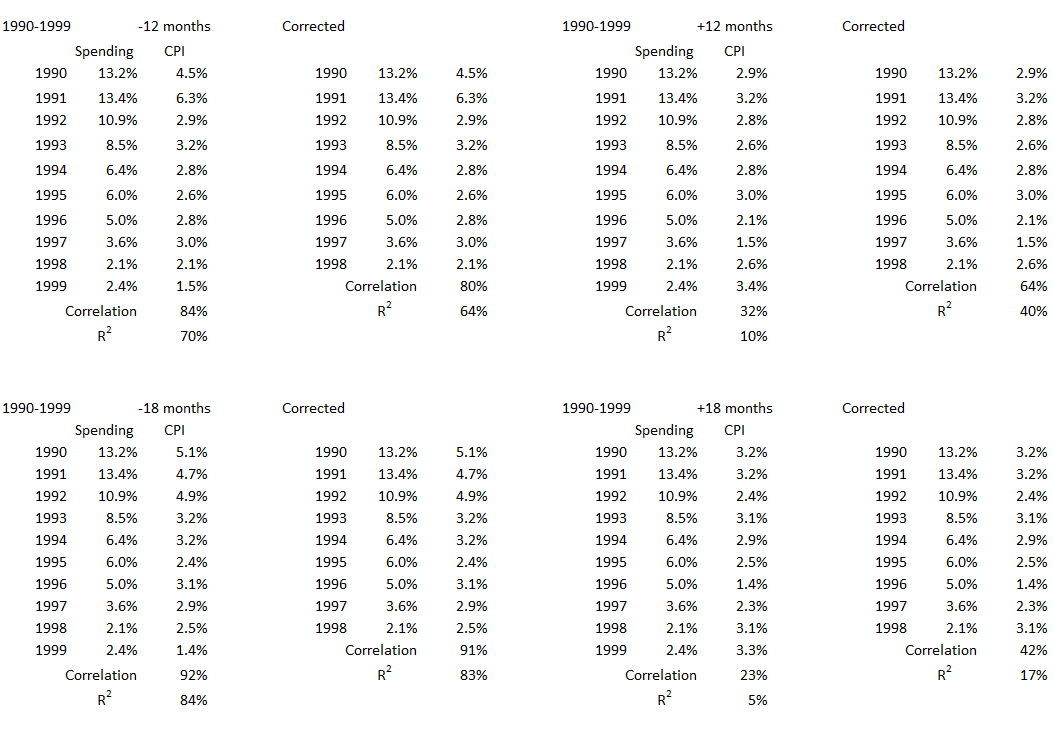
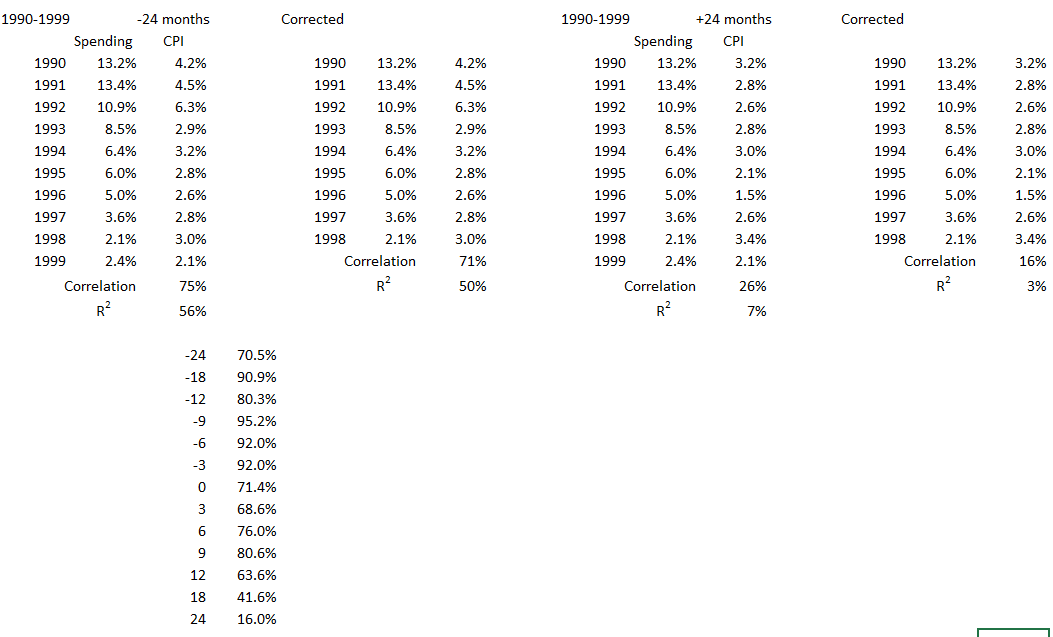
Figure 15. Correlation Between Deficit Spending and Inflation 1991-1998
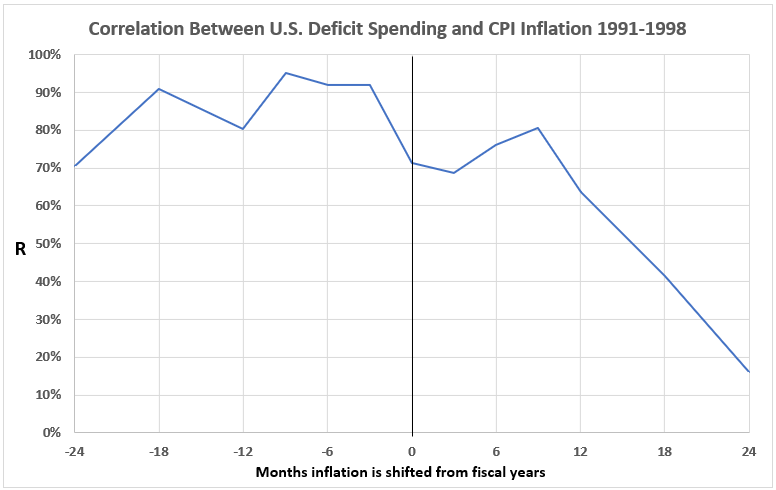
The associations between deficit spending and inflation are significant for inflation occurring before deficit spending for all alignments, as well as when inflation data is aligned to be coincident with the fiscal calendar year. The association is also significant for inflation occurring 6 and 9 months after deficit spending. This data indicates it is possible for significant(and maybe even dominant) cause-and-effect relationships between deficit spending and inflation in the 1990s when both were declining.
Conclusion
For the purposes of the analysis above, the following definitions regarding correlations were made.
Table 2. Definitions Regarding Correlations

Using the classifications in Table 2, the analysis results here and in Part 13A are summarized in Table 3.
Table 3. Correlations for Deflationary Surges and Federal Deficits 1914-2022
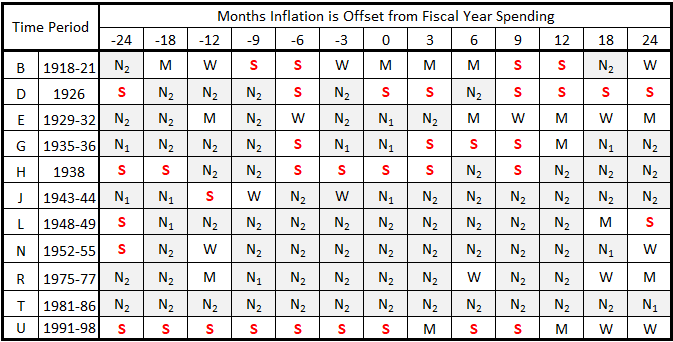
All the significant cells contain a red S, and all the null and negative cells are shaded light gray. This has been done to improve focus when scanning the table.
From Table 3 we draw the following conclusions:
- It is possible that disinflation (or deflation) caused deceased deficit spending and decreased deficit spending caused disinflation (or deflation) for the significant inflation declines in all of the declining inflation periods before World War II (B, D, E, G, H). The possibilities are less for time period G (1929-1932) than for the others.
- The possibility for cause-and-effect relationships exists for the World War II period (1943-44) but is relatively small.
- The possibilities for either reduced deficit spending causing disinflation or disinflation causing reduced deficit spending are less after World War II, except for the 1990s.
- In the 1990s it is possible that deficit spending changes could be major or even dominant causes of disinflation or vice versa.
- In the 1980s, the data suggests that there were no possible direct cause-and-effect relationships between reduced deficit sending and disinflation.
The next work on this project will look at associations between deficit spending and inflation during the 37 years between 1914 and 1922 that were not part of significant inflationary or deflationary trends.
Appendix
In this appendix, we show all the data selections from the tables in Part 13A, Appendix 1,2 used to analyze each significant deflationary period.
1948-1949
1952-1955
1975-1977
1981-1986
1991-1998
Footnotes
1. Lounsbury, John, “Government Spending and Inflation. Part 14A”, EconCurrents, July 2, 2023. https://econcurrents.com/2023/07/02/government-spending-and-inflation-part-14a-deflation/
2. Lounsbury, John, “Government Spending and Inflation. Part 13A, Appendix 1”, EconCurrents, June 4, 2023. https://econcurrents.com/2023/06/04/government-spending-and-inflation-part-13a/
3. Lounsbury, John, “Government Spending and Inflation. Part 11”, EconCurrents, May 7, 2023.
https://econcurrents.com/2023/05/07/government-spending-and-inflation-part-11/.
4. Lounsbury, John, “Government Spending and Inflation. Part 13B”, EconCurrents, June 25, 2023. https://econcurrents.com/2023/06/25/government-spending-and-inflation-part-13b/
5. MacroTrends, “Federal Funds Rate – 62 Year Historical Chart”, https://www.macrotrends.net/2015/fed-funds-rate-historical-chart
6. Federal Reserve History, “The Great Moderation”, Federal Reserve Bank of St. Louis’s Economic Research division. https://www.federalreservehistory.org/essays/great-moderation