We have failed to find systematic relationships between consumer inflation and federal deficit spending over long time periods. This is a continuation of looking at each period of significant inflation and disinflation/deflation individually. Parts 13A1 and 13B2 analyzed the ten significant inflation periods since 1914. This is the first of two posts to analyze the eleven significant deflationary periods for the years 1914-2022.

From photo by Guillaume de Germain on Unsplash
Introduction
Previously,3 we sorted the 108 years from 1914-2022 into three groups.
- Years belonging to periods in which inflation increased by at least 4% without any pullback exceeding 1.5%. (10 periods, 34 years)
- Years belonging to periods in which inflation decreased by at least 4% without any pullback exceeding 1.5%. (11 periods, 37 years)
- The remaining years are not part of a period with significant inflation changes. (37 years)
The conclusion was that, even with this data disaggregation, no clear hypotheses about time variation of the associations between deficit spending and consumer inflation could be proposed. We decided that it would be necessary to characterize each of the individual periods with significant inflation increases or decreases to determine what (if any) time variation patterns of the correlations between deficit spending and consumer inflation existed over the 108 years.
As stated above, this post looks at periods of time when inflation decreased.
It is common to use the term “disinflation” when the rate of inflation declines but does not go below zero.4 Deflation is often reserved only for a contraction in a measure of prices, such as the Consumer Price Index (CPI). In this work, we sometimes use the term deflation for any decline in the rate of inflation, even when the ending price index has not moved below a previous level.
DATA
The data used in the analysis presented here is the same that has been used previously. The time series and correlations for the two data sets coincident for each federal fiscal year as well as inflation offsets by ±3, ±6, ±9, ±12, ±18, and ±24 month amounts with respect to the fiscal years. The thirteen data tables are shown in Part 13A, Appendix 1.5
The periods of significant increases in inflation are given in Table 1, corrected from what was posted previously.3
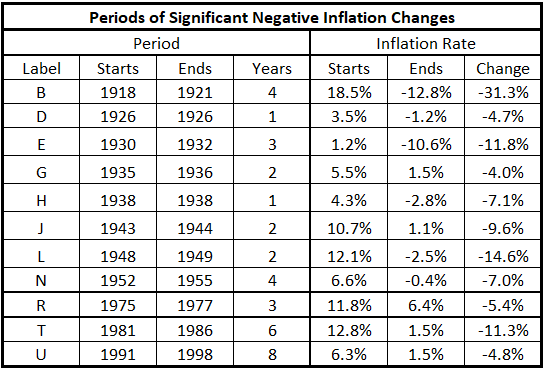
Table 1. Periods of Significant Decreases of Inflation 1914-2022
Analysis
A period of inflation or deflation is defined by one more data point than the number of years in the inflation or deflation trend. For example, the deflation of 1918-1921 (B in Table 1) is defined by the starting inflation rate
- at the beginning of 1918 (shown in the data tables as the inflation rate for 1917, the rate at the end of 1917),
- the inflation rate at the end of 1918 (which is the same as the inflation rate at the start of 1919),
- inflation rate at the end of 1919 (which is the same as the inflation rate at the start of 1920),
- inflation rate at the end of 1920 (which is the same as the inflation rate at the start of 1921), and
- the inflation rate at the end of 1921.
When calculating the correlation between deficit spending and consumer deflation, the number of data pairs involved is one more than the number of years of the deflationary period. This is evident in the first graph for each deflation period where the start of the deflation and the end of the deflation are clearly labeled.
1918-1921
This is a period of time that includes the end of World War I and the start of the severe recession of 1921-22.
Figure 1. U.S. Federal Deficit Spending and Inflation for the Fiscal Years 1917-1922
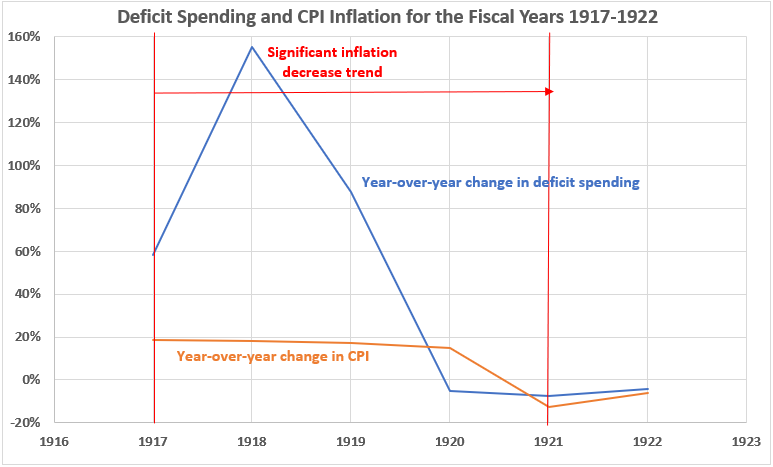
Inflation declined during this collapse from 18.5% to –12.8%, the largest decline of any significant deflationary period over the 108 years. Yet on this chart, the decline doesn’t look that impressive because of the wild swings in federal government spending.
Figure 2. Annual Changes in Deficit Spending vs. Inflation for the Fiscal Years 1917-1922
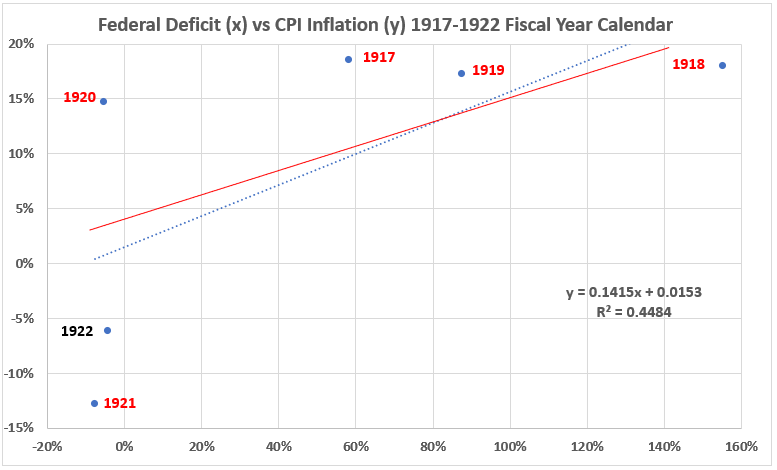
Inflation declined modestly from the beginning of fiscal year 2018 (the same as the end of 2017) to the end of 2020 (18.5% to 14.7%). The first year of the 1920-21 recession (January 1920 to July 1921) produced a collapse to –12.5%.
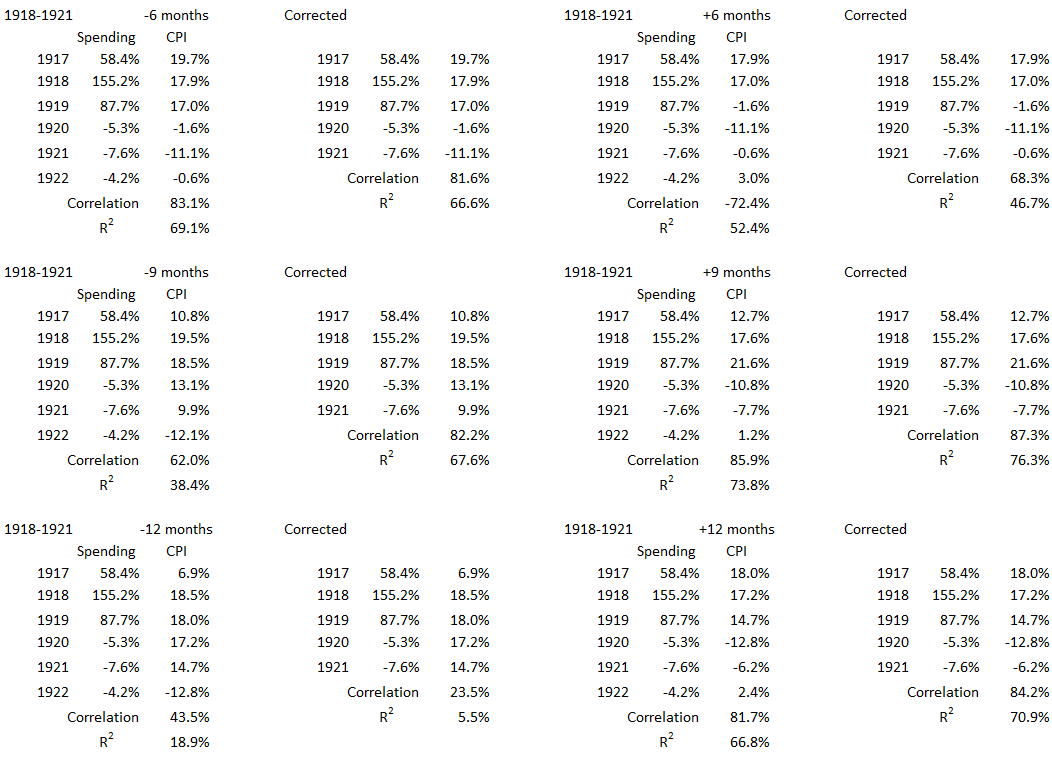
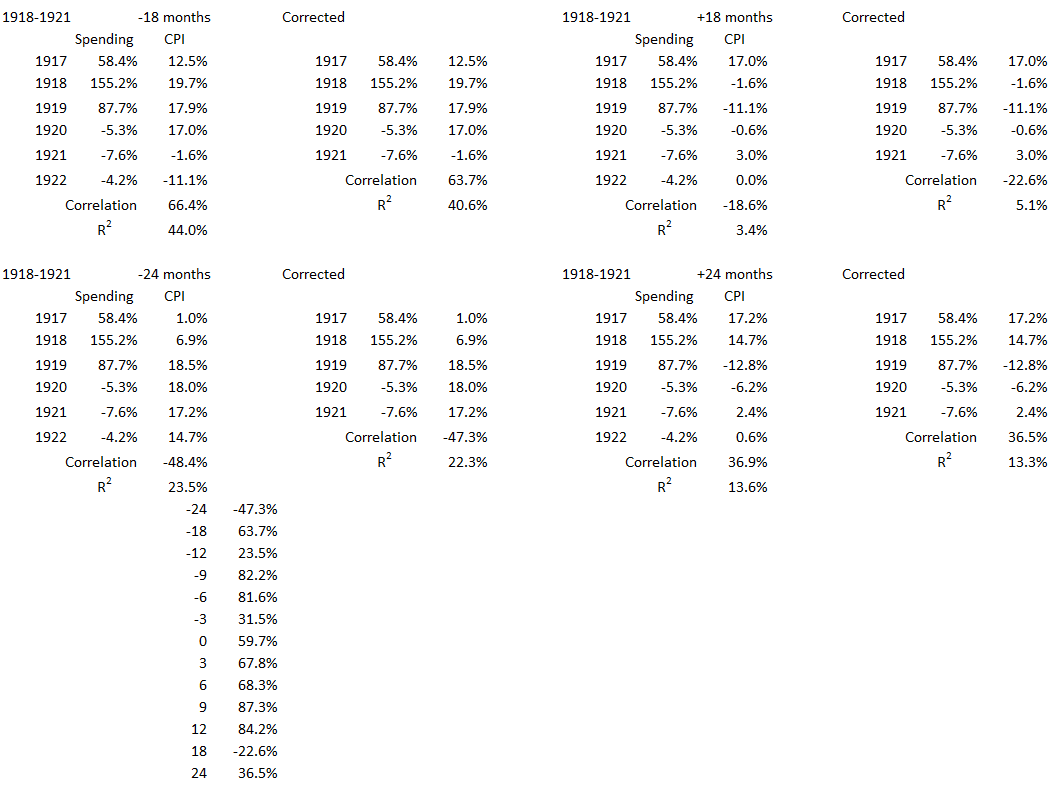
Figure 3. Correlation Between Deficit Spending and Inflation 1918-1921
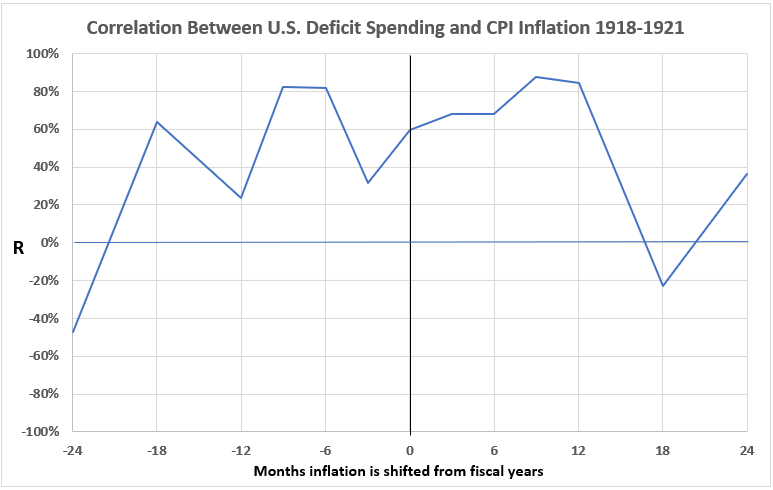
There appear to be possibilities for each of the variables to lead the other in time. There are significant associations with timeline shifts for inflation of -9, -6, +9, and +12 months. However, the volatility of the correlations does raise concerns that other factors may be at play in the cause-and-effect picture.
1926
This was a year with booming business activity and manufacturing production. Financial markets were strong and many stocks had a good year. But 1926 was unusual for a boom year with a sharp decline in commodity prices.6 The collapse of commodity prices was especially hard on miners and farmers. Consumers benefited though with inflation dropping from 3.5% at the beginning of the year to –1.1% at the end.
Figure 4. U.S. Federal Deficit Spending and Inflation for the Fiscal Years 1924-1927
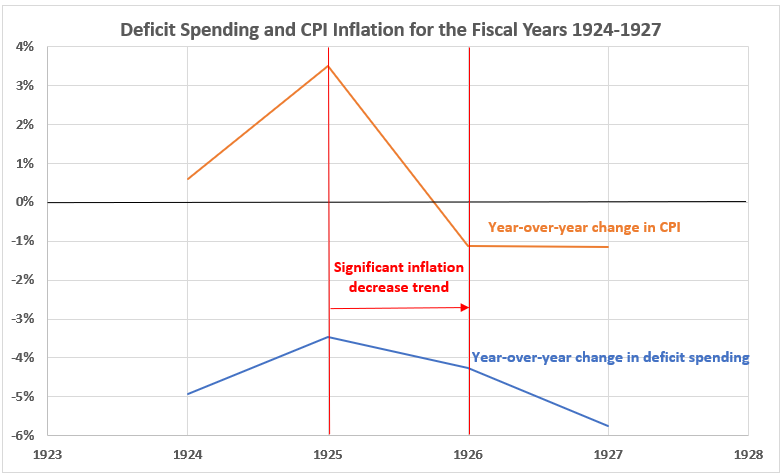
The changes in federal spending and inflation show similar behavior in Figure 4, except for the much larger change in inflation than in government spending. That exceptional decline in CPI probably resulted from a collapse in commodity prices, as noted previously.
Figure 5. Annual Changes in Deficit Spending vs. Inflation for the Fiscal Years 1924-1927
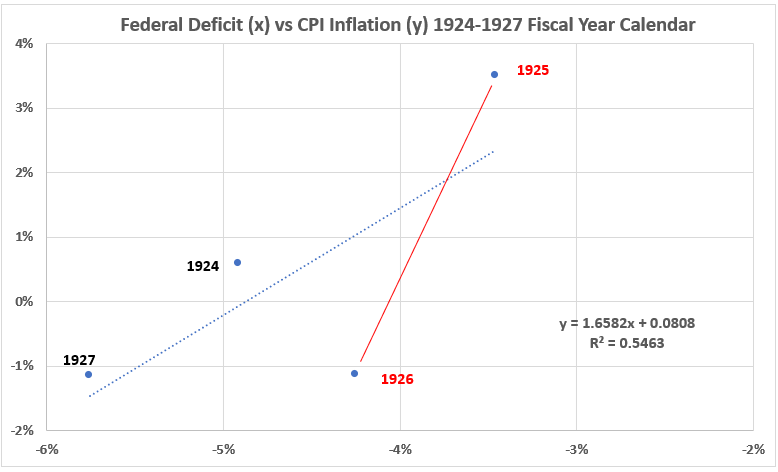
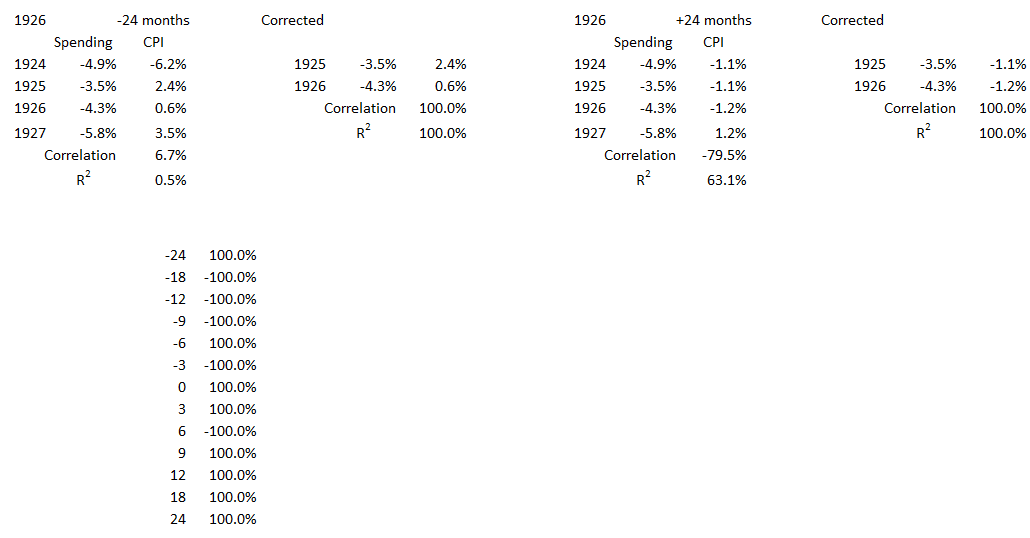
The year 1926 shows a significant association of deficit spending with inflation (both declined) with R2 = 100% (R = 100%). The same significant association is seen for the entire four-year period. R2 = 55%, R = 74%.
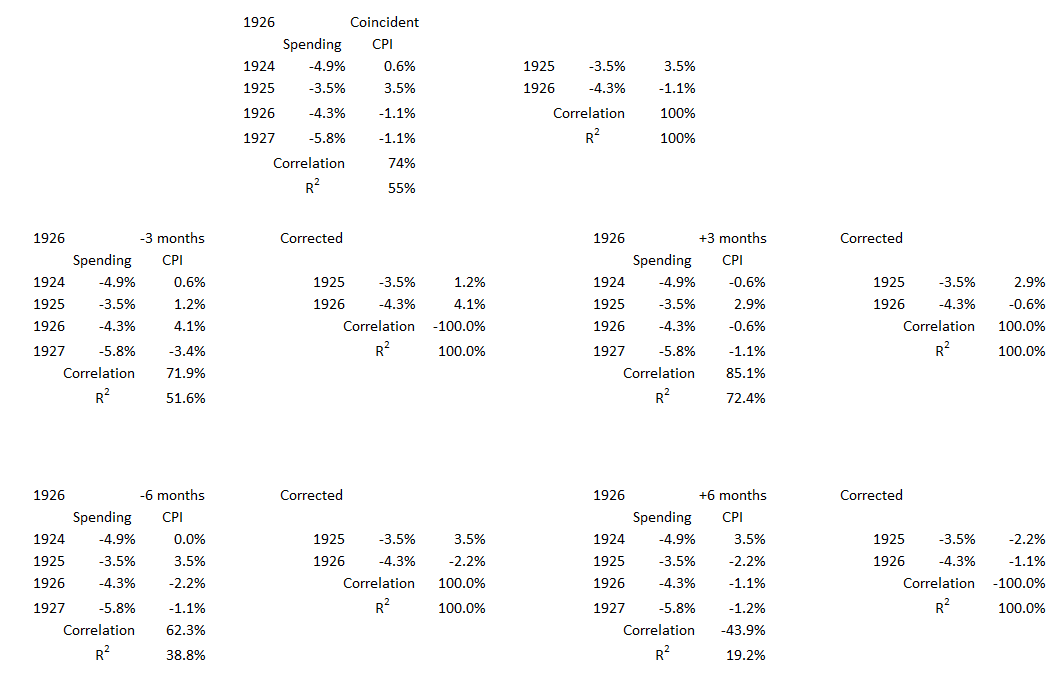
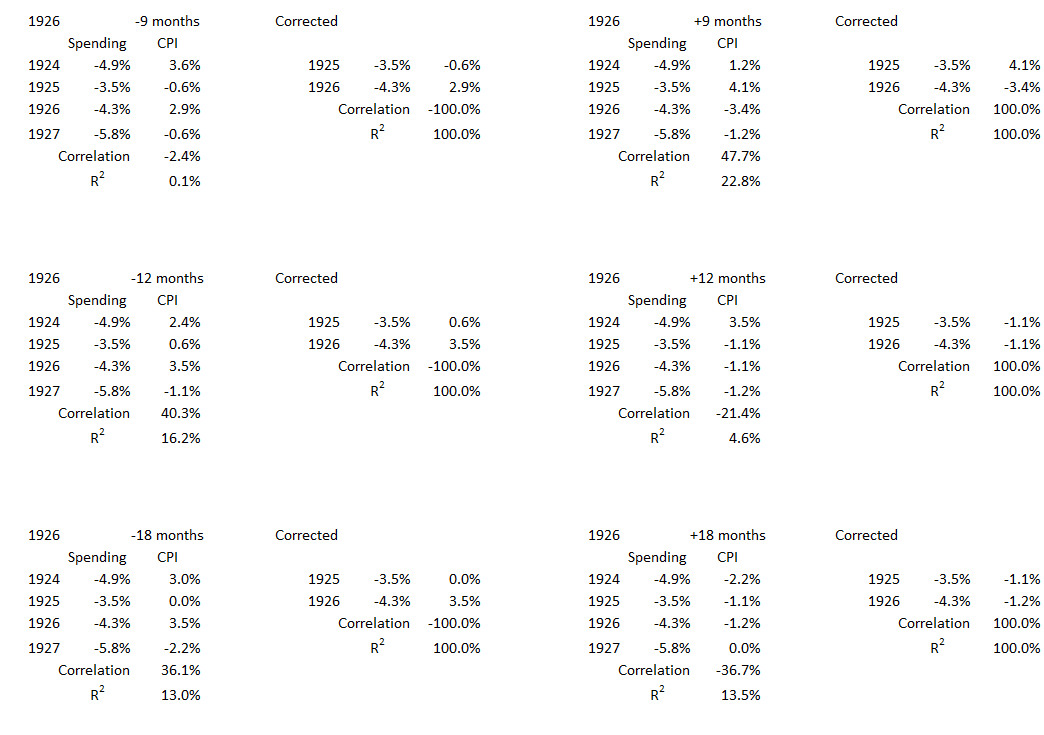
Figure 6. Correlation Between Deficit Spending and Inflation 1926
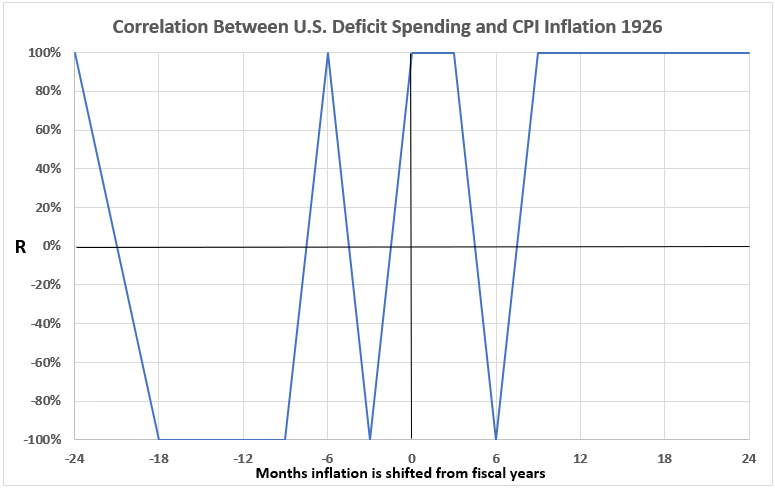
While there are several timeline offsets (mostly but not all with changes in government spending occurring before inflation changes), there are also correlations of –100%. This indicates that other factors besides government spending are likely associated with the decline in inflation. As discussed above, collapsing commodity prices were probably involved.
1930-1932
These were the first three years of the Great Depression which started in August of 1929, the second month of fiscal 1930. Inflation declined from 1.2% at the start of 1930 to –10.7% at the end of 1932.
Figure 7. U.S. Federal Deficit Spending and Inflation for the Fiscal Years 1928-1933
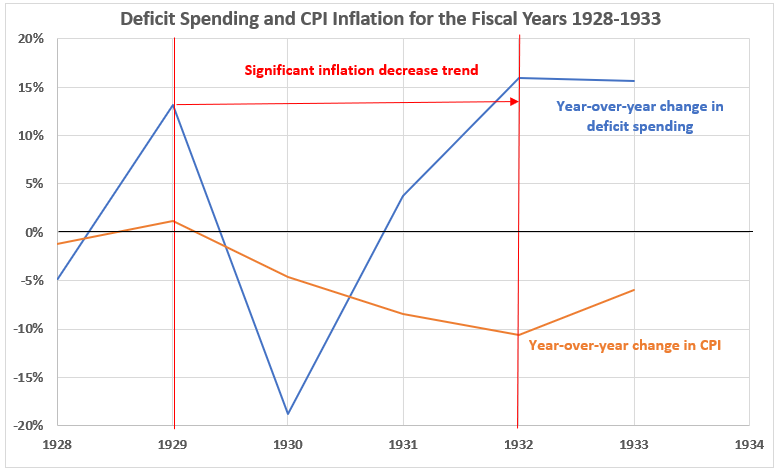
This is a most astounding graph. The federal government went from a 13.2% budget deficit for fiscal 1929 (ended June 30, 1929) to a budget surplus of 18.8% for fiscal 1930. This was probably a much bigger contributor to the onset of the Great Depression than the stock market crash in October 1929.
Figure 8. Annual Changes in Deficit Spending vs. Inflation for the Fiscal Years 1928-1933
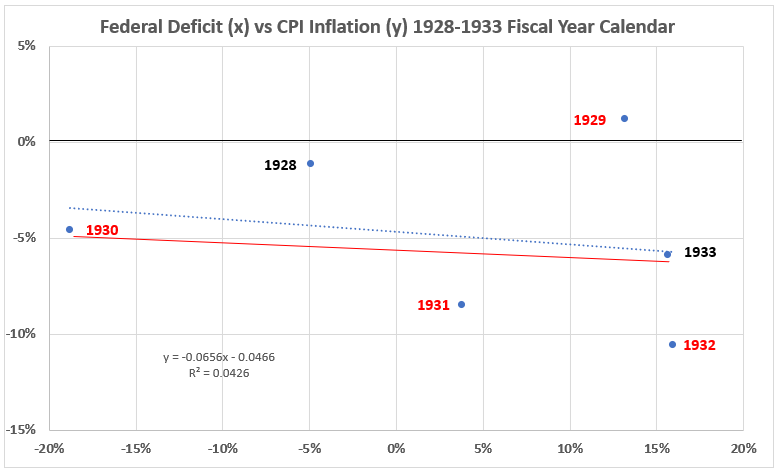
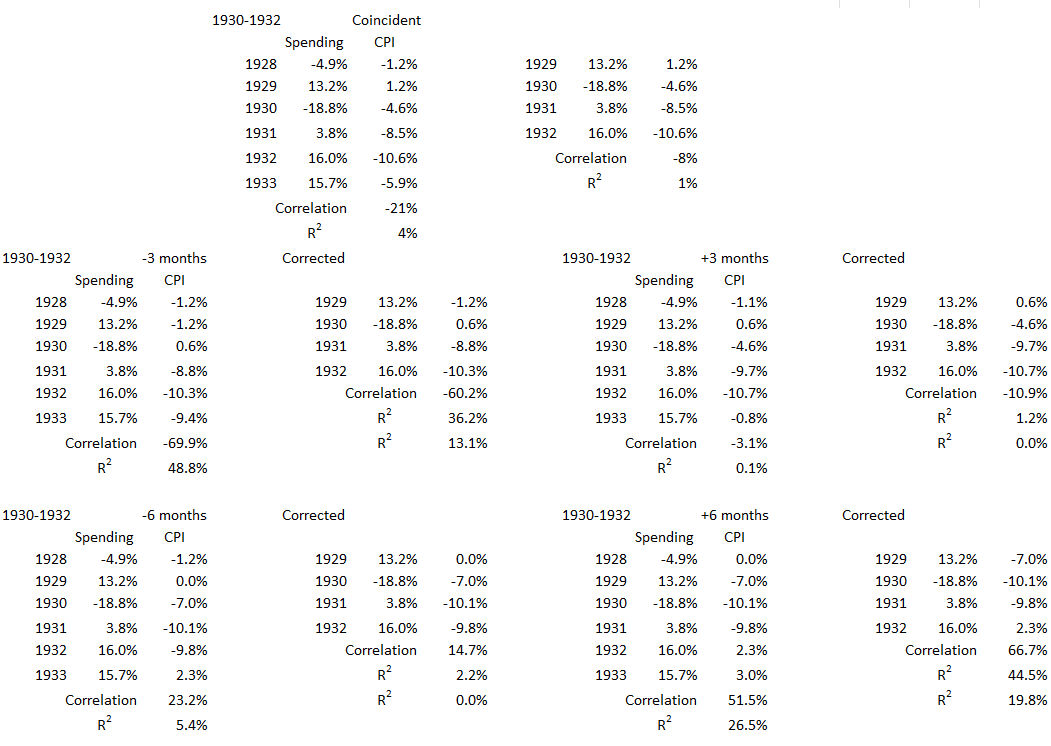
The association between deficit spending and consumer inflation (coincident timelines) is almost nonexistent during the time period. For the entire six years from 1928 to 1933, R2 = 4%. For the three years of declining inflation, R2 < 1%.
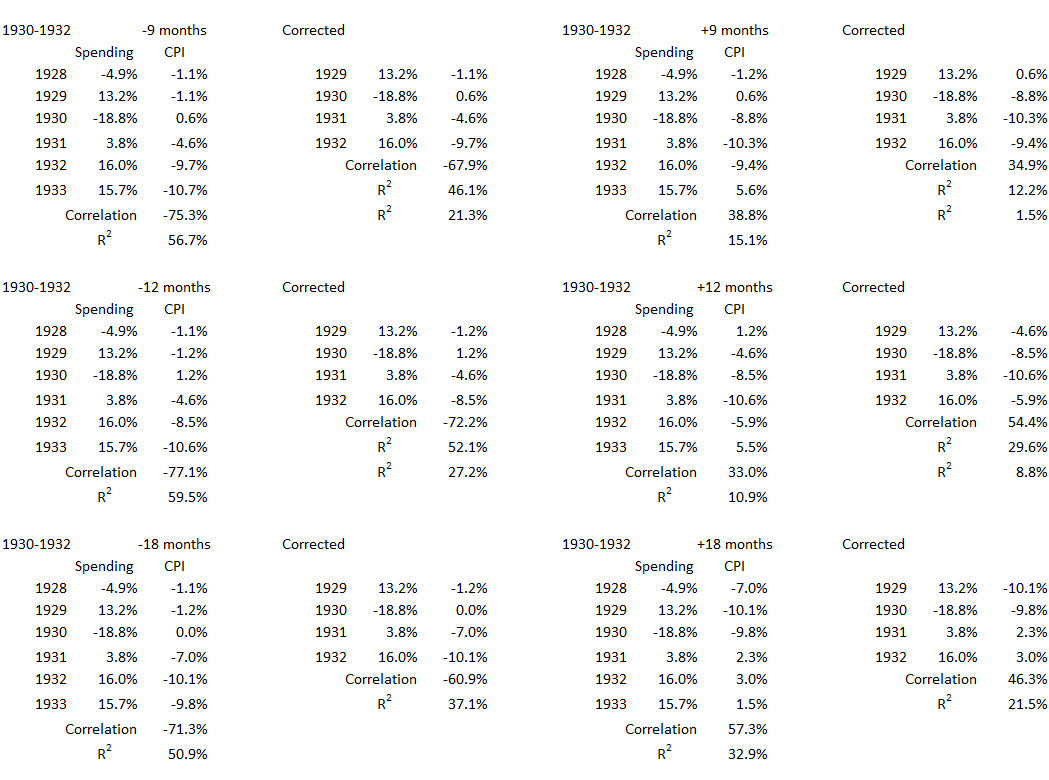
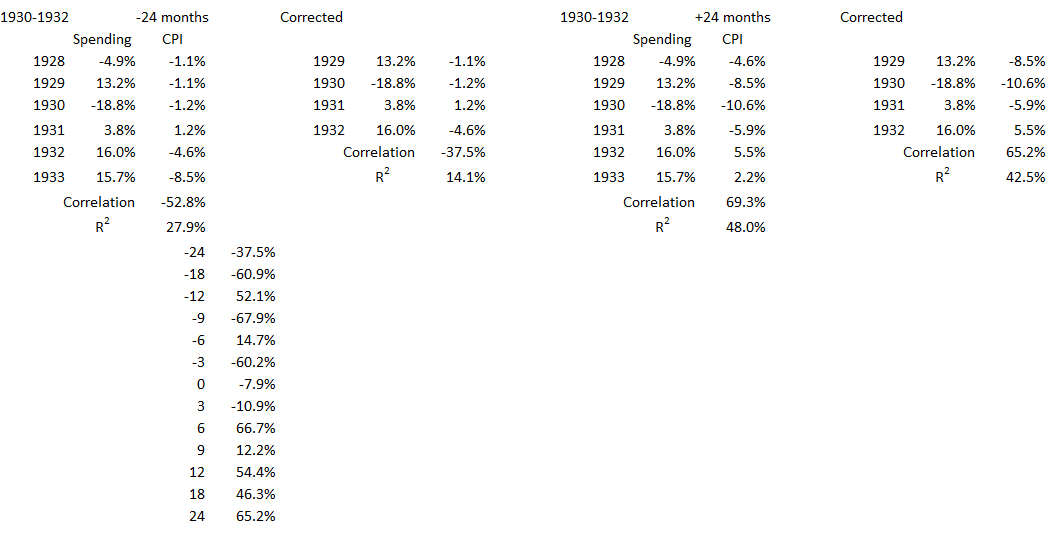
Figure 9. Correlation Between Deficit Spending and Inflation 1930-1932
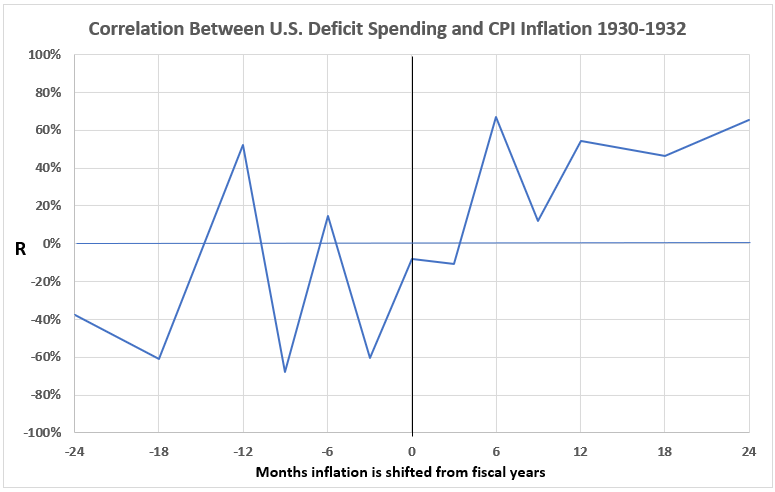
With leads and lags considered, there are four data points in the moderate association range: inflation 12 months before spending and 6, 12, 18, and 24 months after spending. This allows for the possibility that reduced spending caused deflation, but the largest possible contribution would be 45% (R = 66.7% for +6 months inflation shift –> R2 = 45%). During the fiscal years 1930, 1931, and 1932 the total of other factors was more important for causes of deflation than government spending directly.
1935-1936
This time period encompassed a labored recovery from the depths of the Great Depression. The two deflationary years 1935 and 1936 came as businesses were recovering but unemployment remained high and the number of people employed was still well below the leaves of the late 1920s.
Figure 10. U.S. Federal Deficit Spending and Inflation for the Fiscal Years 1933-1938
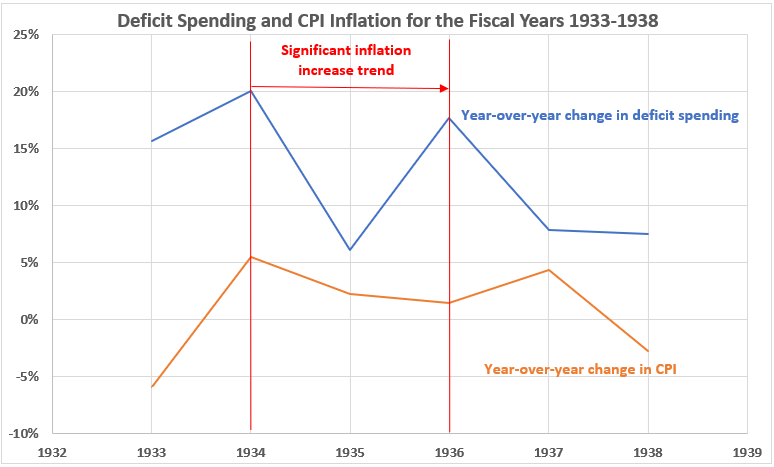
There was a decline in deficit spending for fiscal 1935 and inflation also declined. But the 1936 rise in deficit spending was accompanied by a further decline in inflation
Figure 11. Annual Changes in Deficit Spending vs. Inflation for the Fiscal Years 1933-1938
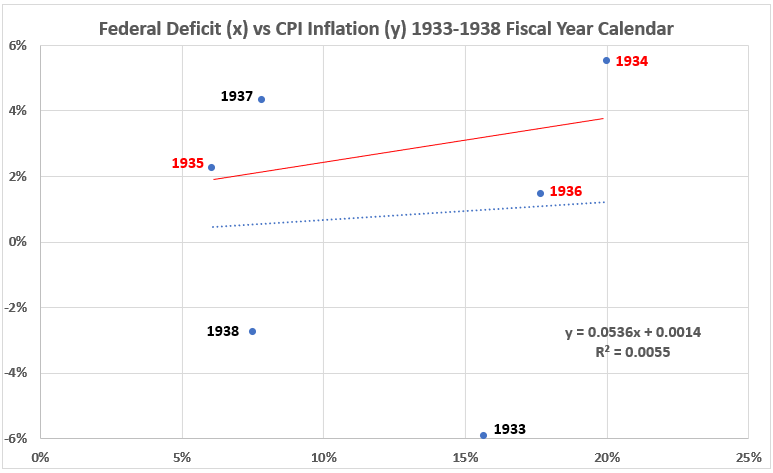
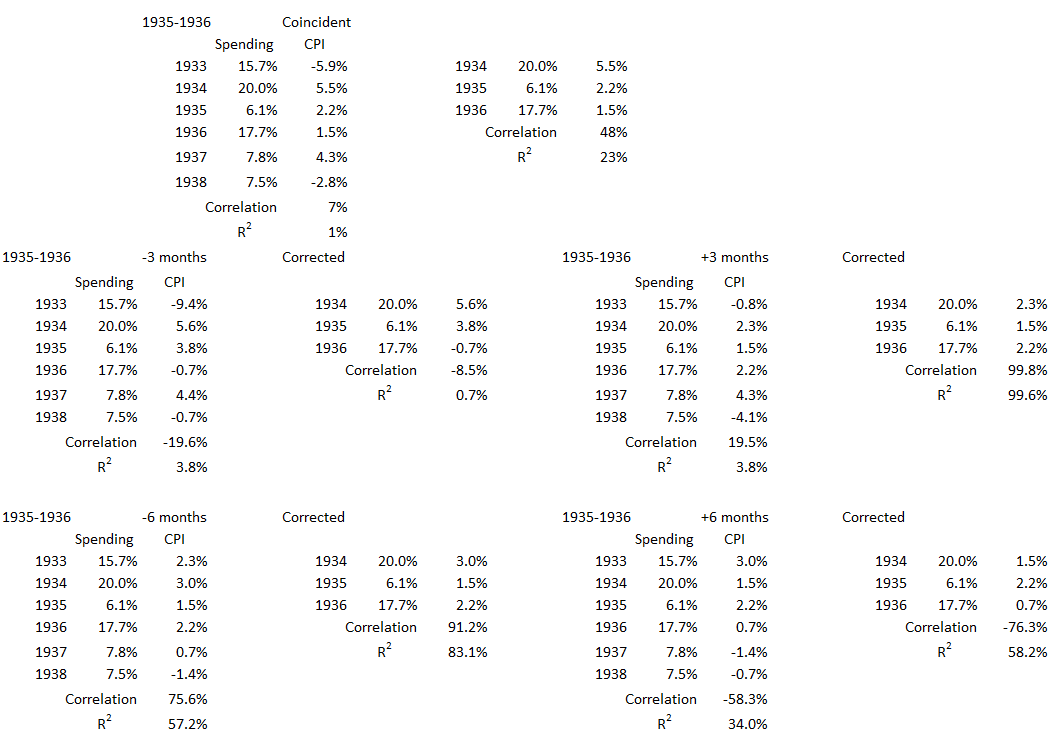
The association of deficit spending with coincident inflation for the six-year period is nil (R2 < 1%, R = 7%). But for the two years with declining inflation, there is a weak association (R2 = 23%, R = 48%).
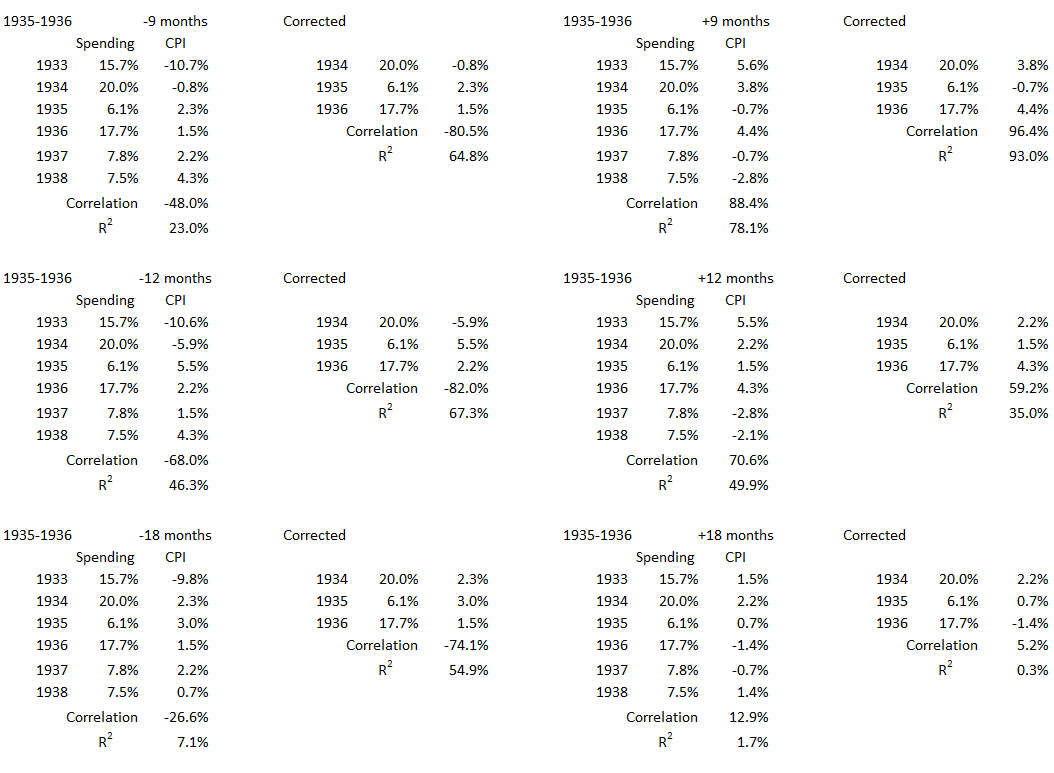
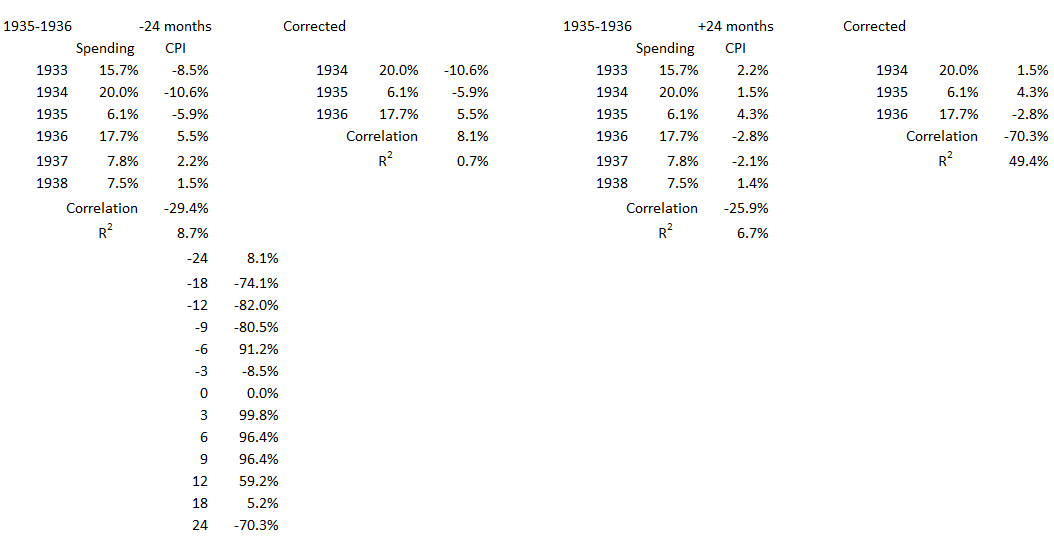
Figure 12. Correlation Between Deficit Spending and Inflation 1935-1936
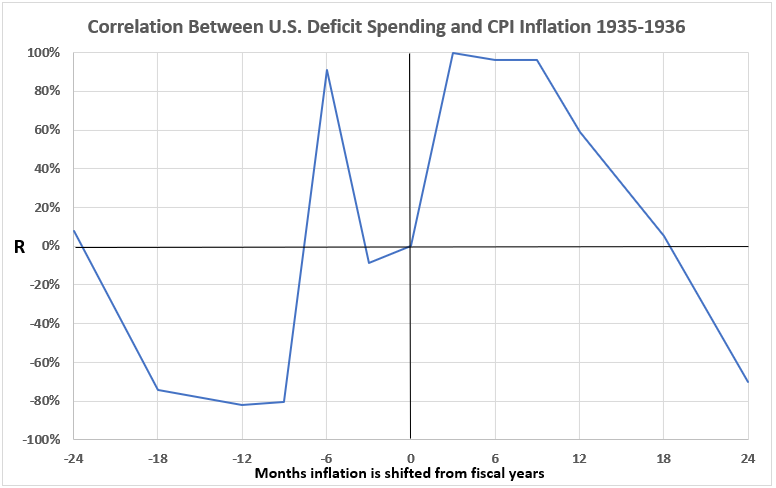
The possibility of decreased deficit spending causing deflation 3, 6, and 9 months later is significant. There is also a significant association between decreased inflation and lower deficit spending six months later. The dip in inflation coincidentally and three months prior to spending raises questions about whether other factors may be involved.
1938
The third-worst downturn of the 20th century was the recession from May 1937 until June 1938. This covers the fiscal year 1938 and the two months preceding it. Real GDP declined 10% and unemployment, which had improved to <10% in 1936 and 1937, increased to 20%. This was less severe than the recessions of 1920 and 1929 but was still a major economic blow.
Figure 13. U.S. Federal Deficit Spending and Inflation for the Fiscal Years 1936-1939
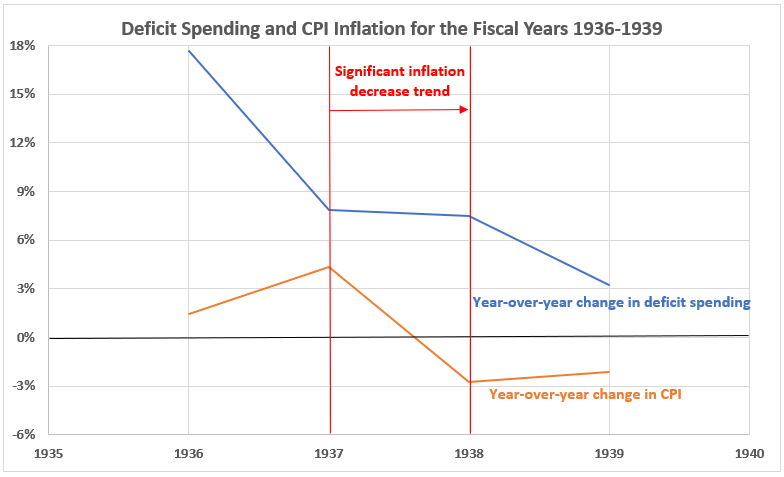
Inflation declined severely from 4.3% to –2.8% over the fiscal year 1938. It followed a precipitous reduction in deficit sending in the preceding year.
Figure 14. Annual Changes in Deficit Spending vs. Inflation for the Fiscal Years 1936-1939
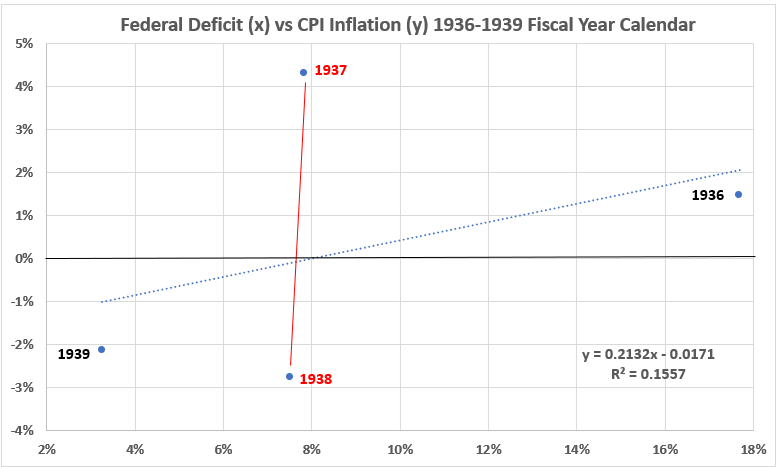
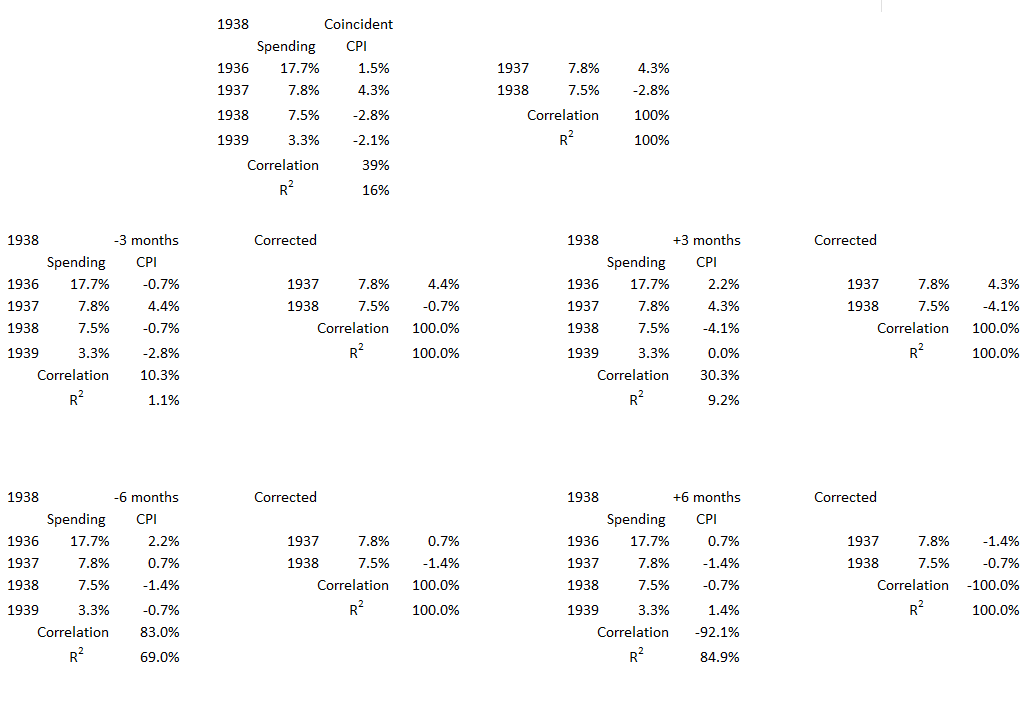
The association of deficit spending with coincident inflation over the total four years is weak (R2 = 16%, R = 39%). However, for the year 1938 R2 = 100% and R = 100%.
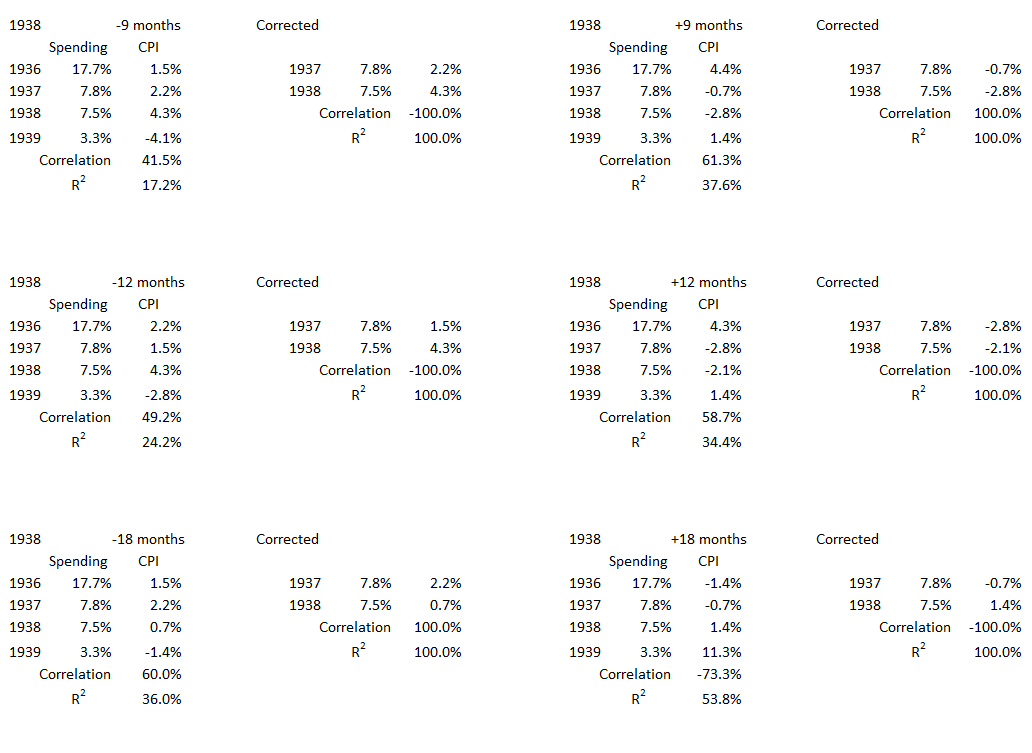
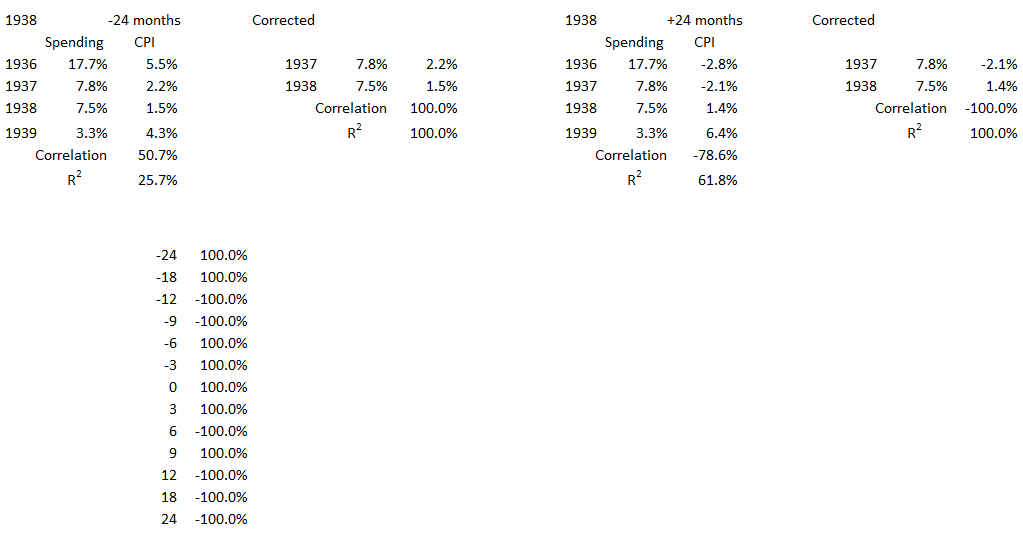
Figure 15. Correlation Between Deficit Spending and Inflation 1938
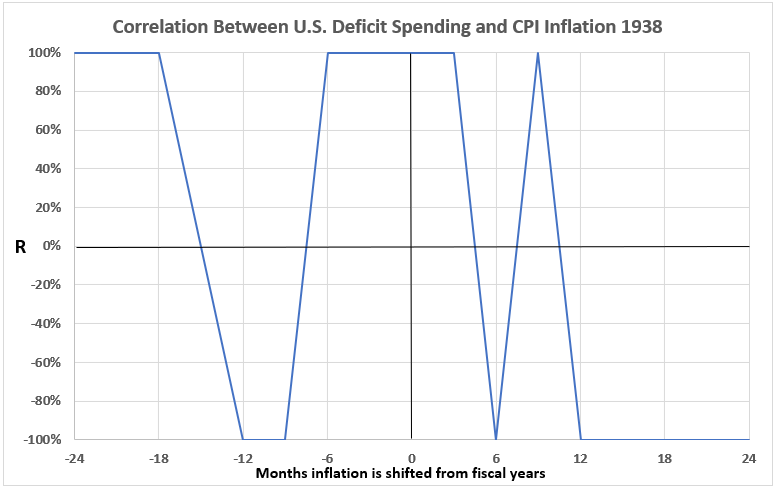
This graph shows what happens to inflation data shifted with respect to the fiscal year 1938 spending. It misses what would happen if the fiscal year were shifted with respect to inflation. In this latter case, the 1937 fiscal data would align with the 1938 inflation data. The result would be a 100% association of changes in deficit spending with changes in inflation one year later. This brings into question the usefulness of trying to do this graphical analysis for a single year of inflation. We should investigate the usefulness of using both a fixed fiscal year and testing inflation alignments and a fixed inflation year with testing fiscal alignments.
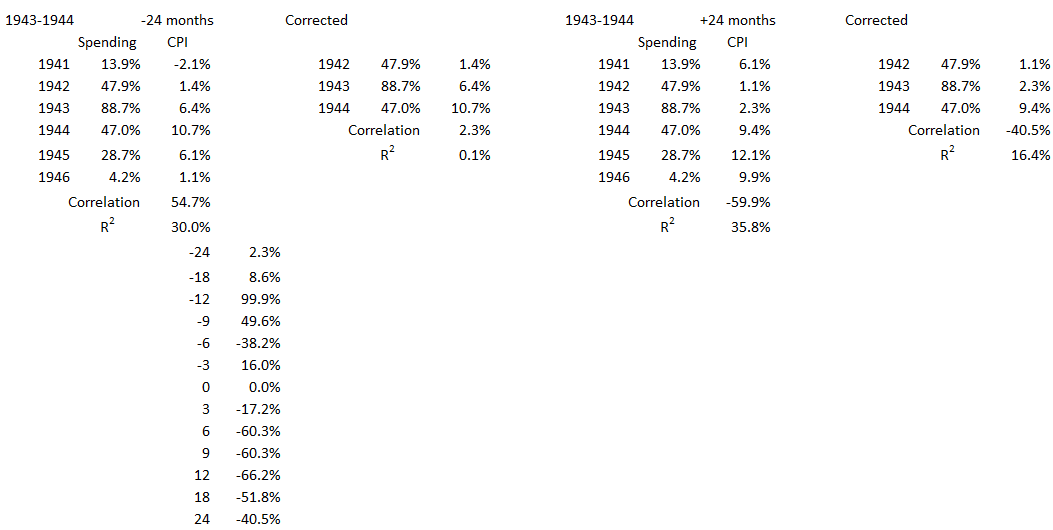
1943-1944
These two years are in the middle of World War II. The nation was under comprehensive price controls and rationing, so the value of trying to look at other factors affecting inflation is problematic.
Figure 16. U.S. Federal Deficit Spending and Inflation for the Fiscal Years 1941-1946
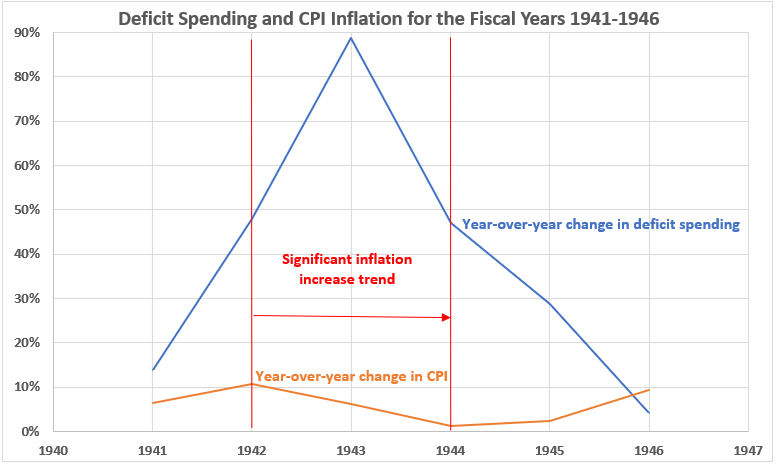
Wage and price controls, as well as rationing, prevented consumer reaction to the large deficit spending amounts in these two years. Inflation fell from > 10% at the start of fiscal 1943 when price controls were just being implemented to 1.1% by the end of fiscal 1944.
Figure 17. Annual Changes in Deficit Spending vs. Inflation for the Fiscal Years 1941-1946
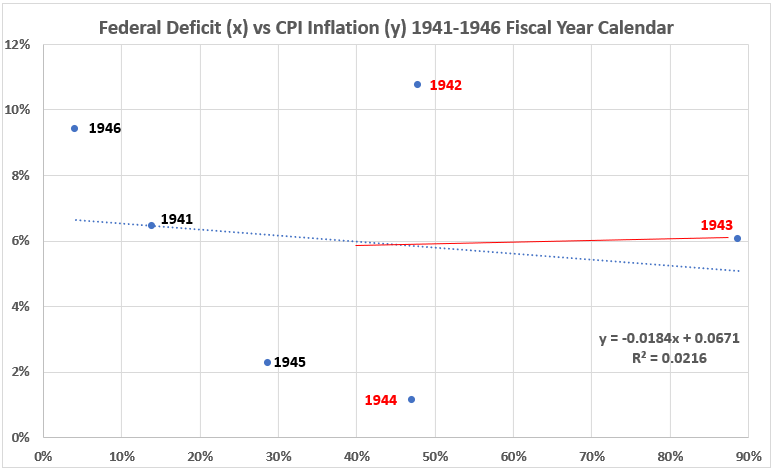
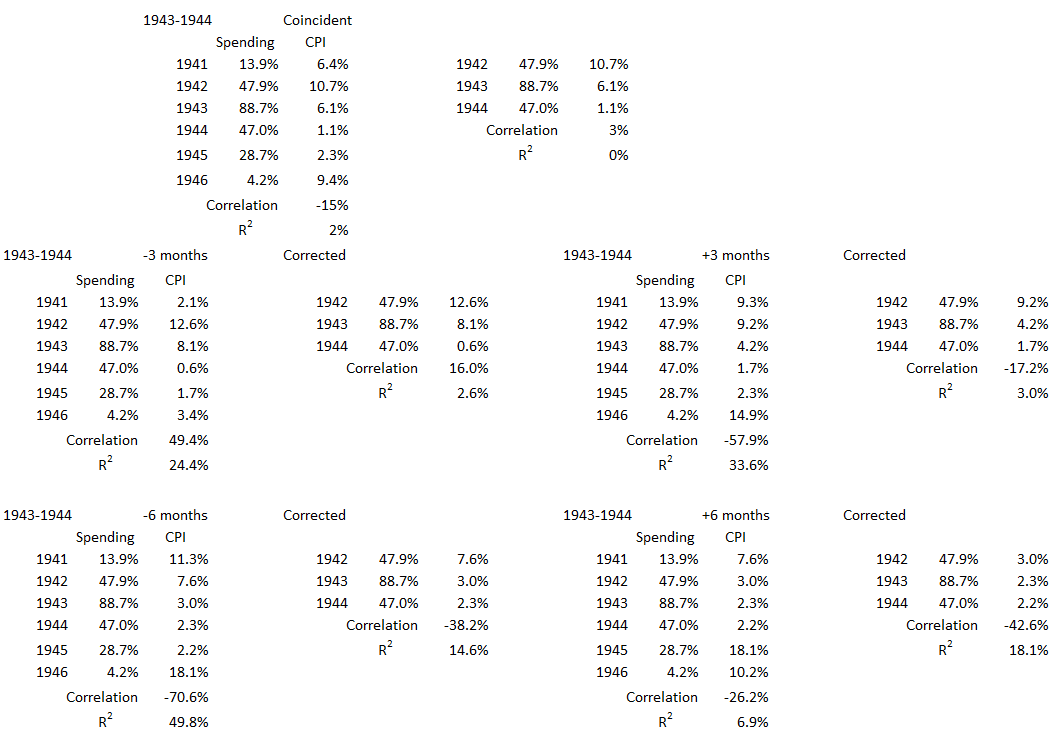
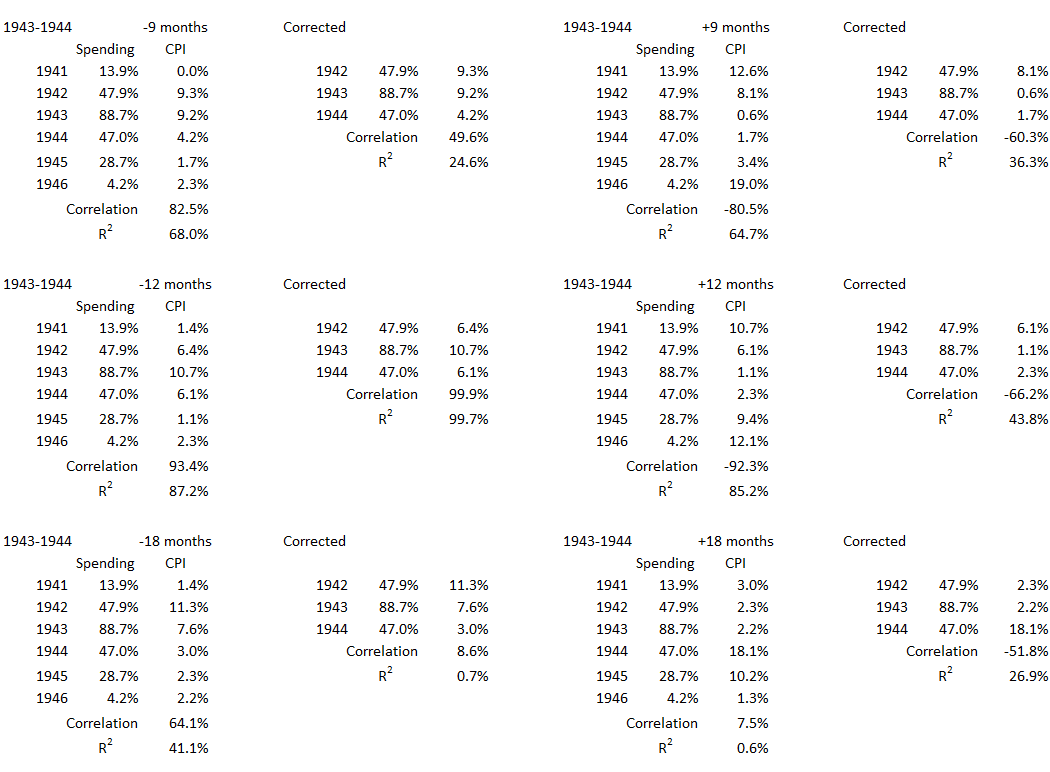
The correlations between deficit spending and coincident inflation are nil or negative for both the entire six-year period and the two deflationary years 1943 and 1944.
Figure 18. Correlation Between Deficit Spending and Inflation 1943-1944
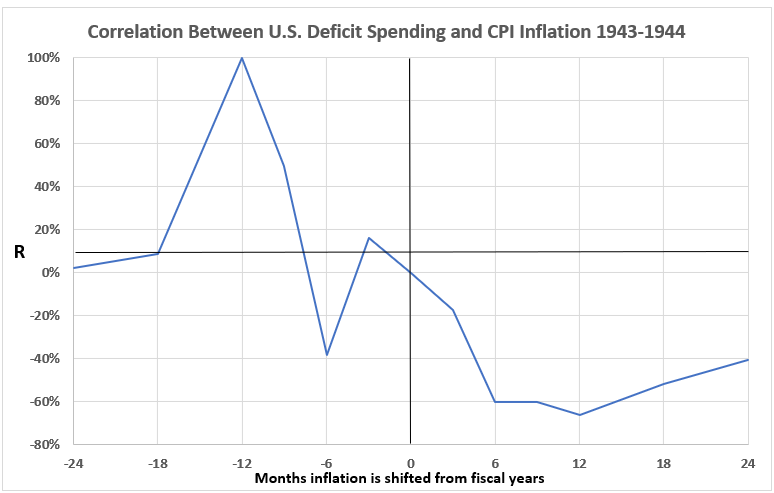
There is a significant correlation between deficit spending and inflation twelve months earlier but that is likely circumstantial because the needs of the war effort clearly drove deficit spending. And as mentioned before, wage and price controls, plus rationing prevented any consumer response to the deficit spending during these two years.
Conclusion
The discussion of these results and a conclusion are deferred until Part B is posted, hopefully, next week.
Appendix
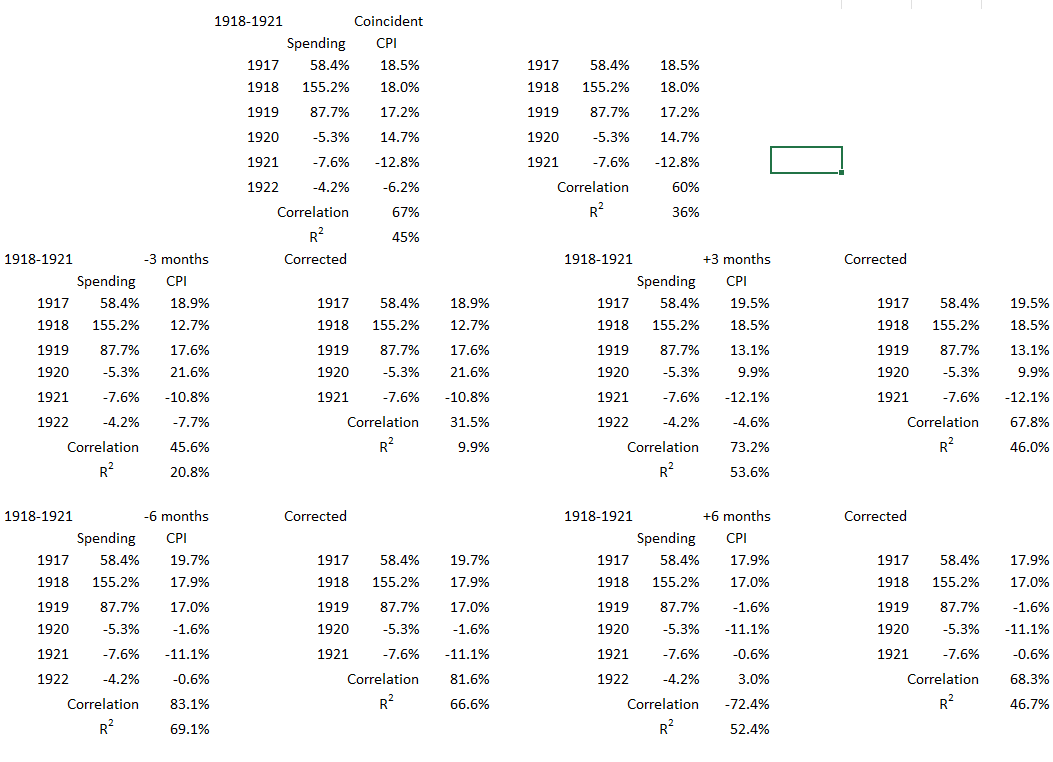
In this appendix, we show all the data selections from the tables in Part 13A, Appendix 1,5 used to analyze each significant deflationary period.
1918-1921
1926
1930-1932
1935-1936
1938
1943-1944
Footnotes
1. Lounsbury, John, “Government Spending and Inflation. Part 13A”, EconCurrents, June 4, 2023. https://econcurrents.com/2023/06/04/government-spending-and-inflation-part-13a/
2. Lounsbury, John, “Government Spending and Inflation. Part 13B”, EconCurrents, June 25, 2023. https://econcurrents.com/2023/06/25/government-spending-and-inflation-part-13b/
3. Lounsbury, John, “Government Spending and Inflation. Part 11”, EconCurrents, May 7, 2023.
https://econcurrents.com/2023/05/07/government-spending-and-inflation-part-11/.
4. San Francisco Fed, “What is deflation and how is it different from disinflation?”, Federal Reserve Bank of San Francisco, September 1999. https://www.frbsf.org/education/publications/doctor-econ/1999/september/deflation-disinflation-causes/
5. Lounsbury, John, “Government Spending and Inflation. Part 13A, Appendix 1”, EconCurrents, June 4, 2023. https://econcurrents.com/2023/06/04/government-spending-and-inflation-part-13a/
6. Carson, W. J., “Economic Developments in United States in 1926”, Editorial research reports 1926 (Vol. IV), CQ Researcher archives. http:/