This is a continuation of the analysis of each significant period of rising inflation since 1914. The first part1 covered the years up to the start of World War II. In this post, we cover the inflationary periods following World War II through 2022.

Photo by Alexander Grey on Unsplash.
Introduction
We have determined that it is necessary to characterize each of the individual periods with significant inflation increases or decreases within the 108 years 1914-2022 to determine what (if any) time variation patterns of the correlations between deficit spending and consumer inflation existed over these years. See Part 13A, Introduction,1 for more details.
Data
The time series and correlations for the two data sets (inflation and federal government deficit spending) coincident for each federal fiscal year as well as inflation offsets by ±3, ±6, ±9, ±12, ±18, and ±24 month amounts with respect to the fiscal years. The thirteen data tables are shown in Appendix 1 of Part 13A.2
The periods of significant increases in inflation are given in Table 1, corrected from what was posted previously.3
Table 1. Periods of Significant Increases of Inflation 1914-2022

The first four inflationary periods (A, C, F, and I) were covered in Part 13A. The remaining six are covered here.
Analysis
1945-1947
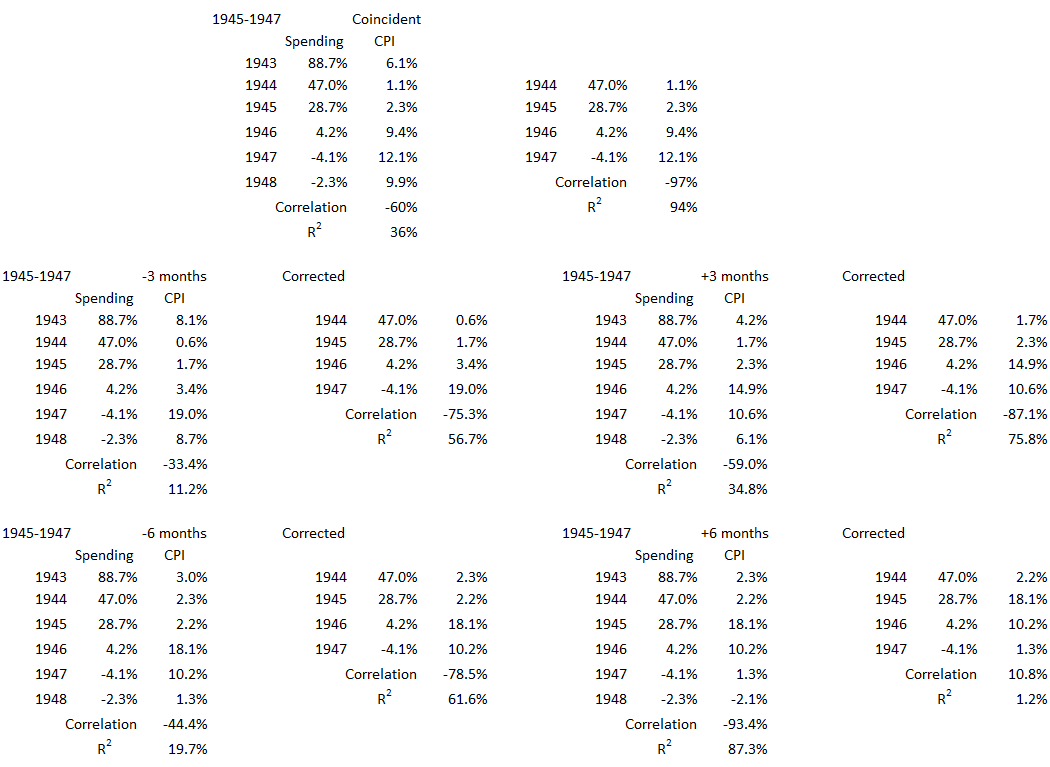
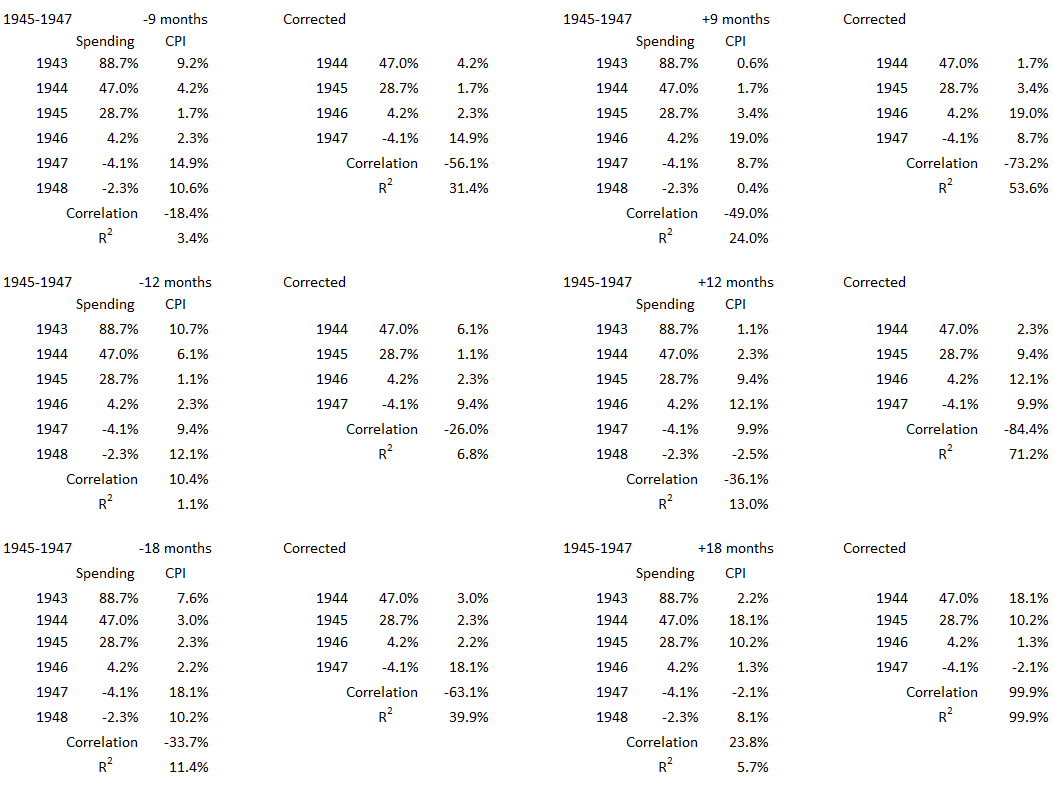
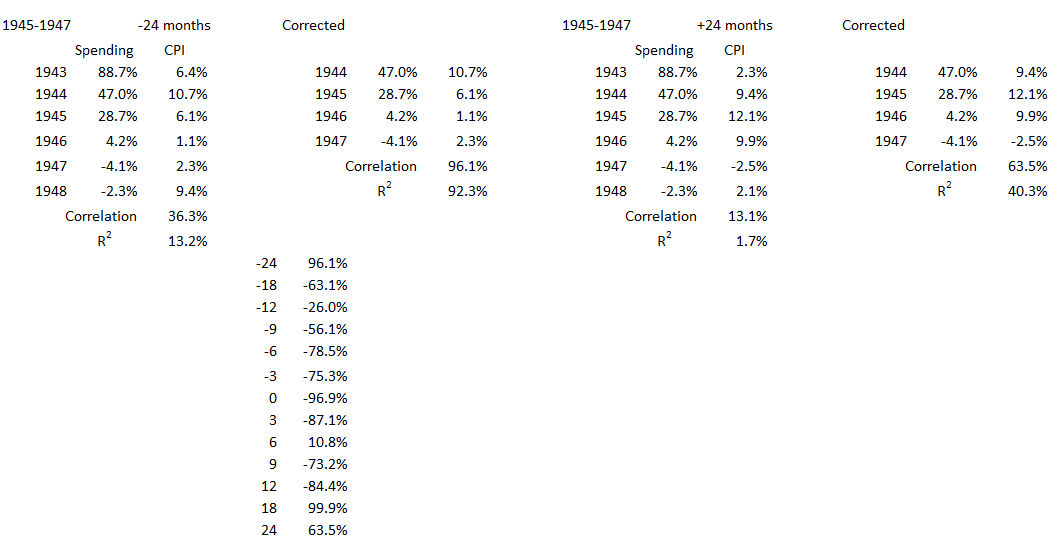
This period covers the year in which World War II ended and the following two years. The specific data extracted from the tables in Part 13A, Appendix 12 is shown in the Appendix below. The following three figures are created from that data.
Figure 1. U.S. Federal Deficit Spending and Inflation for the Fiscal Years 1943-1948
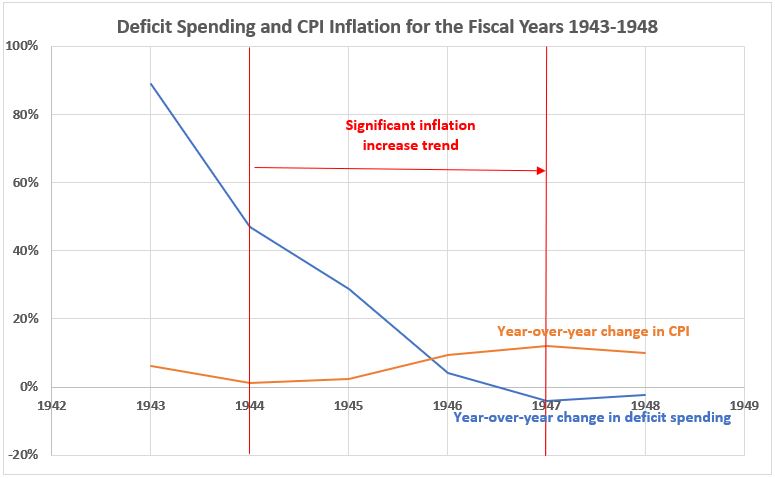
The comparatively modest inflation in 1945 surged in 1946 and 1947 as wartime wage and price controls were removed in 1946. Year-over-year inflation was 1.1% at the start of 1945 and rose to 12.1% by the end of 1947. Federal deficit spending declined sharply throughout this period. The budget was actually in surplus for fiscal 1947.
Figure 2. Annual Changes in Deficit Spending vs. Inflation for the Fiscal Years 1943-1948
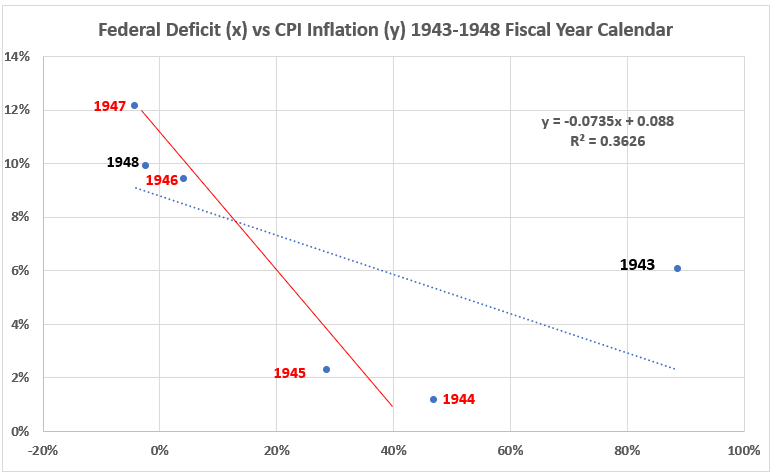
The trendline for the entire six years of data (blue dots) has a significantly smaller slope for the time period 1943-1948 than does the trendline for the inflation surge years 1945-1948 (solid red). The R2 value for 1939-1942 with inflation coincident is larger (94%, see Appendix) than for the entire six years shown in the graph (36%). For this data, all the correlation coefficients are negative. R= -60% for the entire six years and -97% for the three-year inflation surge. See data in the Appendix and Figure 3 below, coincident data.
Figure 3. Correlation Between Deficit Spending and Inflation 1945-1947
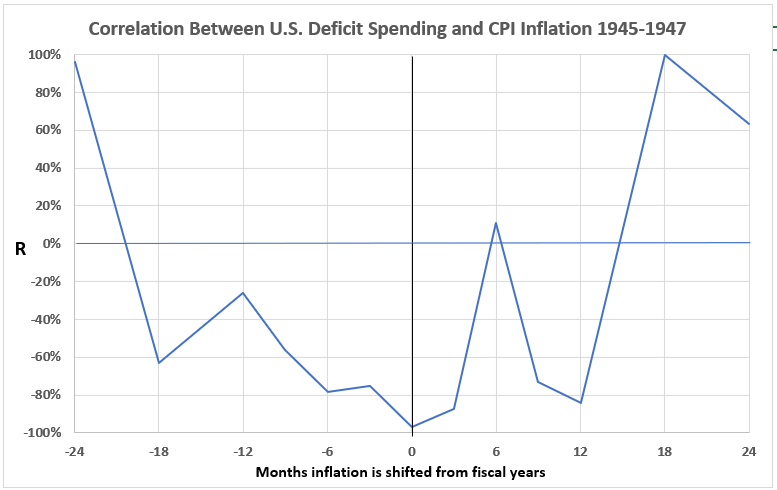
There are negative associations between inflation and government deficit spending for all timeline offsets between inflation leading spending by 18 months and trailing by 12 months, except for the null value for inflation trailing spending by 6 months. This is not surprising considering that wage and price controls were in effect for about half of this period.
The significant positive association for spending leading to inflation 18 and 24 months later resulted from the pent-up demand released after the rationing during World War II ended, servicemen returning home, and the spending of excess savings accumulated during the war.
1950-1951
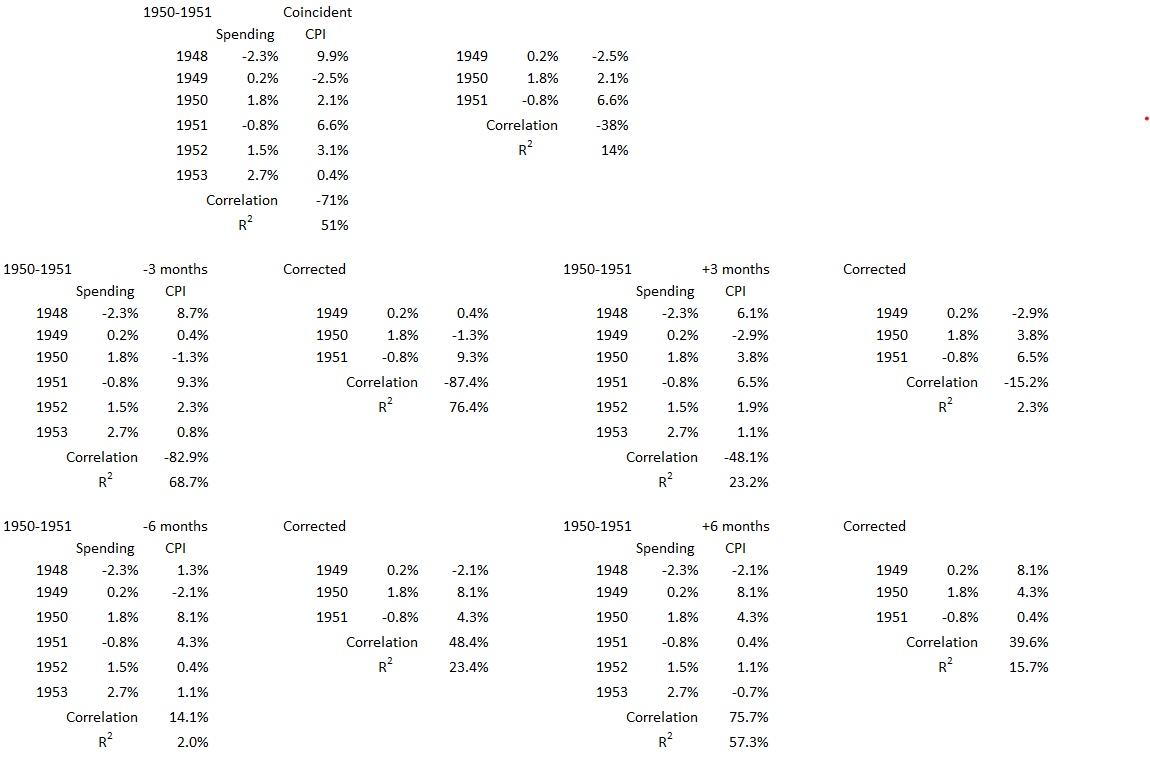
This inflation surge occurred during the first two years of the Korean War (1950-53). Here wage and price controls were less ubiquitous than during World War II.
Figure 4. U.S. Federal Deficit Spending and Inflation for the Fiscal Years 1948-1953
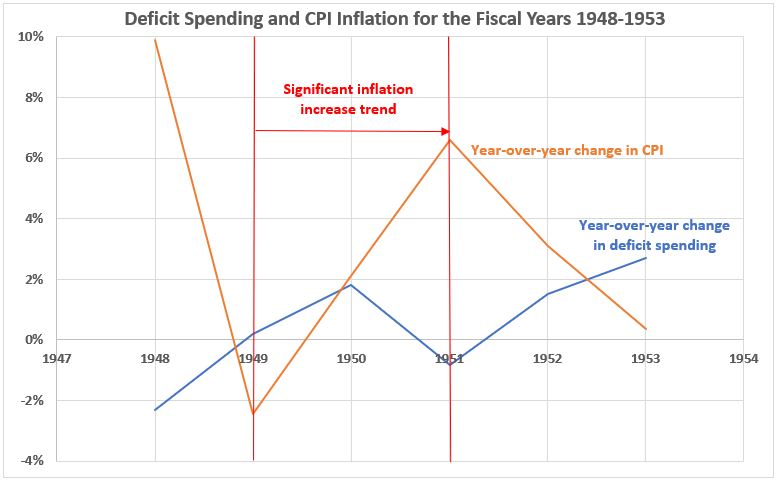
Two notable things here:
- Inflation volatility is unusual. For most other periods of significant inflation, the volatility in government deficits has been similar to or greater than inflation volatility.
- This period saw two years with negative changes in deficits from the preceding year (1948 and 1951). This is unusual for the post-WWII era.
Figure 5. Annual Changes in Deficit Spending vs. Inflation for the Fiscal Years 1948-1953
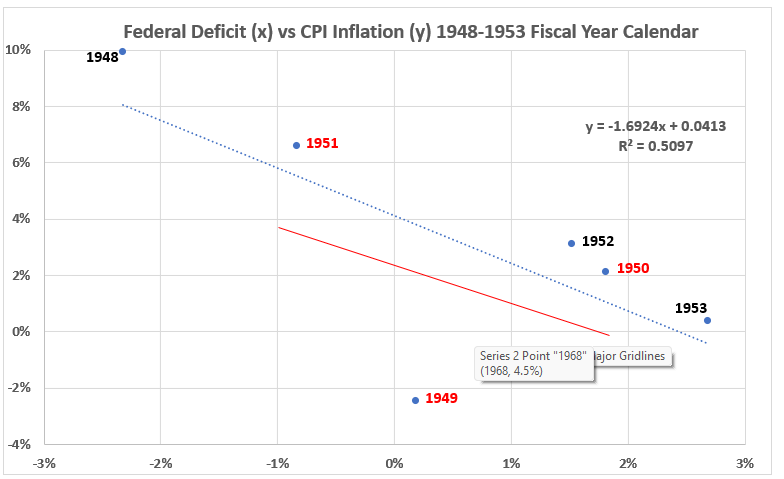
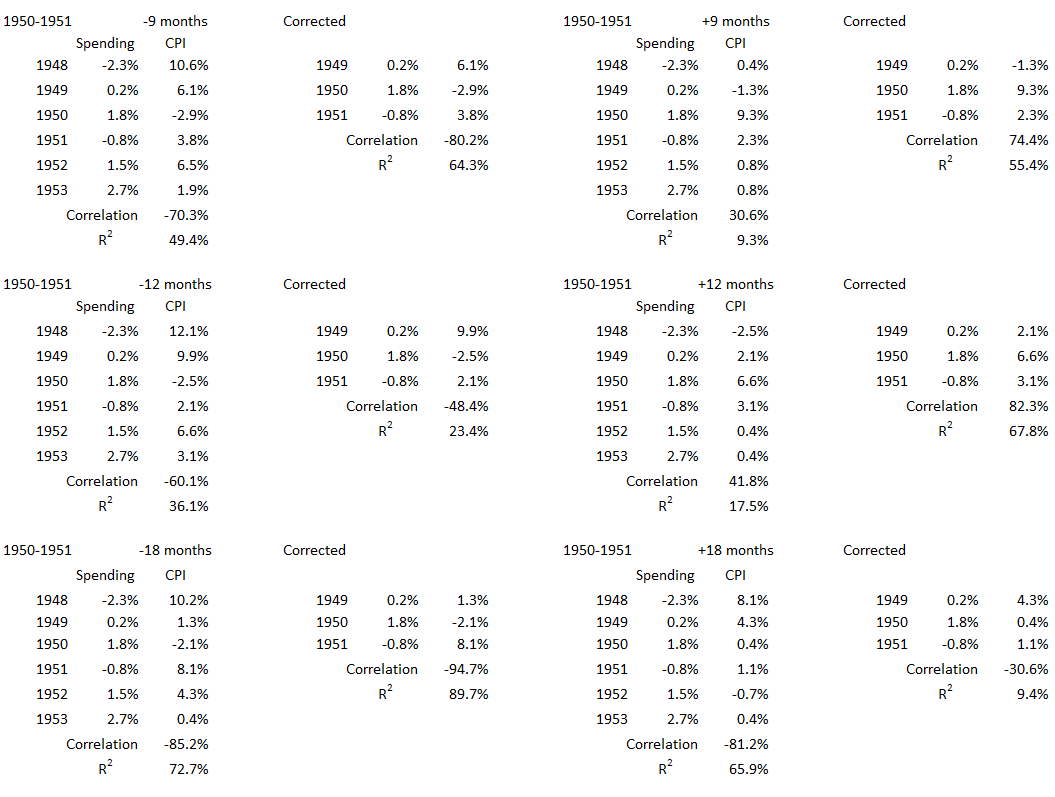
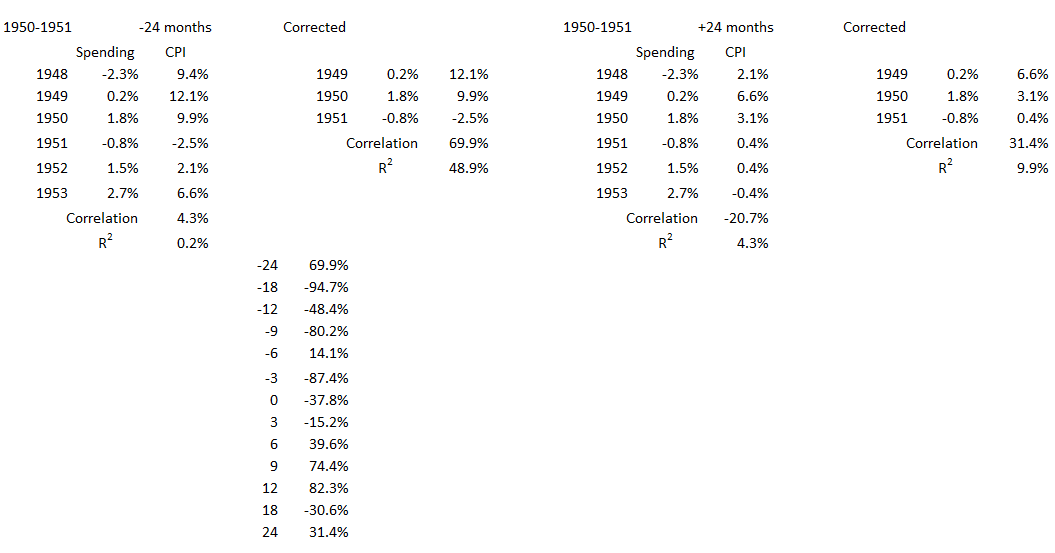
The trendline slopes are very similar for the entire six years of data (blue dots) and for the inflation surge years 1950-1951 (solid red). The R2 value for 1950-1951 with inflation coincident is larger (51%, see Appendix) than for the entire six years shown in the graph (14%). For this data, all the correlation coefficients are negative. R= -71% for the entire six years and -38% for the two-year inflation surge. See data in the Appendix and Figure 3 below, coincident data. The year 1949 looks like an outlier in this data. When it is omitted, the R values are -100% for both the two remaining red years and the total five remaining years. (Looking back at Figure 4, this result is not surprising.)
Figure 6. Correlation Between Deficit Spending and Inflation 1950-1951
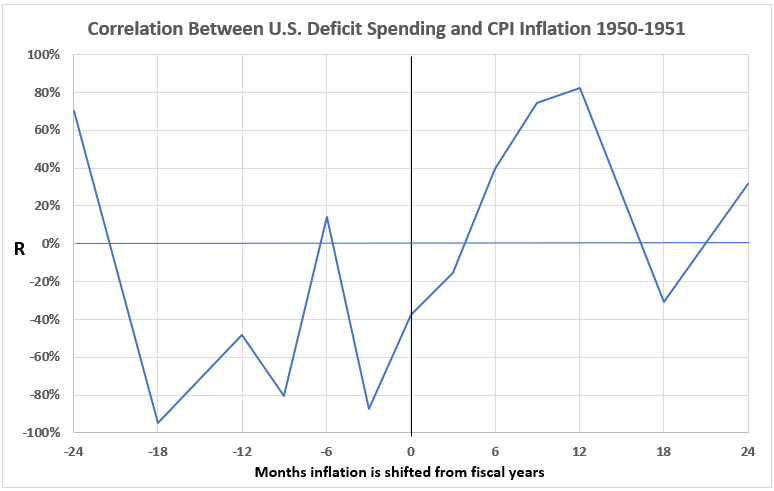
There are mostly negative associations for inflation leading to deficit spending. The exceptions are for inflation showing a significant correlation with spending 24 months later and a very weak correlation for inflation six months before deficit spending. This is reasonably summarized by saying there is no indication of the possibility that inflation caused increased spending during this time period.
The data on the RHS shows a weak association between deficit spending and inflation six months later, and a significant association for deficit spending with inflation nine and twelve months later. This is summarized by saying that there is a possibility that deficit spending was a cause of inflation during this period.
1960-1969
This period includes the first years of U.S. participation (1964-75) in the Vietnam War (1955-75).
Figure 7. U.S. Federal Deficit Spending and Inflation for the Fiscal Years 1959-1970
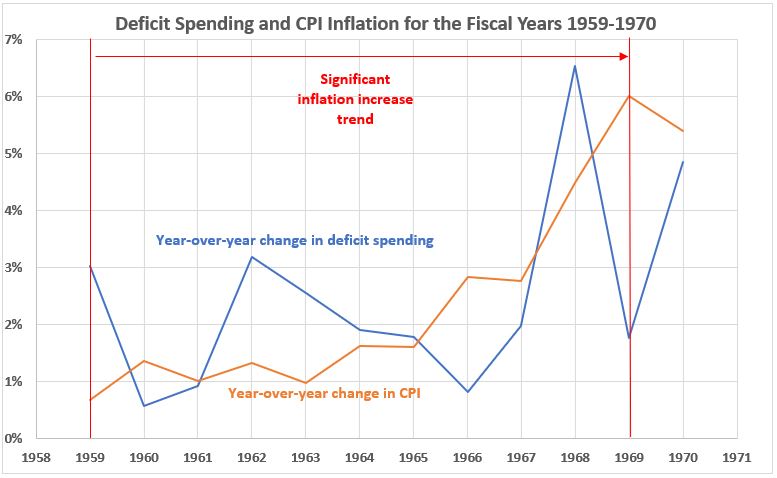
The general trend through this decade-long inflation surge is that both deficit spending and inflation were increasing. But visually the correlations are all over the place. Timeline offset analysis may make some sense of this.
An important observation s that inflation was increasing at a very slow rate through 1963 (only a 0.3% total increase for the four years 1960-1963). The rate increased as the U.S. involvement in the Vietnam War started in 1964 and surged much more in the following years as the war intensified.
Figure 8. Annual Changes in Deficit Spending vs. Inflation for the Fiscal Years 1959-1970
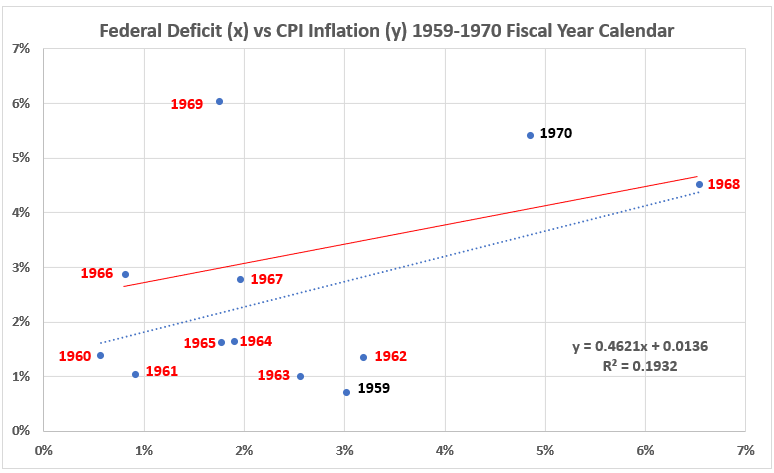
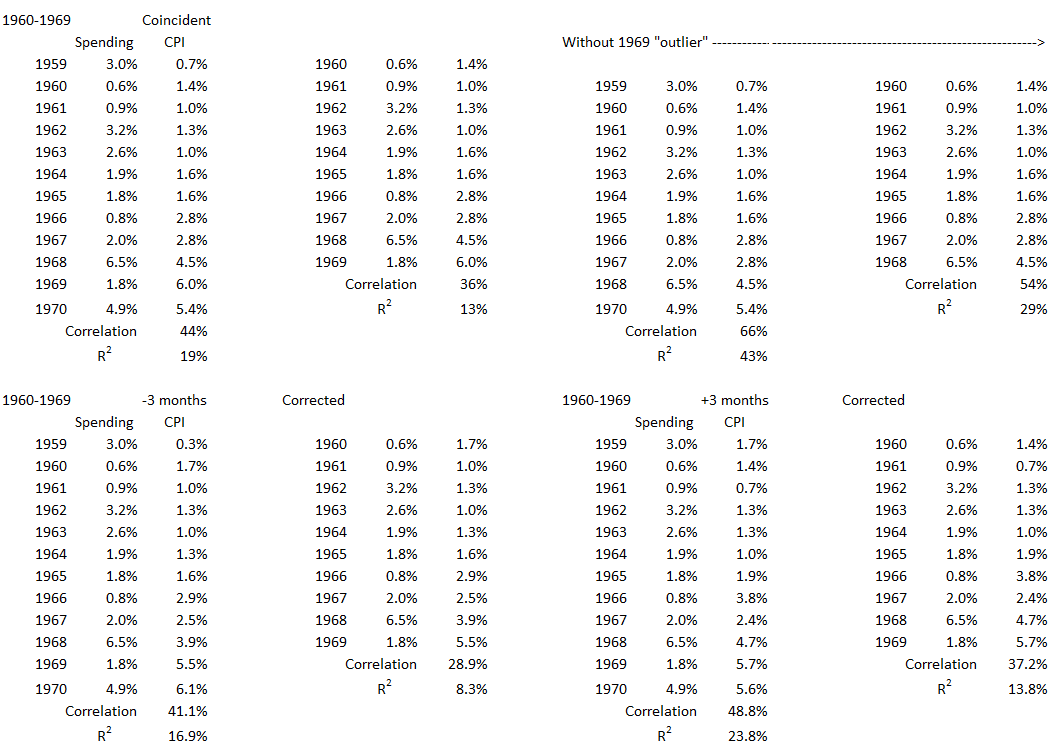
The trendline slopes are very similar for the entire twelve years of data (blue dots) and for the inflation surge years 1960-1969 (solid red). The R2 value for 1960-1969 with inflation coincident is a little smaller (13%, see Appendix) than for the entire twelve years shown in the graph (19%). For this data, all the correlation coefficients are positive. R= 44% for the entire twelve years and 36% for the ten-year inflation surge. See data in the Appendix and Figure 9 below, coincident data. The year 1969 looks like an outlier in this data. (Looking back at Figure 7, this result is not surprising.) When it is omitted, the R values are 66% (R2 = 44%) for the remaining 11 years overall and R = 54% (R2 = 29%) for the nine remaining red years. The year 1969 should not have an overwhelming impact on later conclusions because, while the R2 value for the surge years when 1969 is omitted does reach (just barely) a moderate level, it has a value far below 50% needed to dominate all other associations.
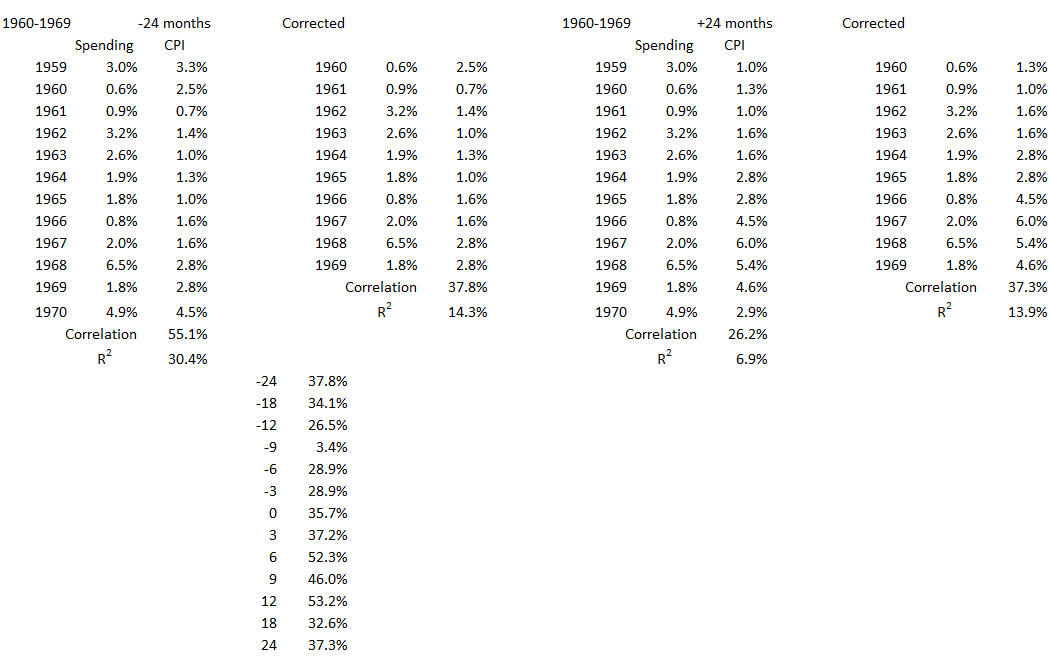
Figure 9. Correlation Between Deficit Spending and Inflation 1960-1969

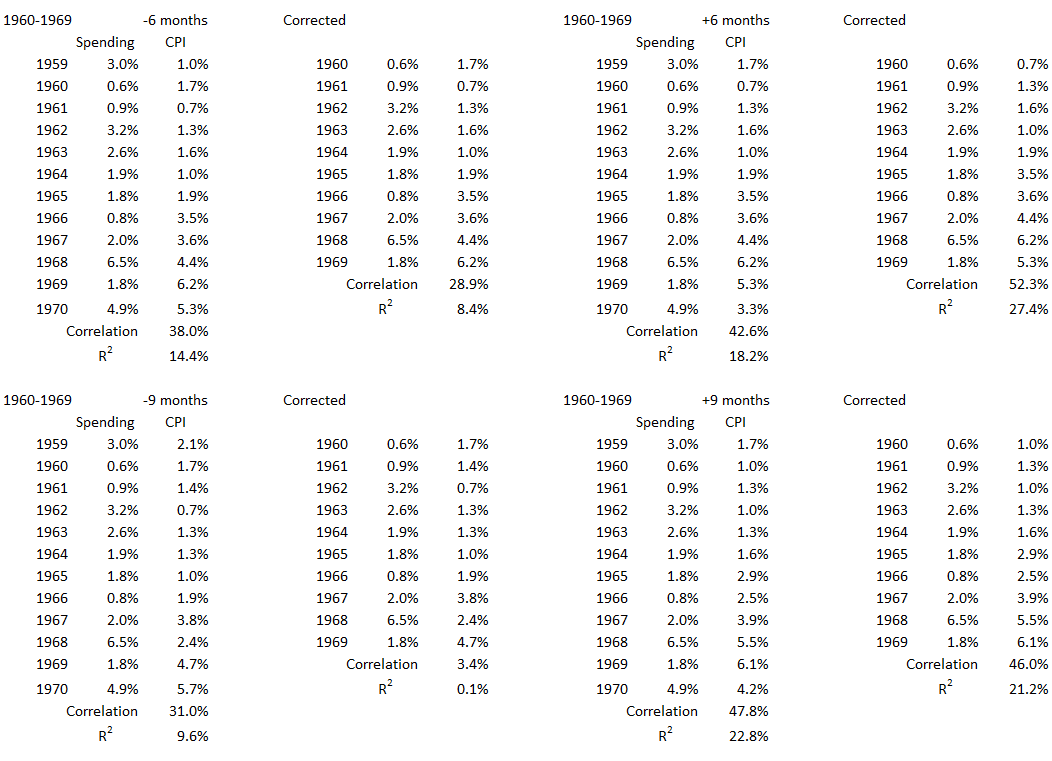
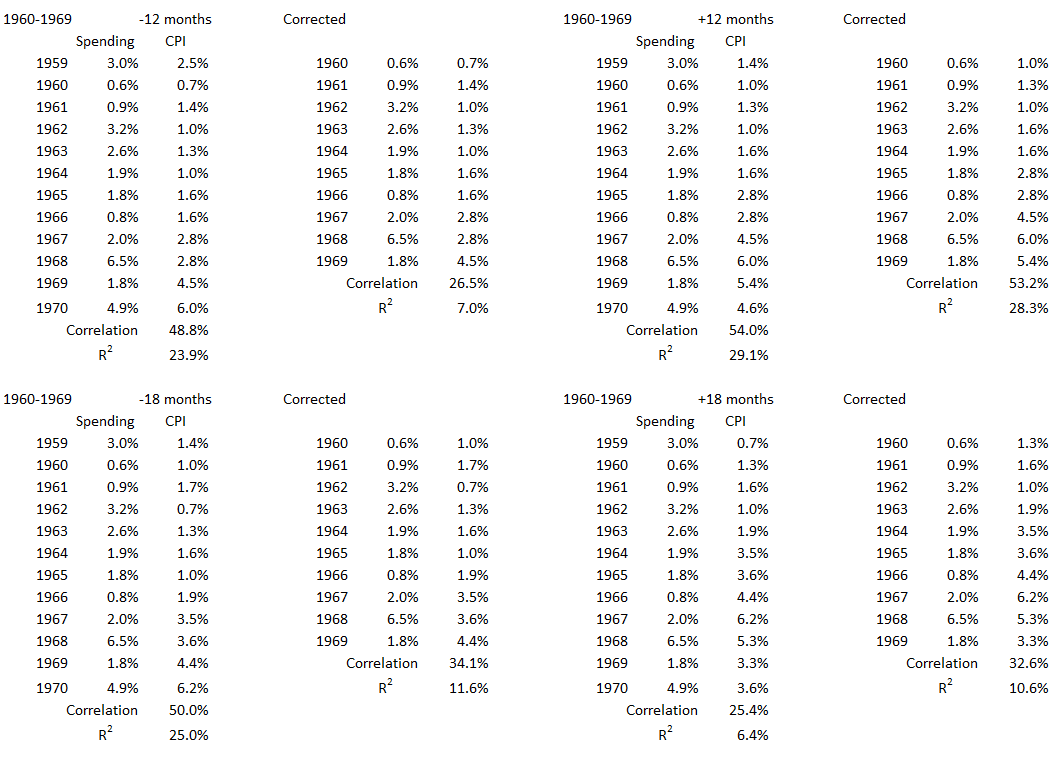
Nothing during the 1960s indicates a possibility that federal deficit spending was the major cause of inflation, or vice versa. All the R values for inflation offset from deficit spending by -24 months (inflation before spending) all the way to +3 (inflation following spending) have R2 values <12%, which is a very weak association.
During the offsets where inflation followed spending by 6, 9, and 12 months, 21%<R2<28%. This indicates the possibility that up to 28% of inflation could have been caused by federal government deficit spending for the 1960-1969 inflation surge.
1973-74
There was a lot going on at the time of this inflation surge. This period includes the last two full years of the Vietnam War which ended in 1975. It also covers the beginning of the severe recession from November 1973 to March 1975. Finally, the first oil shock (OPEC embargo) occurred between October 1973 and March 1974. The price of oil rose from $2.90 a barrel before the embargo to $11.65 a barrel in January 1974.
Figure 10. U.S. Federal Deficit Spending and Inflation for the Fiscal Years 1971-1976
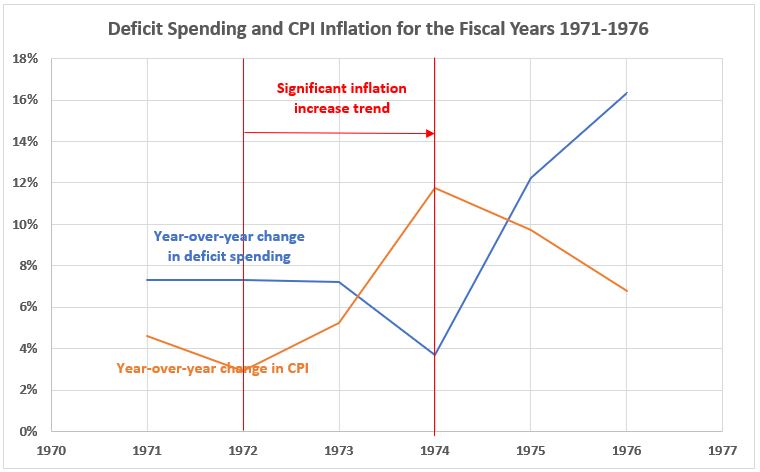
The graph looks quite unremarkable for 1971-1973. But for 1974-1976 deficit spending and inflation moved in opposite directions each year.
Figure 11. Annual Changes in Deficit Spending vs. Inflation for the Fiscal Years 1971-1976
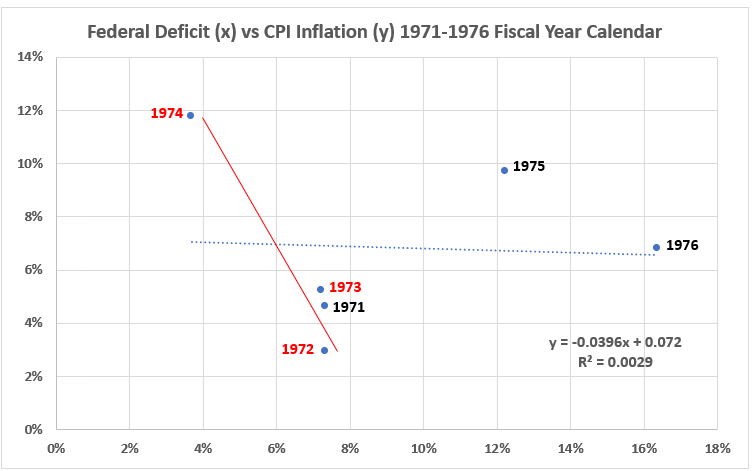
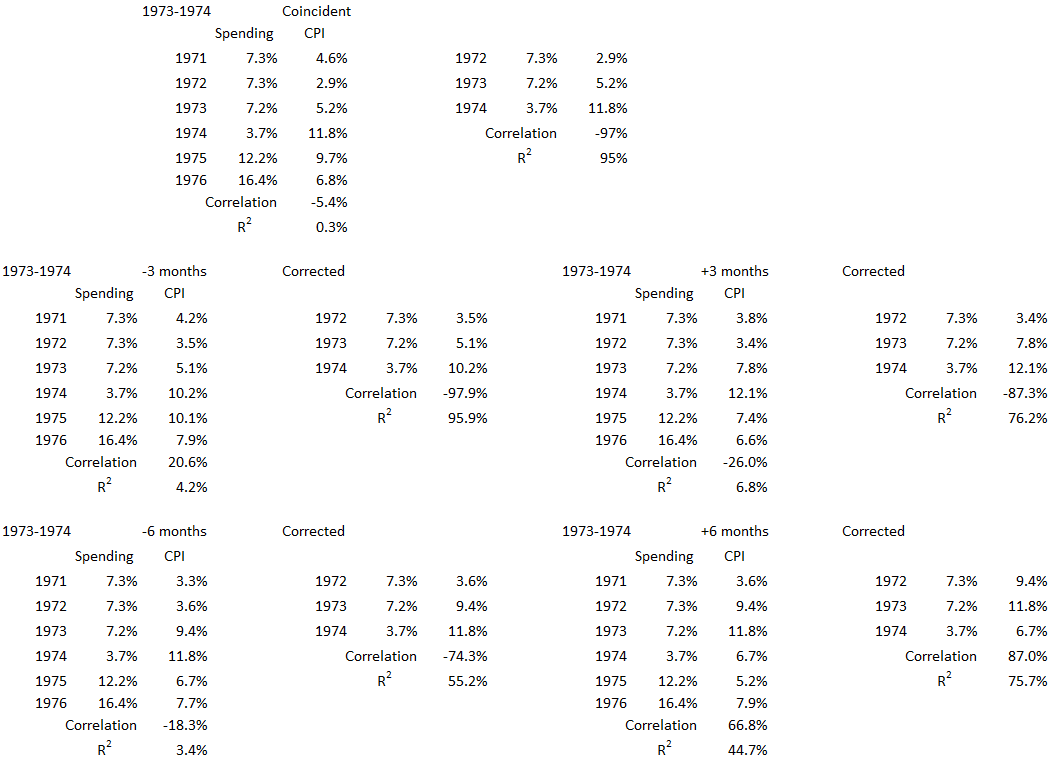
The additional understanding gained here is different than that derived from Figure 10. The inflation that occurred from the start of fiscal 1973 (end of fiscal 1972) through the end of fiscal 1974 is dramatic, rising from 2.9% to 11.8% over the 24 months. This can also be seen in Figure 10. But Figure 11 above emphasizes just how different the two inflation surge years are (R2 = 95%, R = -97%) from the total six years in which they are included (R2 = o.3%, R = -5.4%).
The first eight months of the severe 1973-1975 recession are included in the fiscal year 1974, as is the 300% surge in oil price. The recession caused a 6.9% year-over-year decline in U.S. GDP for calendar year 1974. This was a very painful occurrence of stagflation, a term first used in the UK during the 1960s.4
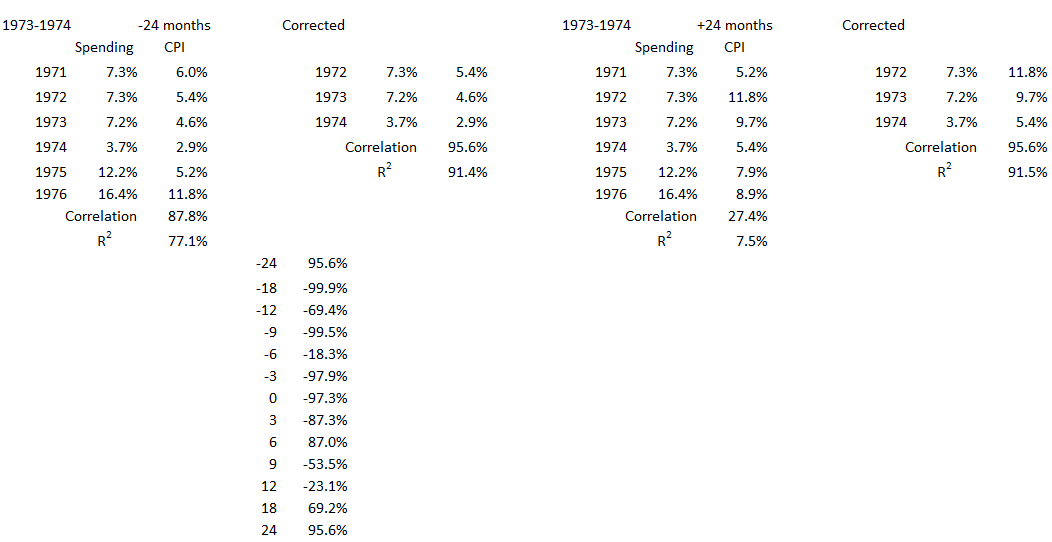
Figure 12. Correlation Between Deficit Spending and Inflation 1973-1974
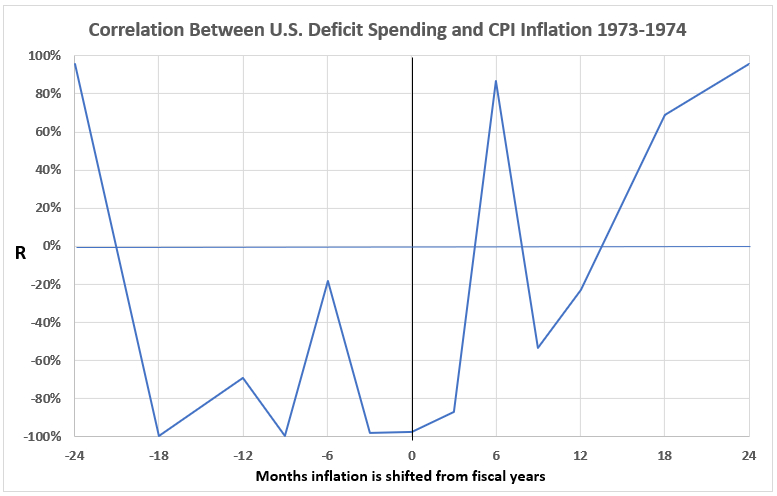
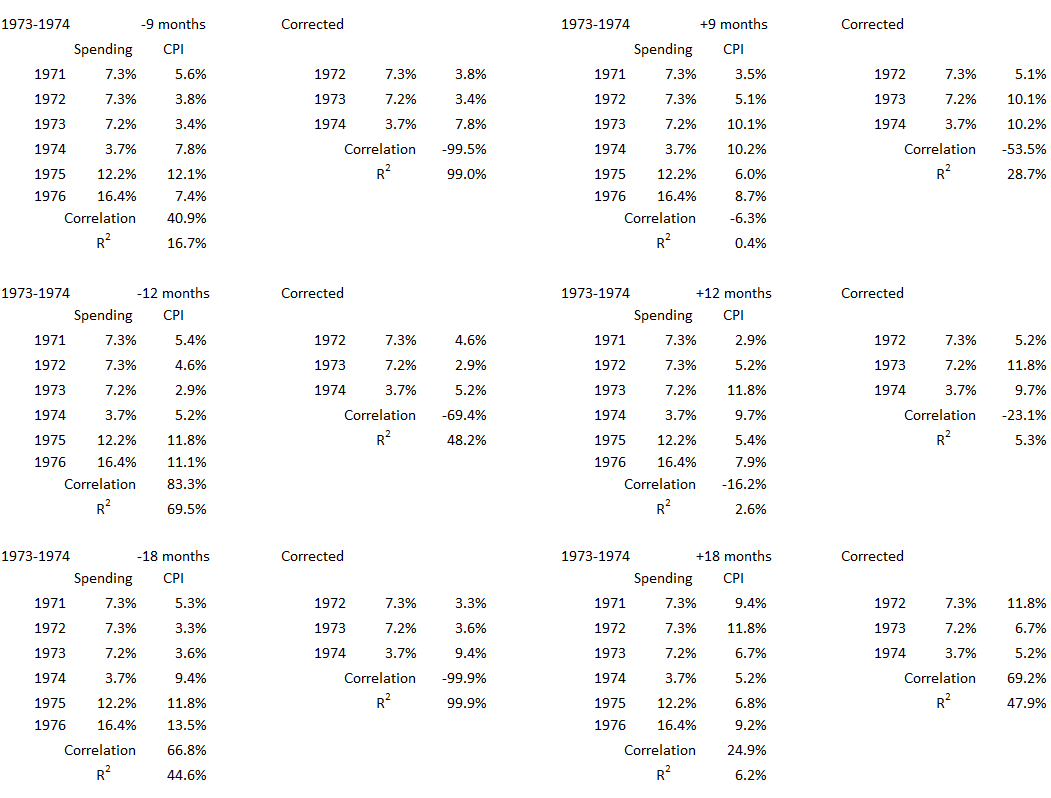
The only times with a significant association of deficit spending with inflation are for inflation 24 months earlier than spending and 6, 18, and 24 months after spending. For all other alignments, there are negative associations. Thus it appears that consumer inflation (CPI) is not a possible direct cause of increased federal deficit spending for this inflation surge.
On the other hand, the significant positive association when inflation is measured following federal spending by six months indicates it may be possible that federal deficit spending did contribute to inflation during the 1973-1974 inflation surge.
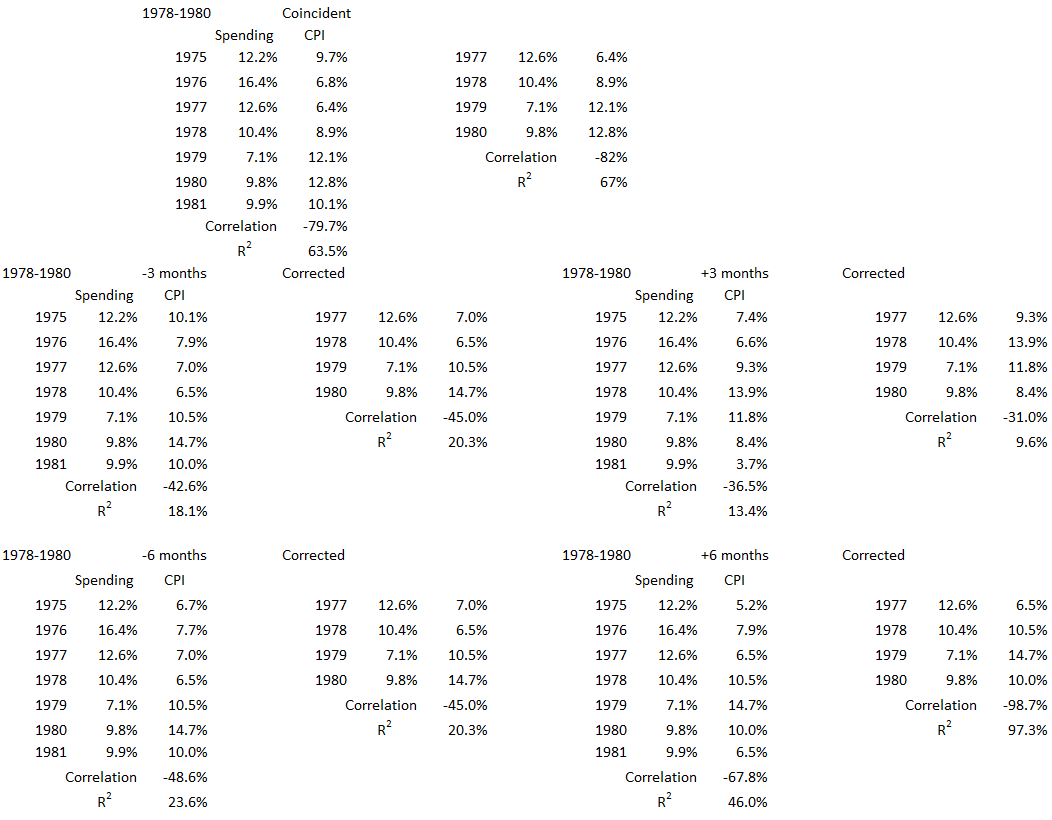
1978-1980
This inflation spike occurred during the second oil crisis of the 1970s. Reduced oil production resulting from the Islamic revolution in Iran was a key factor in doubling oil prices between April 1979 and April 1980. There was another occurrence of severe stagflation because of a recession from January to July 1980. A defining characteristic of this inflation surge was the concurrent spike in U.S. interest rates.5 At the start of fiscal 1978, the effective Fed Funds rate was 5.4%. By April 1980, the rate hit a then-record peak of 17.6%
Figure 13. U.S. Federal Deficit Spending and Inflation for the Fiscal Years 1975-1981
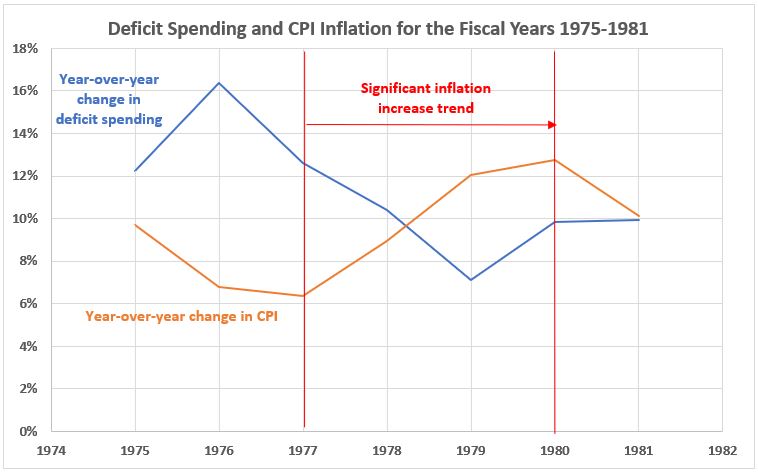
The general trend for the three years of this inflation surge was for decreasing percentages of deficit spending each year. This is a noted contrast to the increases in CPI each year.
Figure 14. Annual Changes in Deficit Spending vs. Inflation for the Fiscal Years 1975-1981
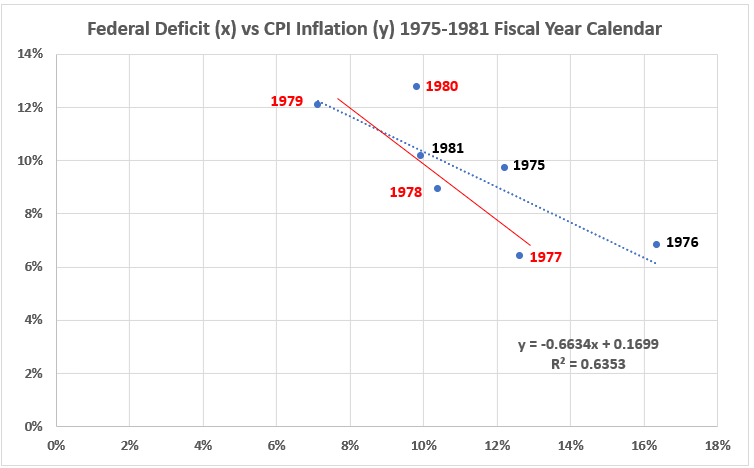
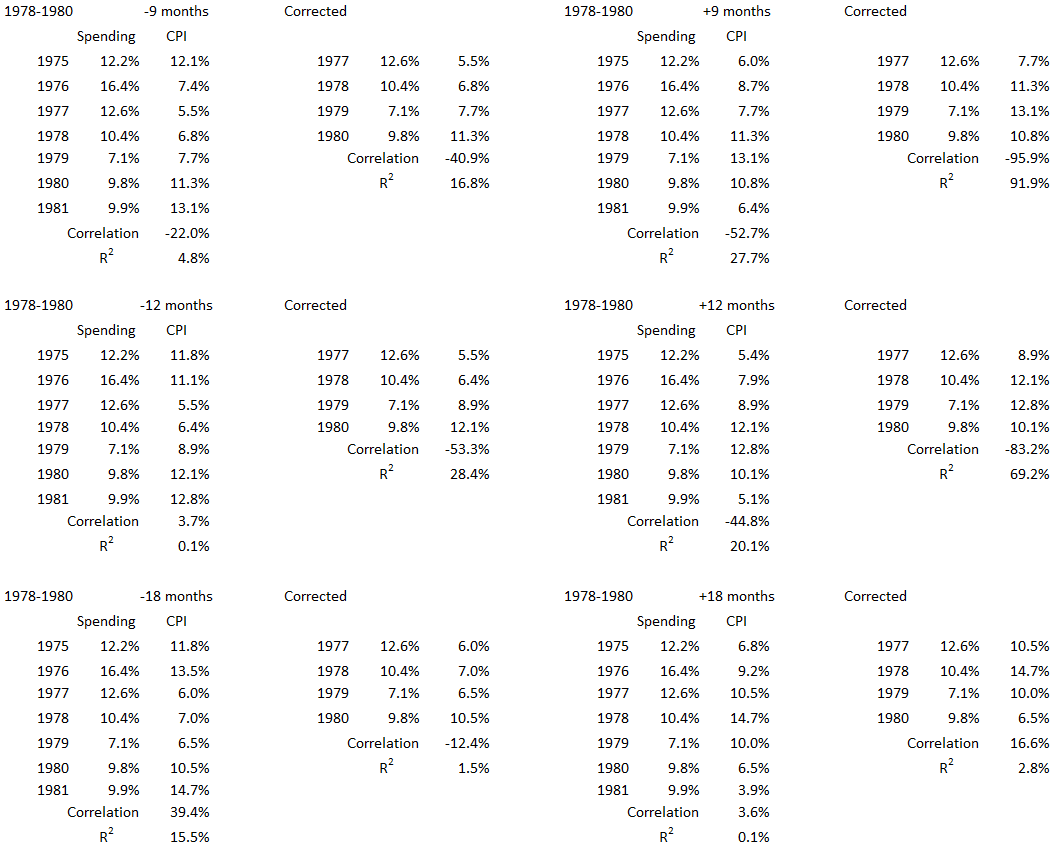
The high negative correlation (R = -82%) for the three-year inflation surge, as well as for the entire seven-year period, 1975-1981, R = -80%, leaves no room for cause and effect between federal government deficit spending and inflation for coincident data for these years. See Figure 15 for lead and lag effects, if any.
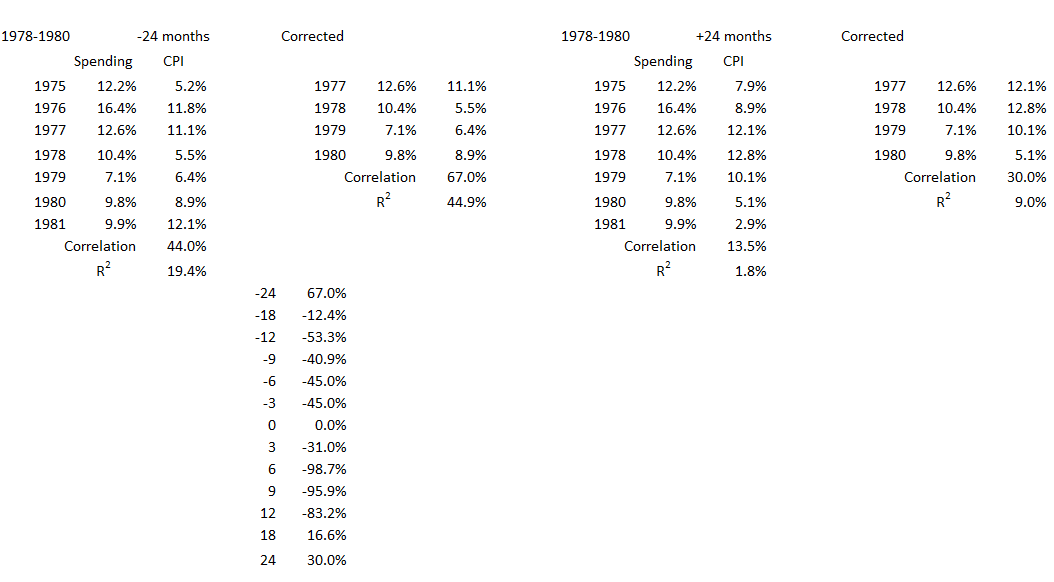
Figure 15. Correlation Between Deficit Spending and Inflation 1978-1980

The associations for all data offsets are negative except for inflation 24 months earlier than deficit spending and for inflation following deficit spending by 18 and 24 months. The latter two indicate only minor possible causations. For inflation 18 months after spending, R2 = 2.8%, and for 24 months lag R2 = 9.0%. This indicates that more than 90% of inflation causation came from sources other than deficit spending.
The association of inflation 24 months prior with deficit spending is large enough (R2 = 19%) that we cannot dismiss the possibility that inflation was a contributory cause for federal deficit spending increasing during the fiscal years 1978-1980.
2021-2022
The overriding influence on economic activity during this time period was the COVID-19 global pandemic which produced an economic slowdown from early 2020, lasting for at least two years with lingering aftereffects. A deep but short recession occurred from February 2020 to April 2020, a few months before the inflation surge started. (The fiscal year 2021 started in July 2020.).
Figure 16. U.S. Federal Deficit Spending and Inflation for the Fiscal Years 2021-2022
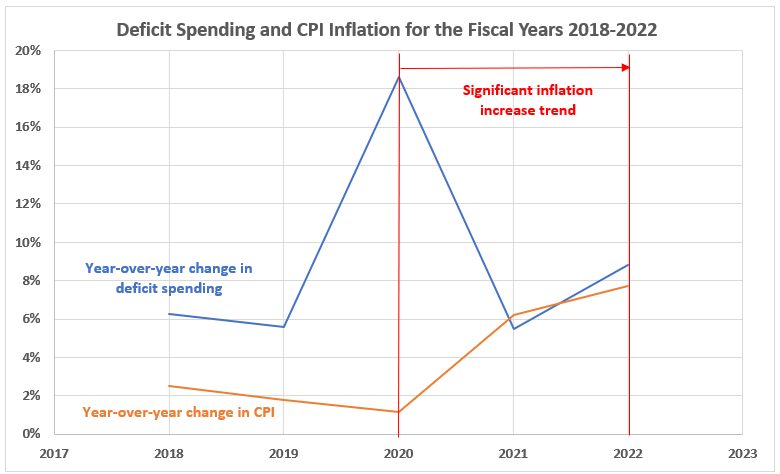
There was a large increase in federal deficit spending in fiscal 2020 at a time when consumer inflation was declining. It is likely that the spending surge in 2020 contributed to the inflation surge in 2021, continuing into 2022. Below we see what the correlations indicate.
Figure 17. Annual Changes in Deficit Spending vs. Inflation for the Fiscal Years 208-2022
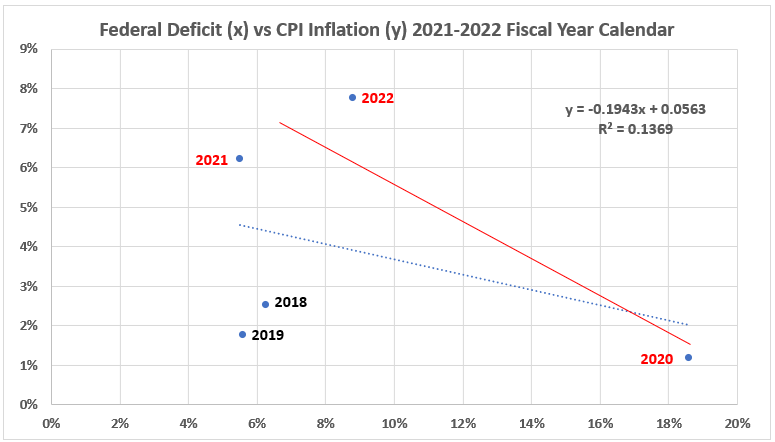
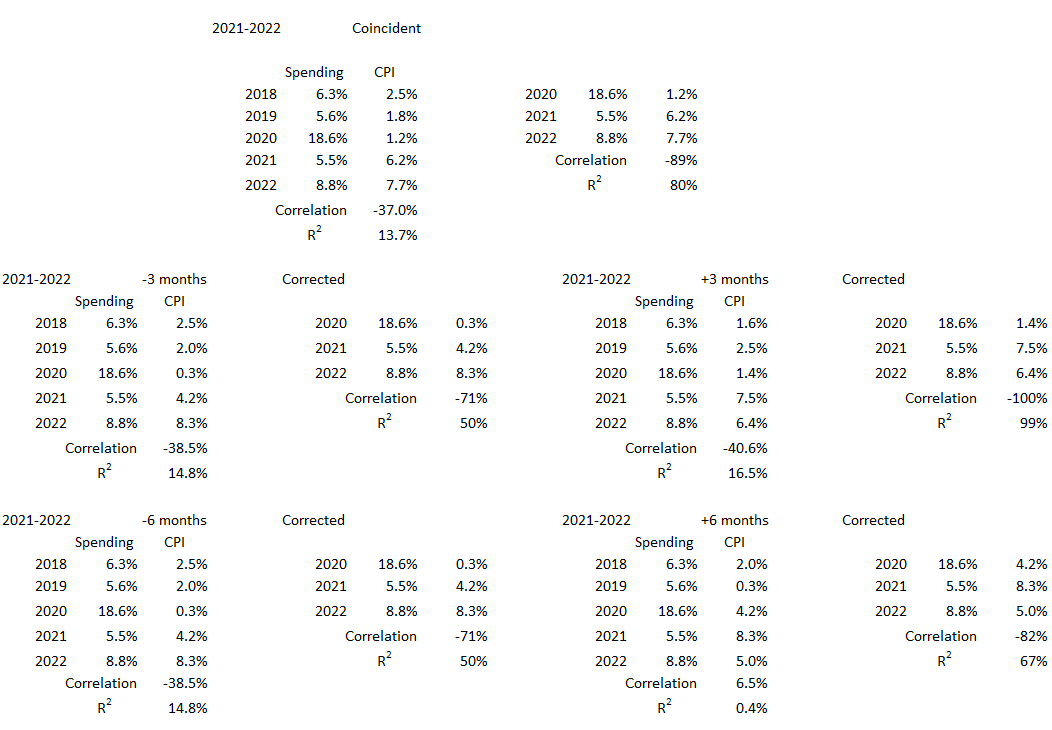
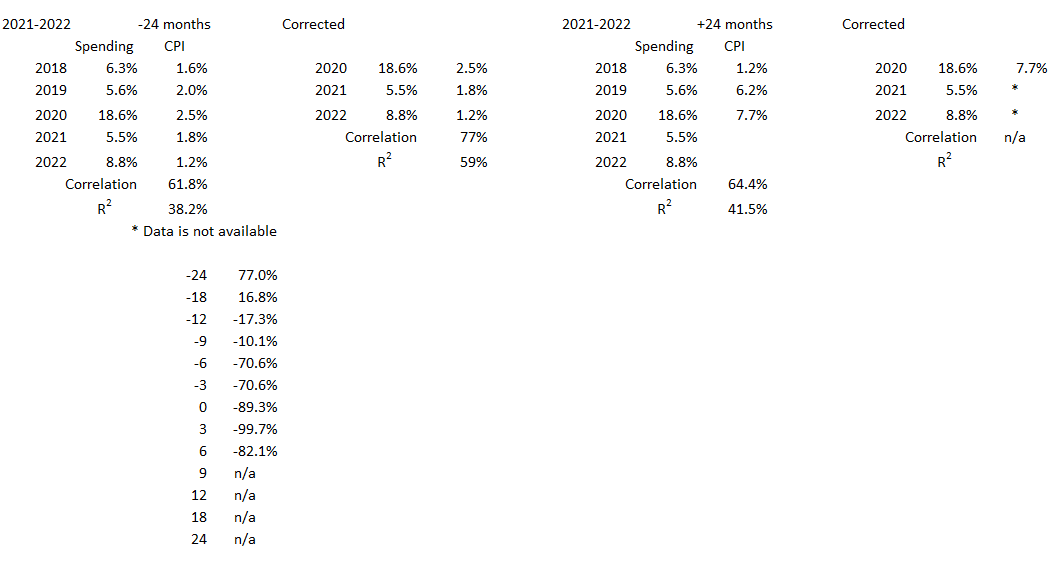
There is a big difference in correlation between the two variables in the two time periods. For the two inflation surge years R2 = 80% and R = -89%. For all five years, R2 = 14% and R = -37%. Neither of these results indicates any possibility for causation in either direction for consumer inflation and federal deficit spending when the data sets are coincident.
There may be a different result when time offsets between the two data sets are examined. To that point, we have speculated above that the increased deficit spending in 2020 may have the effect of contributing to increased inflation in the following months and/or years.
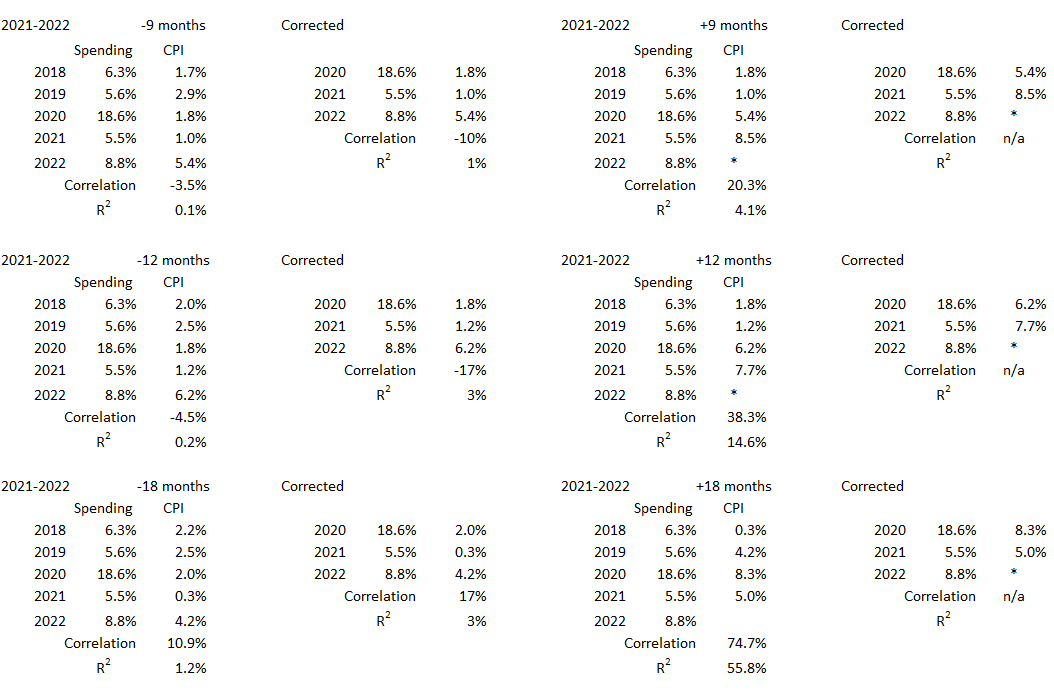
Figure 18. Correlation Between Deficit Spending and Inflation 2021-2022
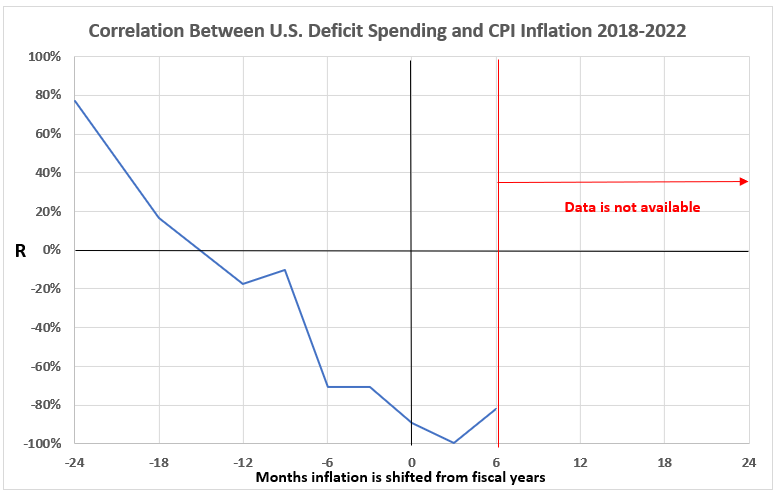
The only significant or moderate association in this graph is for inflation correlated with deficit spending 24 months later (R2 = 59%). That should be considered circumstantial since the clear reason for the increased deficit spending in 2020 and 2021 was in response to the pandemic and recession of 2020 without regard for inflation in previous years.
There is not enough data available to show if our speculation that the large federal deficit increase in fiscal 2020 could possibly have contributed to increased inflation in fiscal 2021 and 2022. Such an effect does not show for inflation three months and six months after federal spending.
Conclusion
It is clear that there is no one consistent pattern for the association of the two variables U.S. federal deficit spending and consumer inflation. Milton Friedman’s assertion6 that “only government spending causes inflation” is not supported by these results. (Further discussion about Friedman and inflation was presented previously.7)
For the purposes of the analysis above, the following definitions regarding correlations were made.
Table 2. Definitions Regarding Correlations
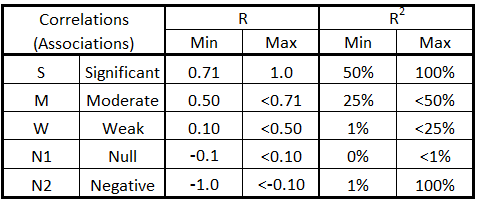
Using the classifications in Table 2, the analysis results here and in Part 13A are summarized in Table 3.
Table 3. Correlations for Inflation Surges and Federal Deficits 1914-2022
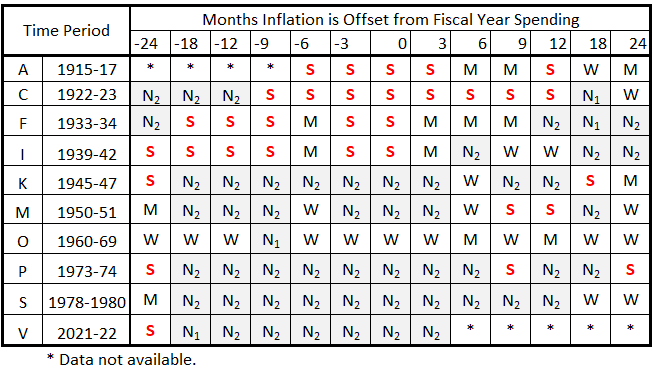
All the significant cells contain a red S, and all the null and negative cells are shaded light gray. This has been done to improve focus when scanning the table.
From Table 3 we draw the following conclusions:
- It is possible that inflation caused deficit spending and deficit spending caused inflation for the inflation surges for all of the inflation periods before World War II (A, C, F, and I).
- The possibilities for either deficit spending causing inflation or inflation causing deficit spending are less after World War II.
- In the post-WWII era, there is the greatest possibility for deficit spending causing inflation for the inflation periods K, M, and P.
- In inflation period O, there is some possibility that inflation caused deficit spending and deficit spending caused inflation.
- Except for period O, there does not appear to be any inflation spike where there is much possibility for inflation to cause deficit spending after World War II.
- There are very small (negligible?) possibilities for causation in either direction for inflation periods S and V, although the possibility for deficit spending causing inflation for V remains with more data.
Additional comments.
(1) It is mentioned that the results indicate inflation caused deficit spending and deficit spending caused inflation. How can that be? One possibility is a feedback mechanism whereby either one process starts (say inflation) which leads to increased deficit spending, which in turn creates another increase in inflation.
(2) The occurrence of negative correlations can have two interpretations:
- The data suggests there is no possible association between rising inflation and increased deficit spending.
- The data indicates the possibility that rising inflation might cause less deficit spending or vice versa.
The first interpretation is quite straightforward. The second may seem unrealistic, but it should not be dismissed without justification. This is especially true for extreme N2 values (–71% > R > –100%).
This concludes the work on inflation surges and federal government deficit spending. We will investigate other possible sources of inflation in the future. This work will be used to evaluate the relative importance of various possible causes. Other areas to investigate include private credit, financial markets (especially interest rates), wages, commodity shortages (especially energy), and trade balances.
The next phase of this inflation project will be to look at deficit spending and deflation/disinflation. Hopefully, the first effort there will be ready next week.
Appendix
In this appendix, we show all the data selections from the tables in Part 13A, Appendix 1,2 used to analyze each significant inflation period.
1945-1947
1950-1951
1960-1969
1973-74
1978-1980
2021-2022
Footnotes
1. Lounsbury, John, “Government Spending and Inflation. Part 13A”, EconCurrents, June 4, 2023. https://econcurrents.com/2023/06/04/government-spending-and-inflation-part-13a/.
2. Lounsbury, John, “Government Spending and Inflation. Part 13A, Appendix 1″, EconCurrents, June 4, 2023. https://econcurrents.com/2023/06/04/government-spending-and-inflation-part-13a/.
3. Lounsbury, John, “Government Spending and Inflation. Part 11”, EconCurrents, May 7, 2023. https://econcurrents.com/2023/05/07/government-spending-and-inflation-part-11/.
4. Estevez, Eric and Ecker, Jared, “What Is Stagflation, What Causes It, and Why Is It Bad?”, Investopedia, Updated April 27, 2023. https://www.investopedia.com/terms/s/stagflation.asp.
5. Federal Funds Interest Rates 1955 to Date, St. Louis Fed, Fred data base. https://fred.stlouisfed.org/series/FEDFUNDS
6. Friedman, Milton, “Only Government Creates Inflation”, YouTube, https://youtu.be/F94jGTWNWsA.
7. Lounsbury, John, “Government Spending and Inflation. Part 1, Expanded”, EconCurrents, February 11, 2023. https://econcurrents.com/2023/02/11/government-spending-and-inflation-part-1-expanded/