After failing to find systematic relationships between consumer inflation and federal deficit spending, this is the start of looking at each period of significant inflation and disinflation individually.

Photo by Jen Theodore on Unsplash
Notes:
- This (Part 13) replaces Part 12, which contains analysis errors.
- Part 13 is posted in divisions A and B for each to contain a week’s work.
Introduction
Previously,1 we sorted the 108 years from 1914-2022 into three groups.
- Years belonging to periods in which inflation increased by at least 4% without any pullback exceeding 1.5%. (10 periods, 34 years)
- Years belonging to periods in which inflation decreased by at least 4% without any pullback exceeding 1.5%. (11 periods, 37 years)
- The remaining years are not part of a period with significant inflation changes. (37 years)
The conclusion was that, even with this disaggregation of the data, no clear hypotheses about time variation of the associations between deficit spending and consumer inflation could be proposed. The conclusion was that it would be necessary to characterize each of the individual periods with significant inflation increases or decreases to determine what (if any) time variation patterns of the correlations between deficit spending and consumer inflation existed over the 108 years.
Data
The data used in the analysis presented here is the same that has been used previously:1 The time series and correlations for the two data sets coincident for each federal fiscal year as well as inflation offsets by ±3, ±6, ±9, ±12, ±18 and ±24 month amounts with respect to the fiscal years. The thirteen data tables are shown in Appendix 1.
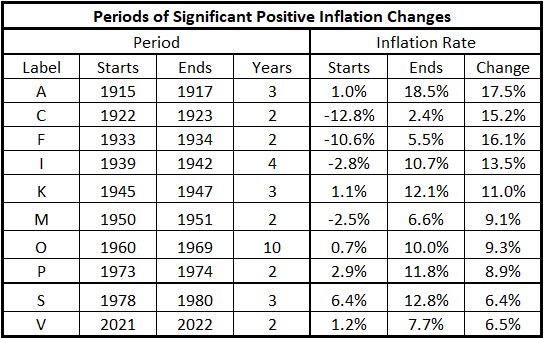
The periods of significant increases in inflation are given in Table 1, corrected from what was posted previously.1
Table 1. Periods of Significant Increases of Inflation 1914-2022
Analysis
A period of inflation is defined by one more data point than the number of years in the inflation trend. For example, the inflation of 1922-1923 is defined by the starting inflation rates
- at the beginning of 1922 (shown in the data tables as the inflation rate for 1921, the rate at the end of 1921),
- the inflation rate at the end of 1922 (which is the same as the inflation rate at the start of 1923), and
- the inflation rate at the end of 1923.
When calculating the correlation between deficit spending and consumer inflation, the number of data pairs involved is one more than the number of years of the inflation period. This is evident in the first graph for each inflation period where the start of the inflation and the end of the inflation are clearly labeled.
1915-1917
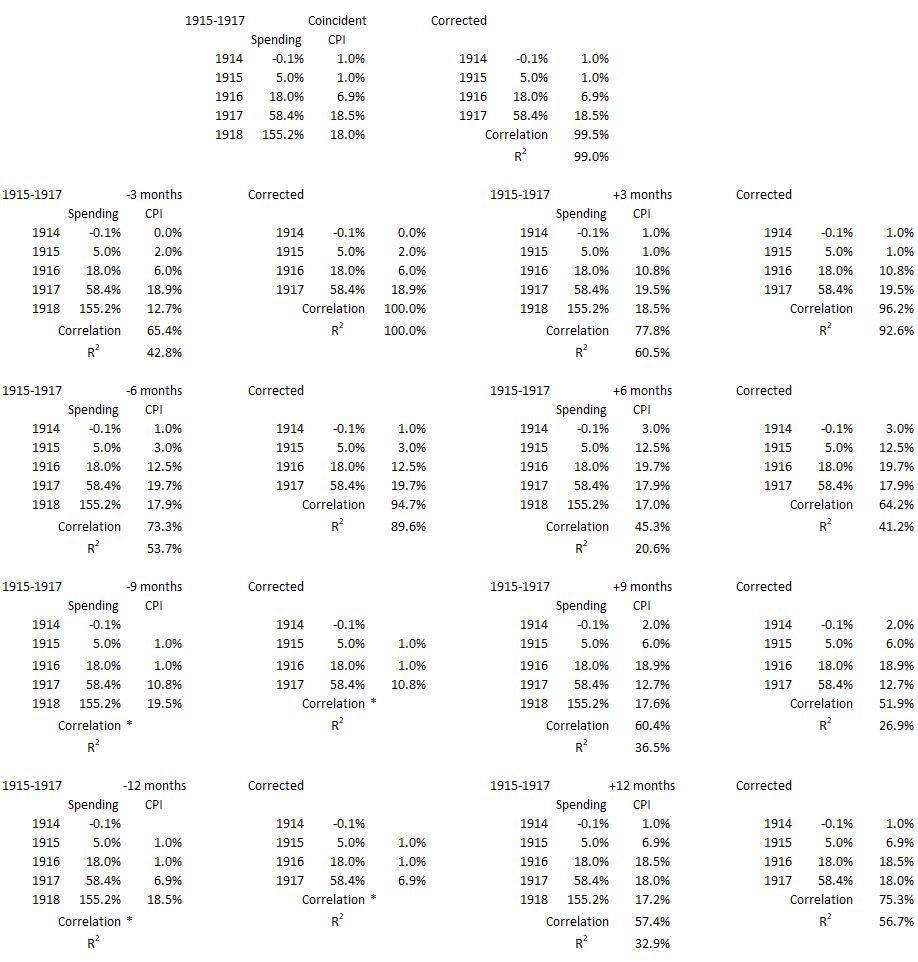
This period covers the two years preceding the U.S. entry into World War I plus the year with the first nine months for the U.S. as a combatant. The specific data extracted from the tables referenced in the data section above (Appendix 1) is shown in Appendix 2, and the following three figures are created from that data.
Figure 1. U.S. Federal Deficit Spending and Inflation for the Fiscal Years 1914-1918
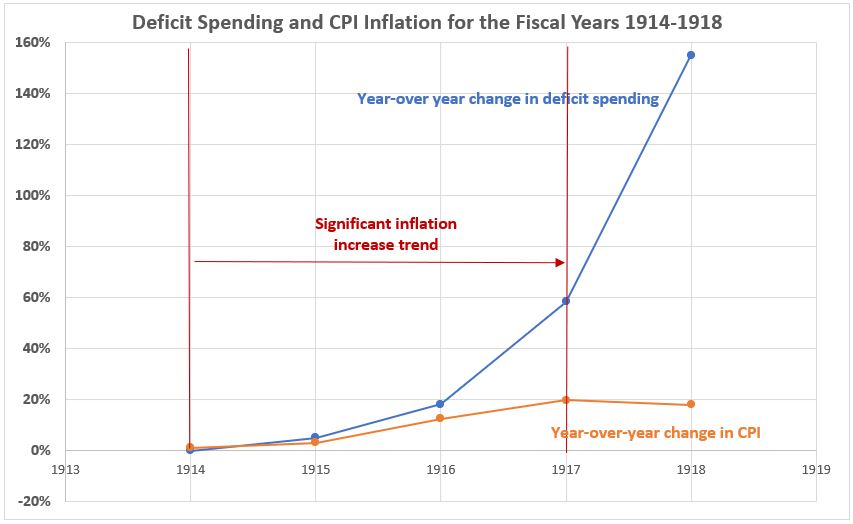
The deficit spending in the two years prior to the U.S. entry into World War I in April 1917. Even though federal deficit spending increased markedly in 1917, inflation continued at nearly the same rate as for 1916. In 1918 deficit spending surged to the largest percentage increase for the entire period 1914-2022, while the growth of inflation actually was lower.
Figure 2. Annual Changes in Deficit Spending vs. Inflation for the Fiscal Years 1914-1918
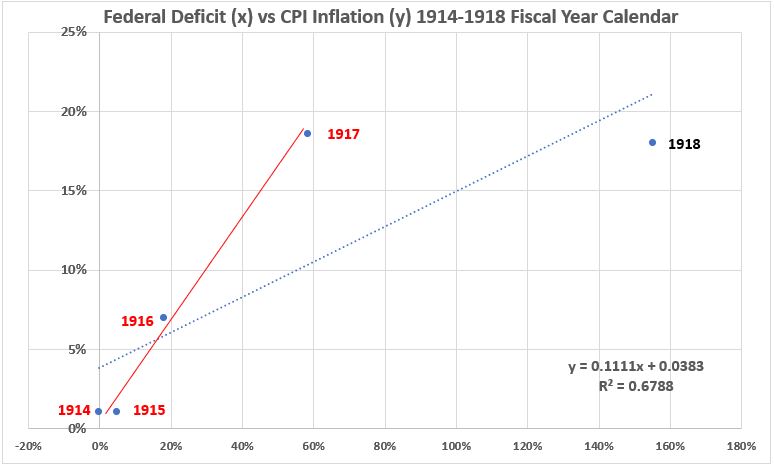
There are two trendlines for the data in Figure 2. The blue is for the years 1914-1918 and the red for the years 1915-1917 when a significant increase in inflation took place. As seen in Appendix 2, the R2 value for the four years of red data is larger (99.0%) than for the total five years (67.9%).
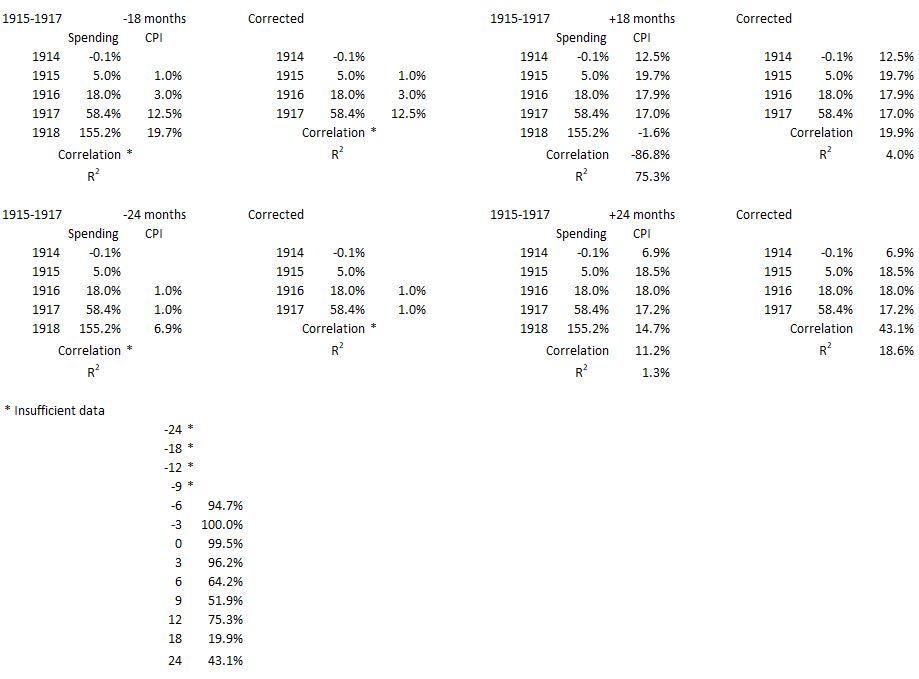
Figure 3. Correlation Between Deficit Spending and Inflation 1915-1917
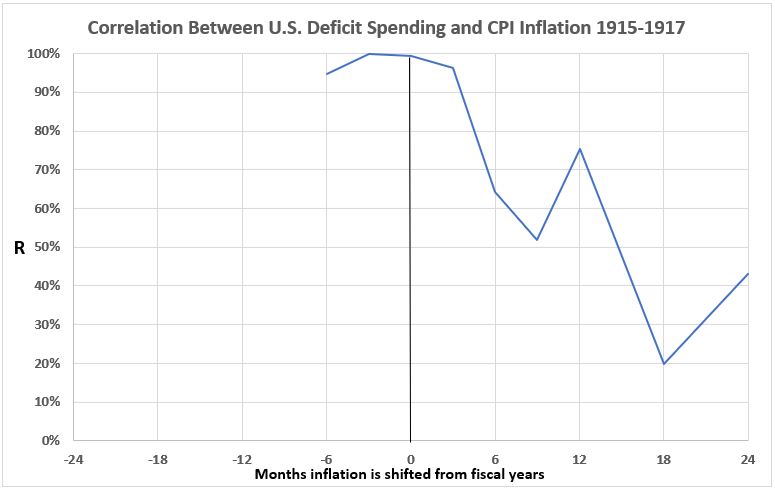
There is a strong association between deficit spending and consumer inflation for inflation leading spending ny 3 and 6 months, when they are coincident, and when spending leads inflation by 3 months. For longer spending lead times the associations are mostly declining. Since the defict spending is significantly driven by spending to prepare for and participate in World War I, the associations may be coincidential. Both deficit spending and consumer inflation may be driven by war spending.
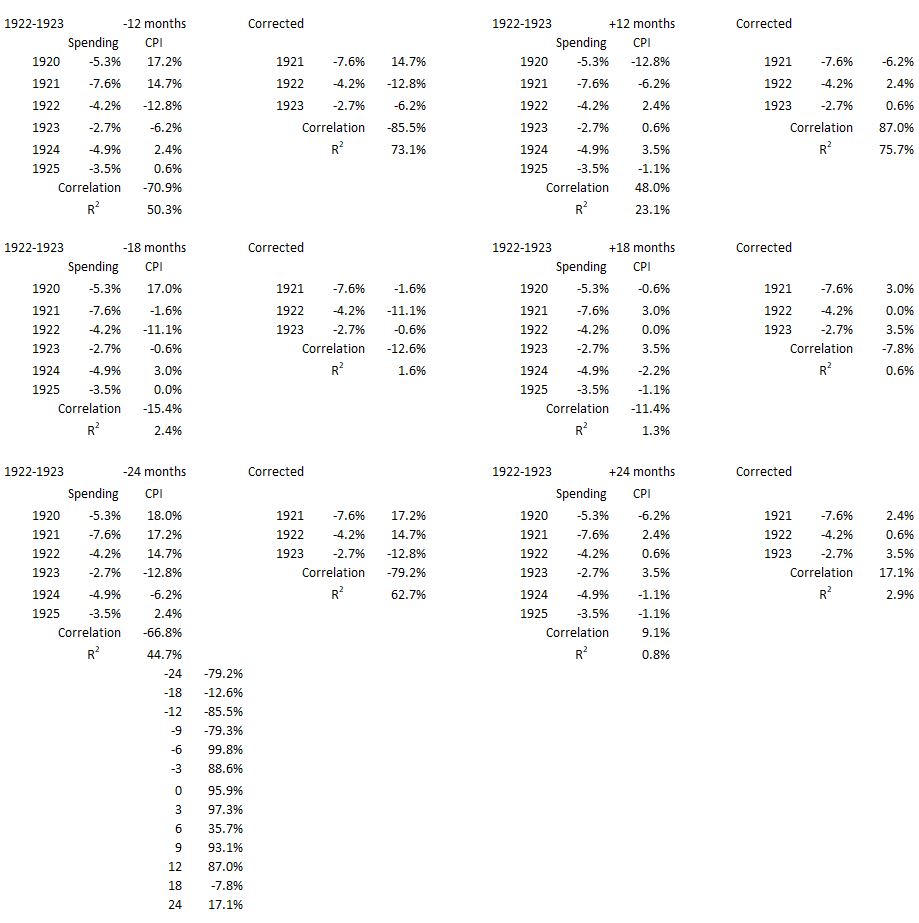
1922-1923
This period covers the recovery from the severe recession of 1920-21.
Figure 4. U.S. Federal Deficit Spending and Inflation for the Fiscal Years 1920-1925
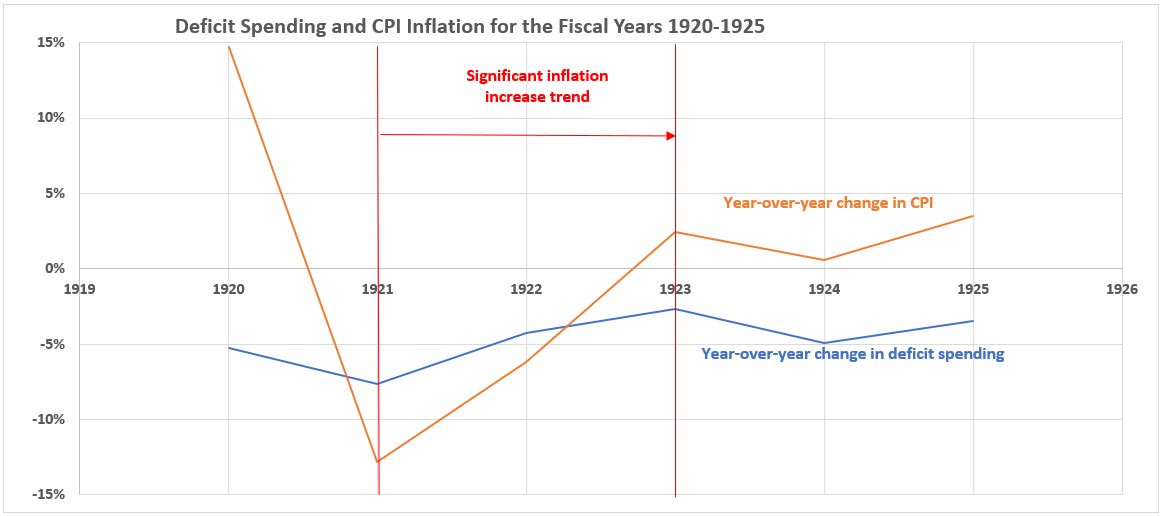
Over this entire period the federal budget was in surplus (negative deficit spending). The consumer inflation rates varied widely, from 14.7% at the beginning of fiscal 1920 before the recession started to –12.8% at the end of fiscal 1920 when the recession was in full sway. Although the recession end coincided with the start of fiscal year 1922, deflation was still underway throughout that year. At the end of fiscal 2022 the inflation rate had risen to –6.5%. It was not until late in fiscal 2023 that consumer inflation became positive (2.4%).
Figure 5. Annual Changes in Deficit Spending vs. Inflation for the Fiscal Years 1920-1925
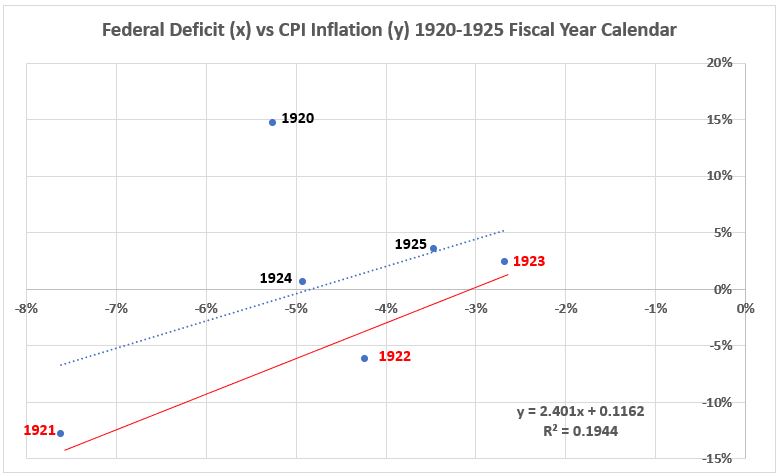
The trends for the three data points for the inflation surge of 1922-1923 and for the entire six-year period 1920-1925 are similar. But the R2 values are much different. R2 = 92% for the three data points in the surge (indicating small variances) while it is 19% for the entire six years, indicative of the much greater scatter.
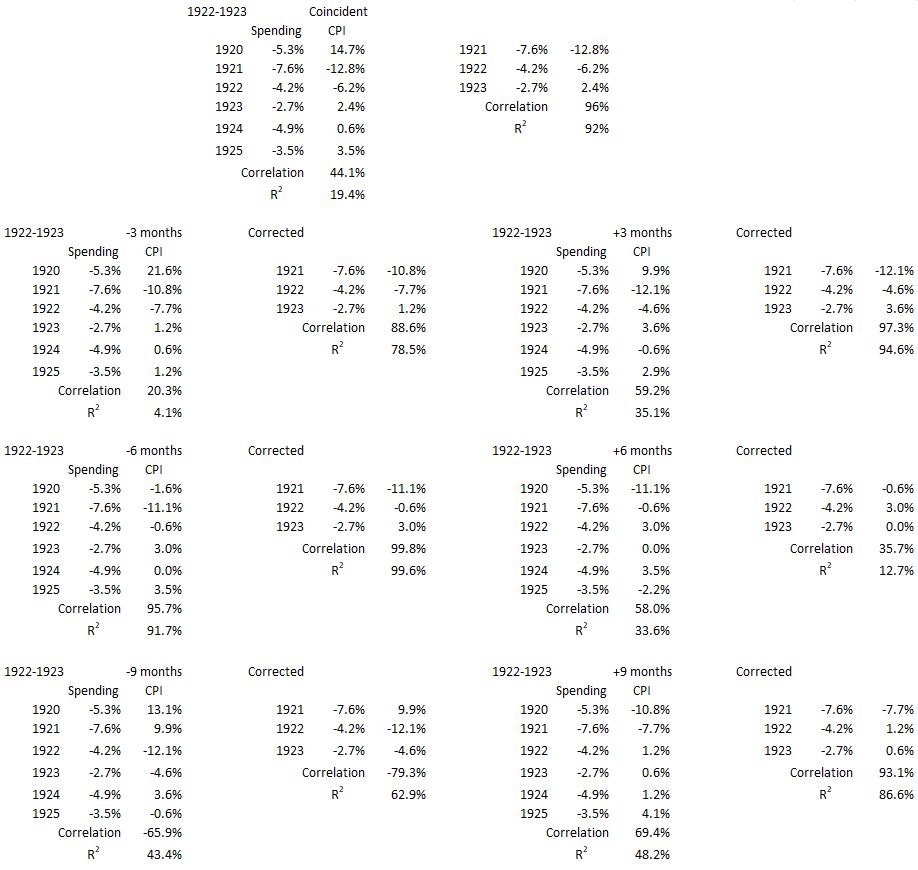
Figure 6. Correlation Between Deficit Spending and Inflation 1922-1923
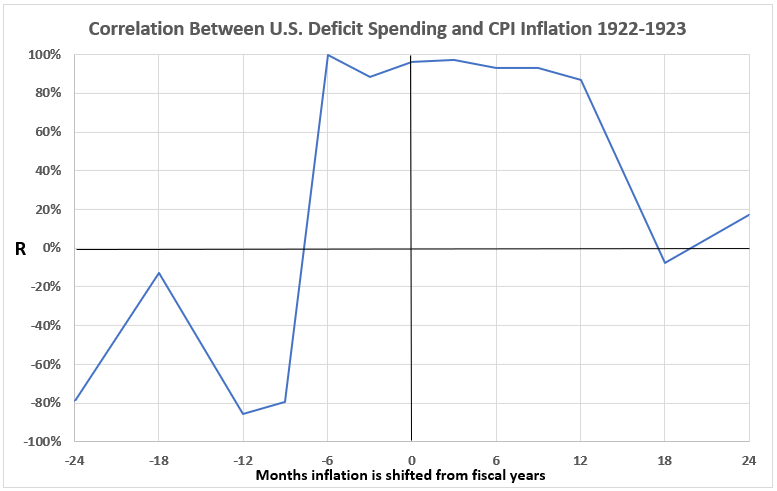
There are strong associations of consumer inflation with government spending for timeline alignments of the two variables at and near the coincident alignment (-6 to +12 months for inflation wrt to government spending). There is nothing a priori in this data that would cause us to dismiss the possibility of causation for the alignments with inflation leading to government spending (-6 and -3 months) or spending leading to consumer inflation (+3 to +12 months). Perhaps both occur because of feedback effects.
Off course, all the discussion above concerns possibilities because association by itself does not prove cause and effect.
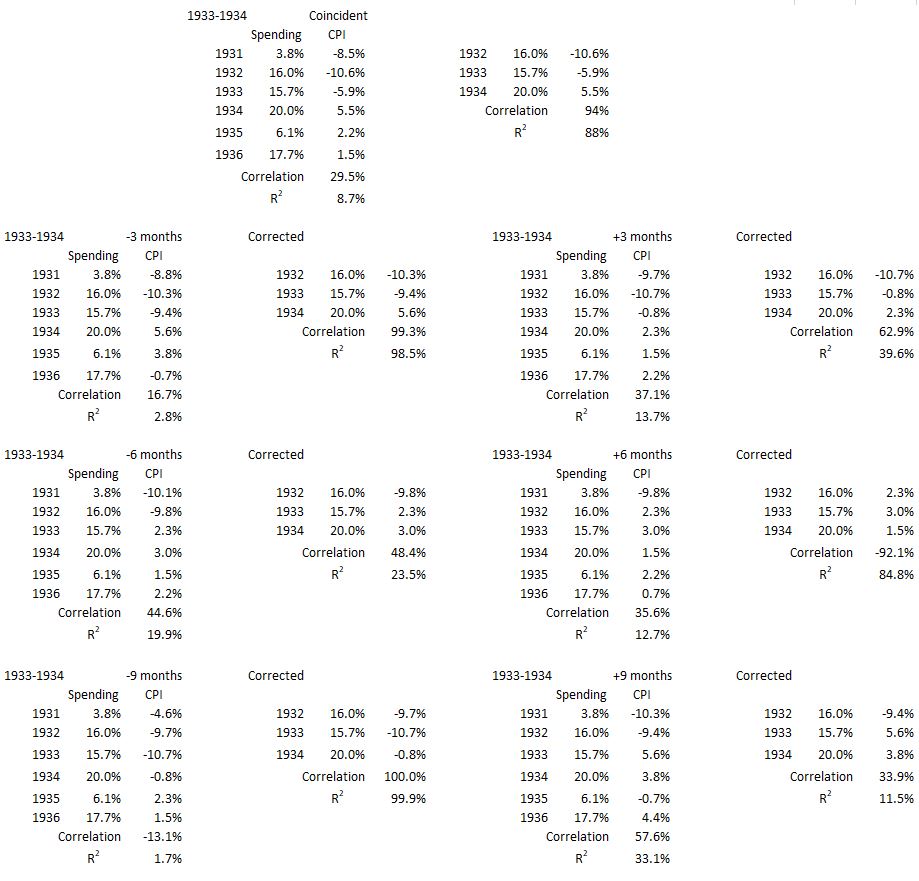
1933-1934
This time period coincides with reaching the bottom of the Great Depression and the start of recovery. The initial recession of that event started in August 1929 and ended in March 1933. The fiscal years for this inflation surge started in July 1932 and ended at the end of June 1934. Thus, the inflation surge started nine months before the recession officially ended.
Figure 7. U.S. Federal Deficit Spending and Inflation for the Fiscal Years 1931-1936
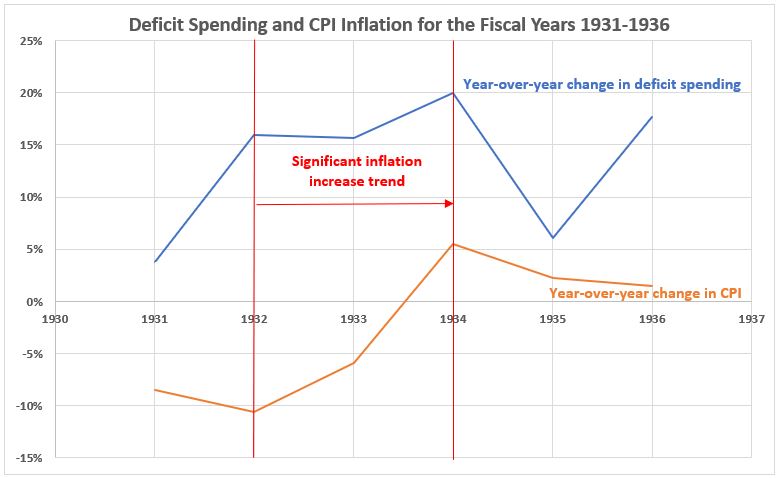
This period shares a similar character with the preceding inflation surge in 1921-1922. Both involve the bottom and start of the recovery from a severe recession. And both periods start with extreme deflation rates, which do not become positive until the end of the surge.
Figure 8. Annual Changes in Deficit Spending vs. Inflation for the Fiscal Years 1931-1936
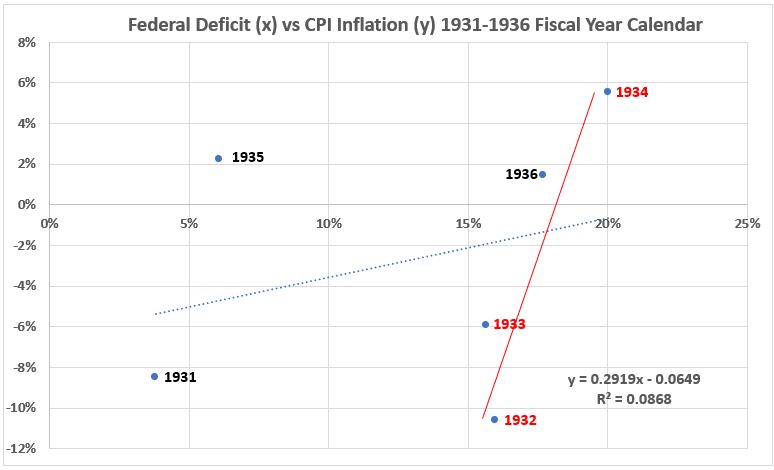
The trends for the three data points for the inflation surge of 1933-1934 and for the entire six-year period 1931-1936 are very different. The slope for the inflation surge is much steeper, in contrast to the graph for the 1922-1923 period. However, similar to the previous period, the R2 values are much different. R2 = 88% for the three data points in the surge (indicating small variances), while it is ~9% for the entire six years, indicative of the much greater scatter.
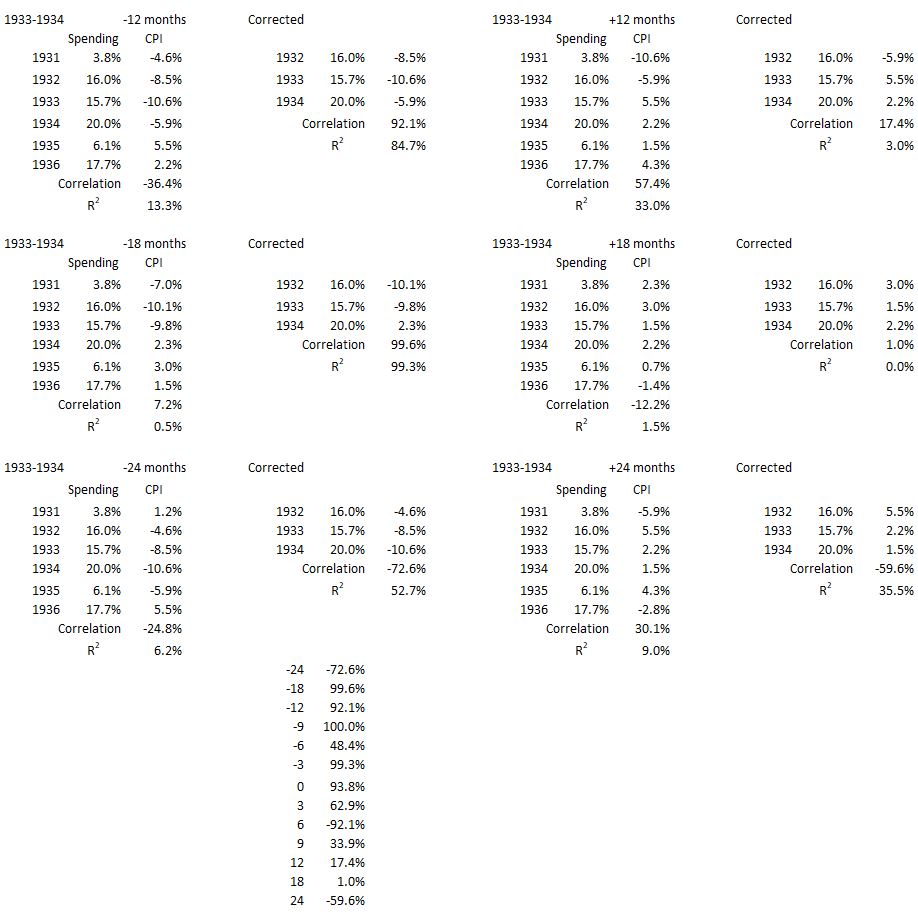
Figure 9. Correlation Between Deficit Spending and Inflation 1933-1934
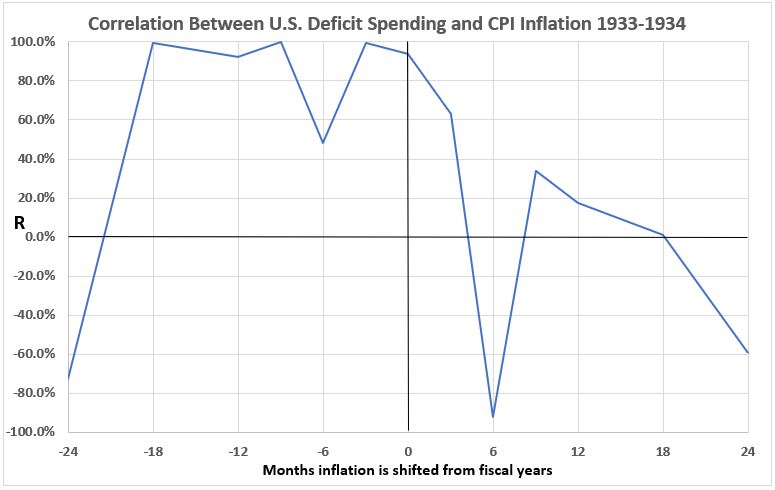
In this data, there is a moderate association (R = ~63%) for government spending leading to inflation by three months. For the data points +6 through +24, the associations are weak, null, or negative. There is no indication of a possible significant cause of inflation by government spending in this data. On the other hand, the strong associations for coincident and -3 through -18 months (except for -6 months where R = ~48%) do allow for the possibility that inflation might have led to government spending during the 1933-1934 time period.
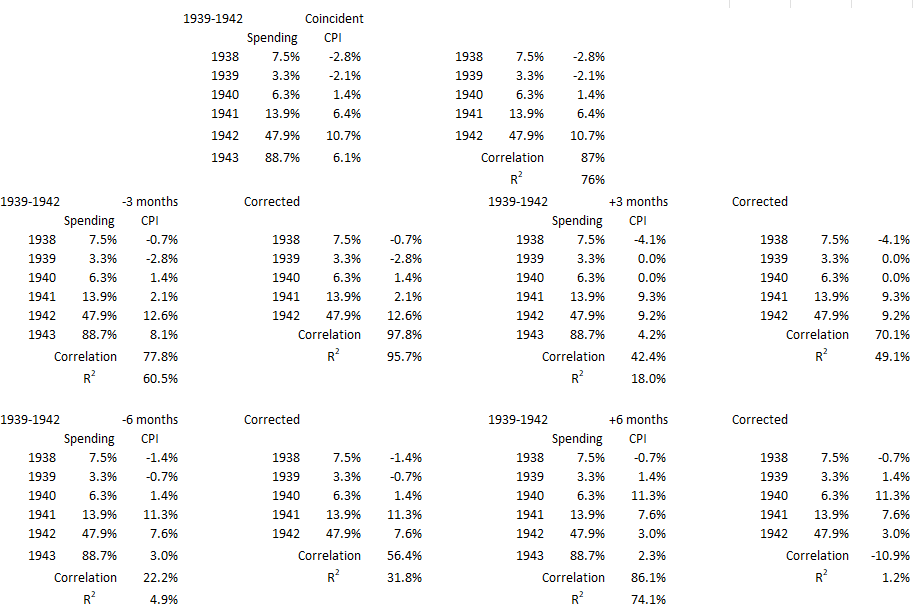
1939-1942
This time period covers the years that World War II started in Europe (and Asia) and includes the year that the U.S. entered the war.
Figure 10. U.S. Federal Deficit Spending and Inflation for the Fiscal Years 1938-1943
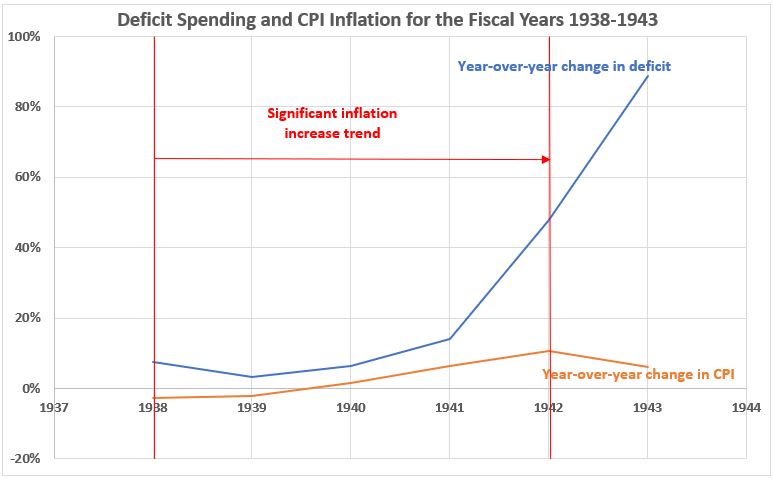
The increases in deficit spending and inflation are similar for 1940 and 1941. For 1939 deficit spending decreased from the previous year, but inflation increased slightly. In 1942, deficit spending surged dramatically, but inflation continued increasing at the slower established trend. A factor in the slower inflation increase for 1942 was the implementation of wage and price controls in September of that year.
Figure 11. Annual Changes in Deficit Spending vs. Inflation for the Fiscal Years 1938-1943
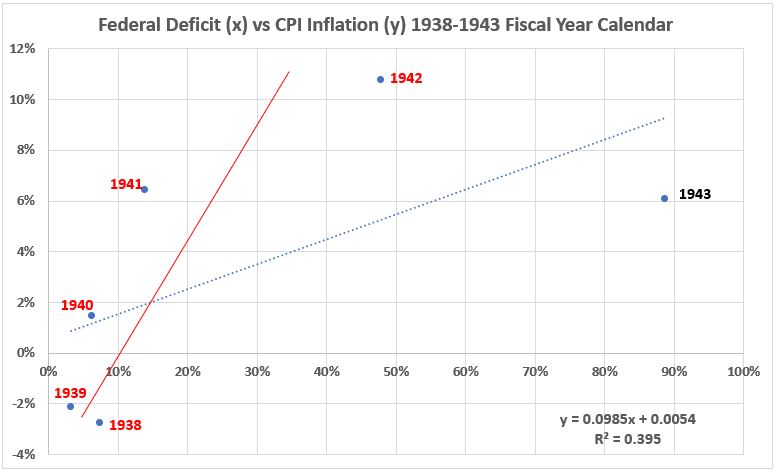
The trendline for the entire six years of data (blue dots) has a significantly smaller slope for the time period 1938-1943 than does the trendline for the inflation surge years 1939-1942 (solid red). The R2 value for 1939-1942 with inflation coincident is larger (87%, see Appendix) than for the entire six years shown in the graph (39.5%).
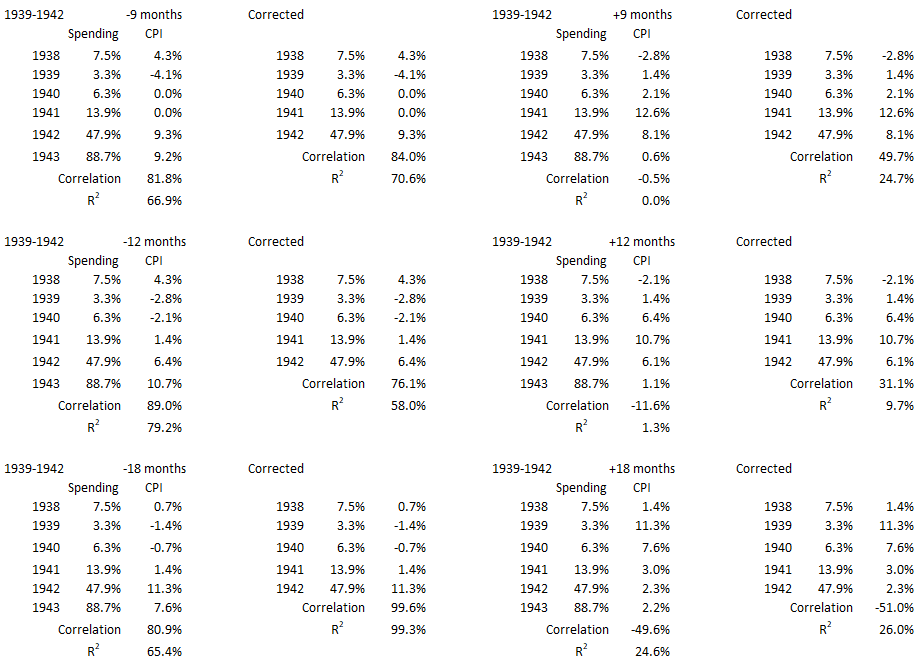
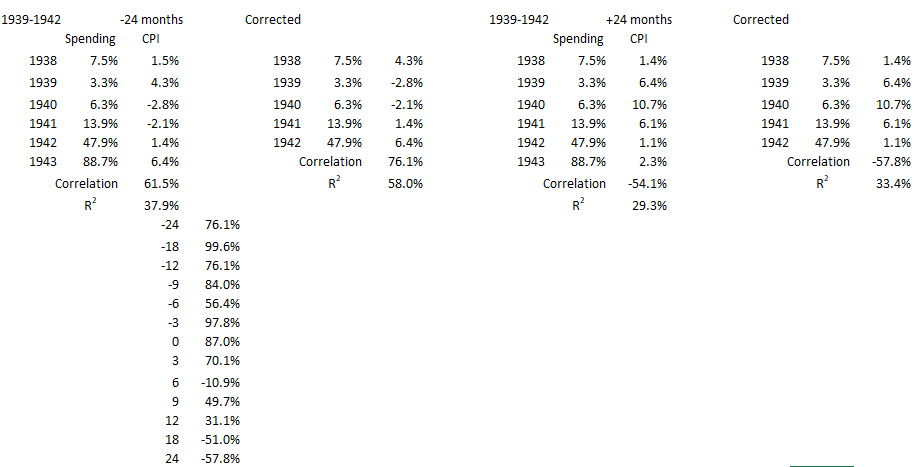
Figure 12. Correlation Between Deficit Spending and Inflation 1939-1942
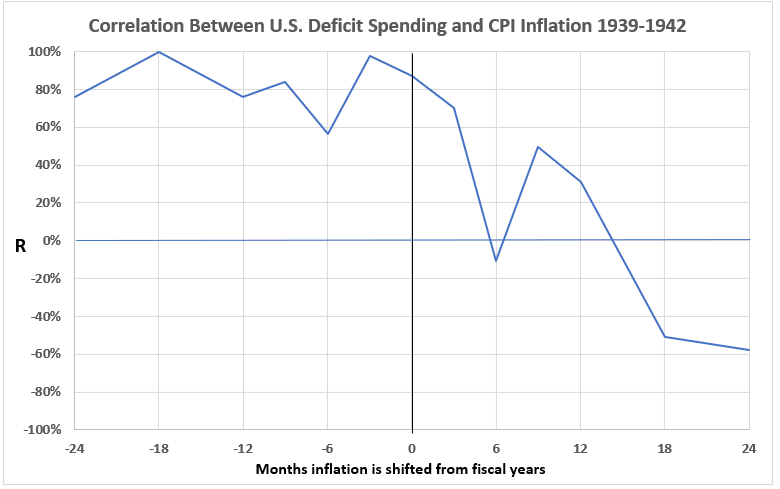
In this data, there is a significant association (R = ~71%) for government spending leading to inflation by three months. For the data points +6 through +24, the associations are weak, null, or negative. There is no indication of a possible significant cause of inflation by government spending in this data beyond a nearly coincident effect. On the other hand, the strong associations for coincident and -3 through -24 months (except for -6 months where R = ~55%) do allow for the possibility that inflation might have led to increased government spending during the 1939-1942 time period.
The associations for the 1939-1942 inflation surge are very similar to those for the 1933-1934 surge.
Conclusion
The conclusion discussion for this work is deferred to Part 13B, to be posted.
Appendix 1
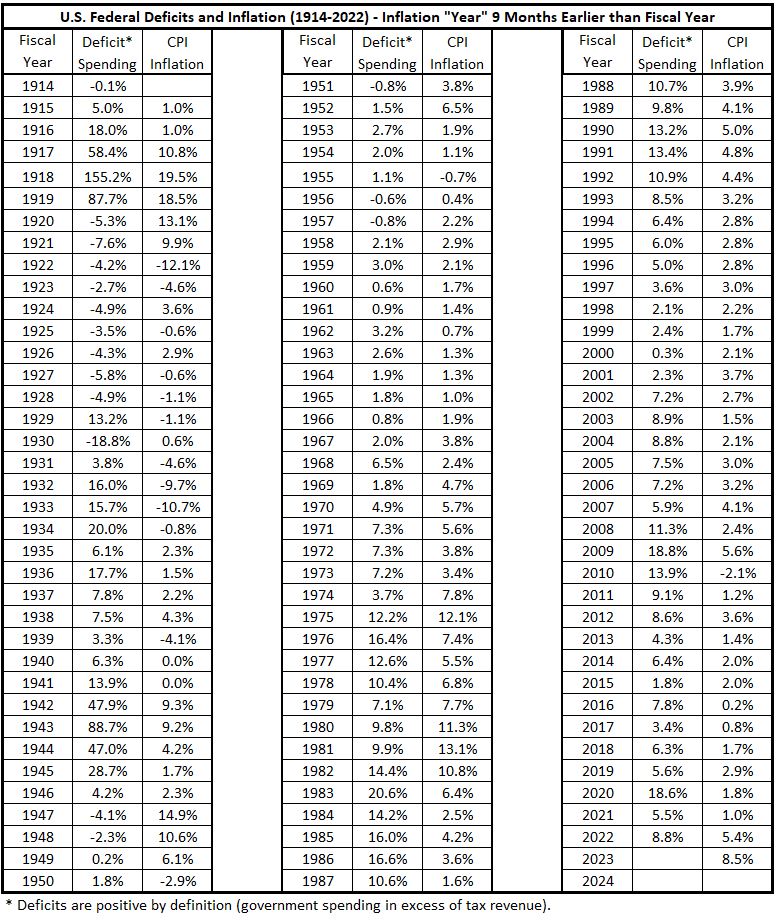
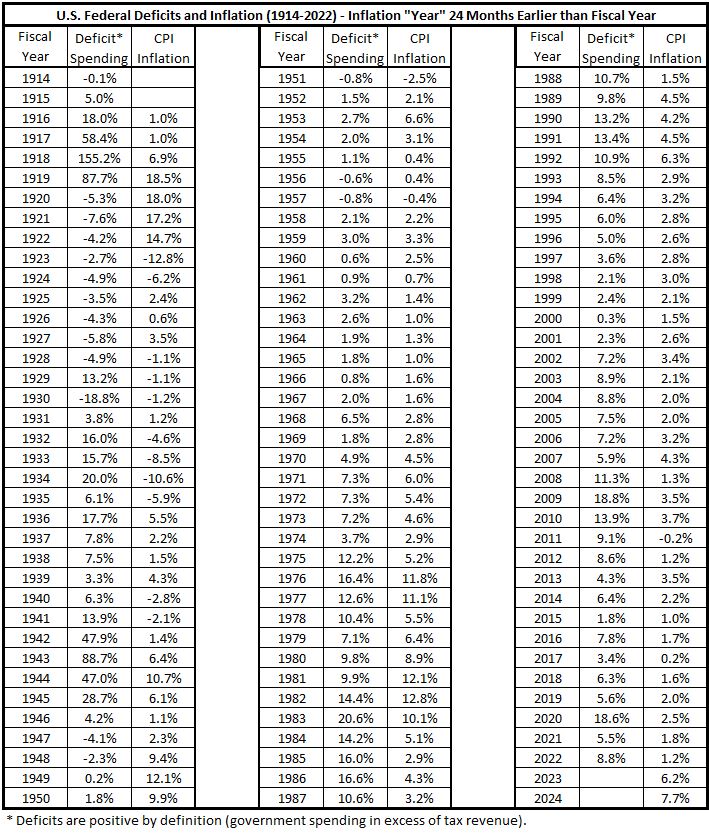
The data tables below show the fiscal year data for U.S. federal government deficit spending from 1914 to 2022. Each individual table also has the consumer inflation data aligned (offset) by various intervals from the fiscal year spending data.
Table 1A1. Deficits and Inflation Aligned with Fiscal Years (1914 – 2022)

Inflation Aligned ±3 Months with Fiscal Years
Table 2A1. Deficits and Inflation Aligned 3 Months Later than Fiscal Years
(1914 – 2022)

Table 3A1. Deficits and Inflation Aligned 3 Months Earlier than Fiscal Years
(1914 – 2022)

Inflation Aligned ±6 Months with Fiscal Years
Table 4A1. Deficits and Inflation Aligned 6 Months Later than Fiscal Years
(1914 – 2022)

Table 5A1. Deficits and Inflation Aligned 6 Months Earlier than Fiscal Years
(1914 – 2022)

Inflation Aligned ±9 Months with Fiscal Years
Table 6A1. Deficits and Inflation Aligned 9 Months Later than Fiscal Years
(1914 – 2022)
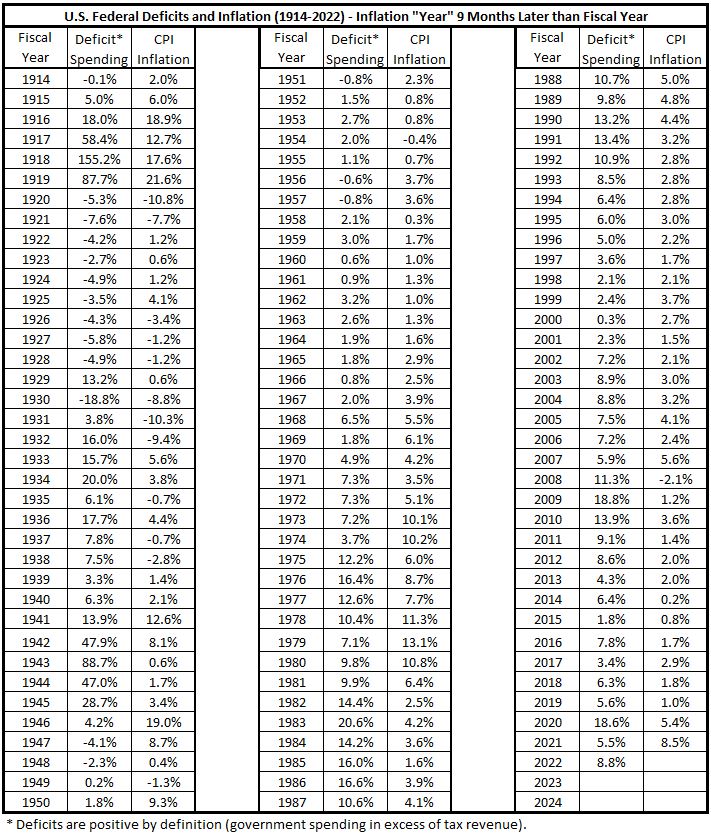
Table 7A1. Deficits and Inflation Aligned 9 Months Earlier than Fiscal Years
(1914 – 2022)
Inflation Aligned ±12 Months with Fiscal Years
Table 8A1. Deficits and Inflation Aligned 12 Months Later than Fiscal Years
(1914 – 2022)
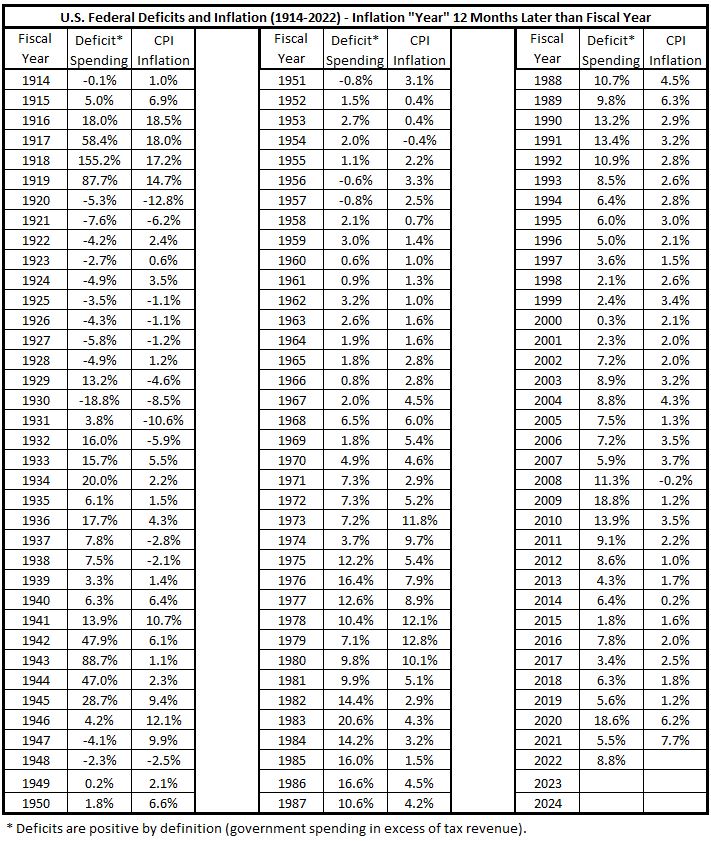
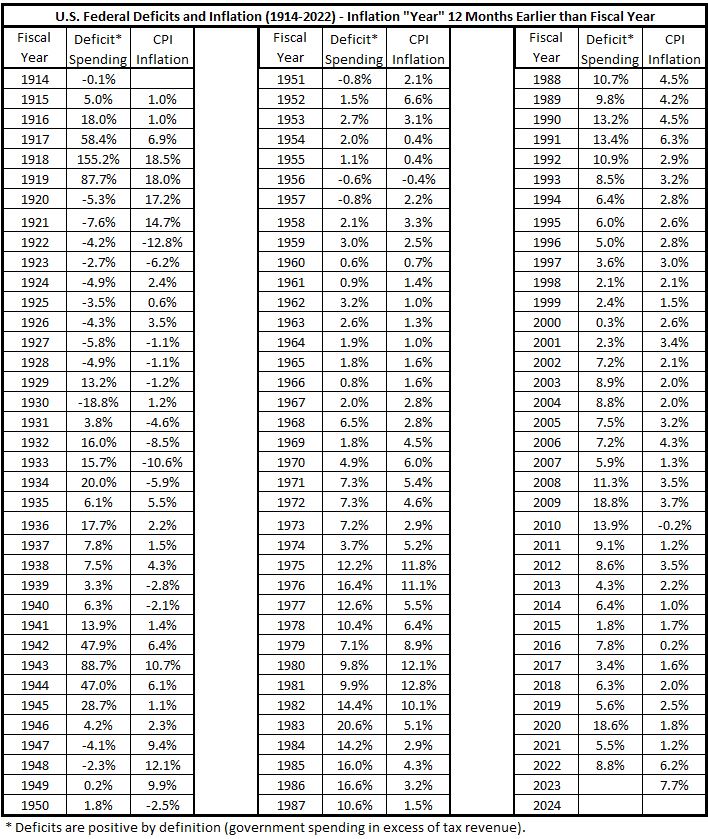
Table 9A1. Deficits and Inflation Aligned 12 Months Earlier than Fiscal Years
(1914 – 2022)
Inflation Aligned ±18 Months with Fiscal Years
Table 10A1. Deficits and Inflation Aligned 18 Months Later than Fiscal Years
(1914 – 2022)
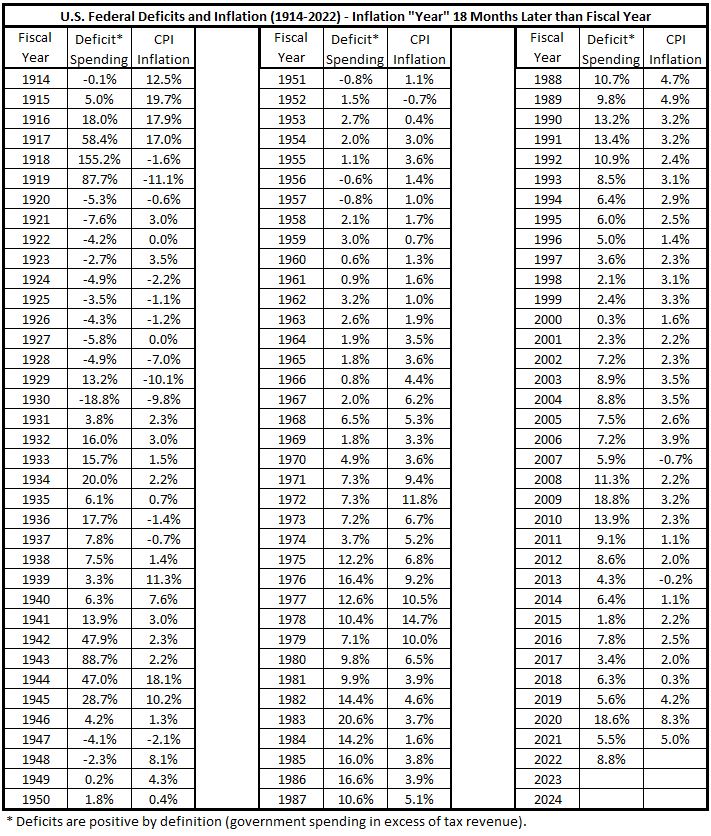
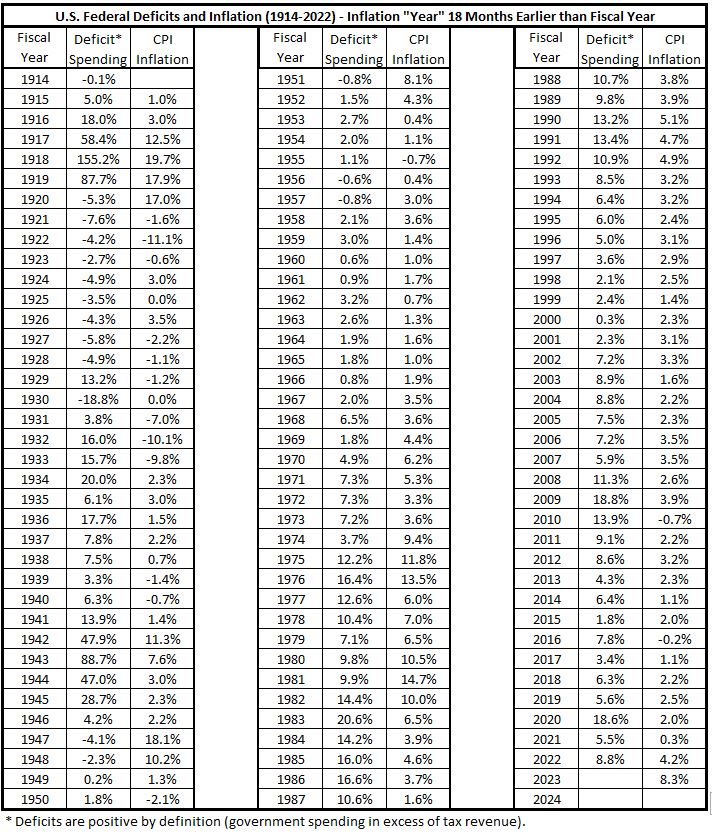
Table 11A1. Deficits and Inflation Aligned 18 Months Earlier than Fiscal Years
(1914 – 2022)
Inflation Aligned ±24 Months with Fiscal Years
Table 12A1. Deficits and Inflation Aligned 24 Months Later than Fiscal Years
(1914 – 2022)
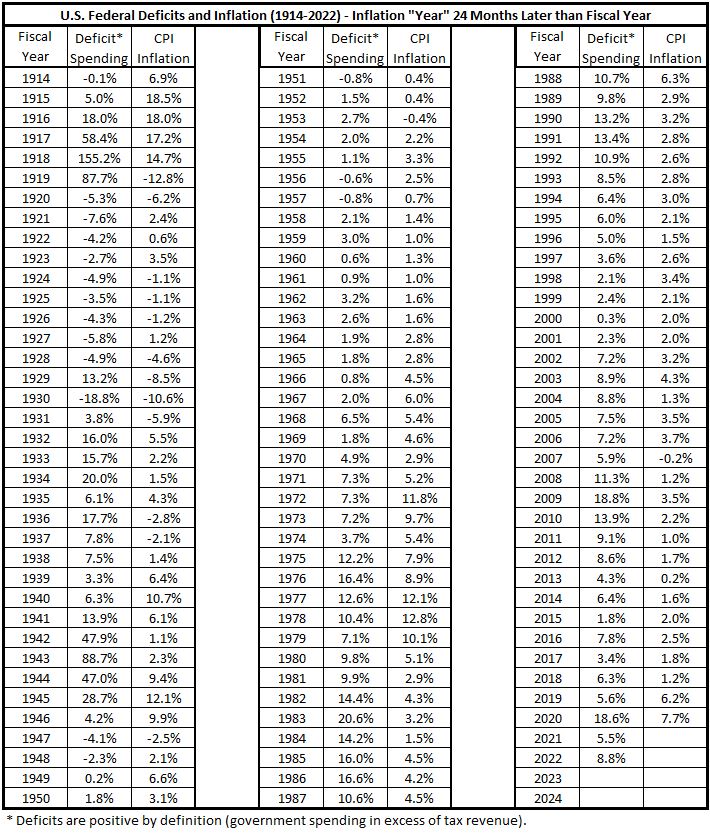
Table 13A1. Deficits and Inflation Aligned 24 Months Earlier than Fiscal Years
(1914 – 2022)
The sources and procedures for organizing the above data are described in Part 11, Appendix.3
Appendix 2
In this appendix we show all the data selections from the tables in Appendix 1 for the analysis of each significant inflation period.
1915-1917
1922-1923
1933-1934
1939-1942
Footnotes
1. Lounsbury, John, “Government Spending and Inflation. Part 11”, EconCurrents, May 7, 2023.
https://econcurrents.com/2023/05/07/government-spending-and-inflation-part-11/.
2. Wikipedia, “Depression of 1920–1921″, https://en.wikipedia.org/wiki/Depression_of_1920–1921.
3. Lounsbury, John, “Government Spending and Inflation. Part 11”, EconCurrents, May 7, 2023. Appendix. https://econcurrents.com/2023/05/07/government-spending-and-inflation-part-11/.