Note: There are a number of errors in the analysis. A new article will be posted with the correct analysis. This post will remain. The reason is that this series of blog articles constitutes my “research notebook.” As anyone trained in science or engineering will tell you, a research notebook is a chronological record of work. When errors are made, they are noted but not crossed out or removed. Removing any part invalidates the research record. So Part 13 of this series will be a replacement for Part 12.
In previous posts in this series, we have looked at what can be learned by looking at the time series data for U.S. federal government spending and consumer inflation (CPI). We have failed to find systemic consistency in the correlation between these two data sets. In the most recent effort,1 we isolated those data points belonging to periods of significant inflation and significant disinflation/deflation. Even that partitioning of the data did not yield the systemic patterns sought. This brings us to see what can be learned by studying each period of significant inflation changes individually.

From a photo by Jan Antonin Kolar on Unsplash
Introduction
Previously,1 we sorted the 108 years from 1914-2022 into three groups.
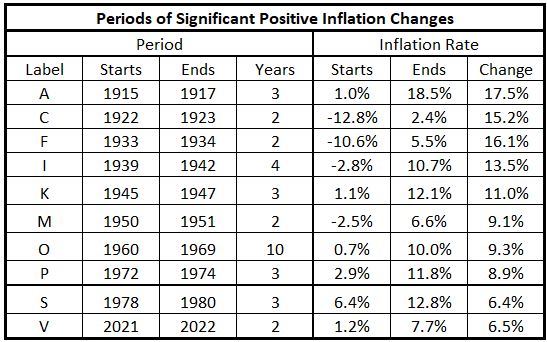
- Years belonging to periods in which inflation increased by at least 4% without any pullback exceeding 1.5%. (10 periods, 34 years)
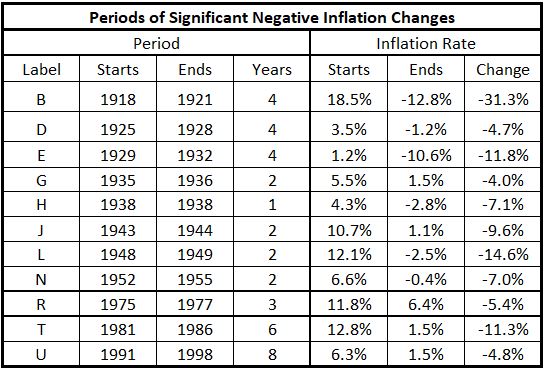
- Years belonging to periods in which inflation decreased by at least 4% without any pullback exceeding 1.5%. (11 periods, 37 years)
- The remaining years are not part of a period with significant inflation changes. (37 years)
The conclusion was that, even with this disaggregation of the data, no clear hypotheses about time variation of the associations between deficit spending and consumer inflation could be proposed. The conclusion was that it would be necessary to characterize each of the individual periods with significant inflation increases or decreases to determine what (if any) time variation patterns of the correlations between deficit spending and consumer inflation existed over the 108 years.
Data
The data used in the analysis presented here is the same that has been used previously:1 The time series and correlations for the two data sets coincident for each federal fiscal year as well as inflation offsets by ±3 and ±6 month amounts with respect to the fiscal years.
Table 1. Deficits and Inflation Aligned with Fiscal Years (1914 – 2022)
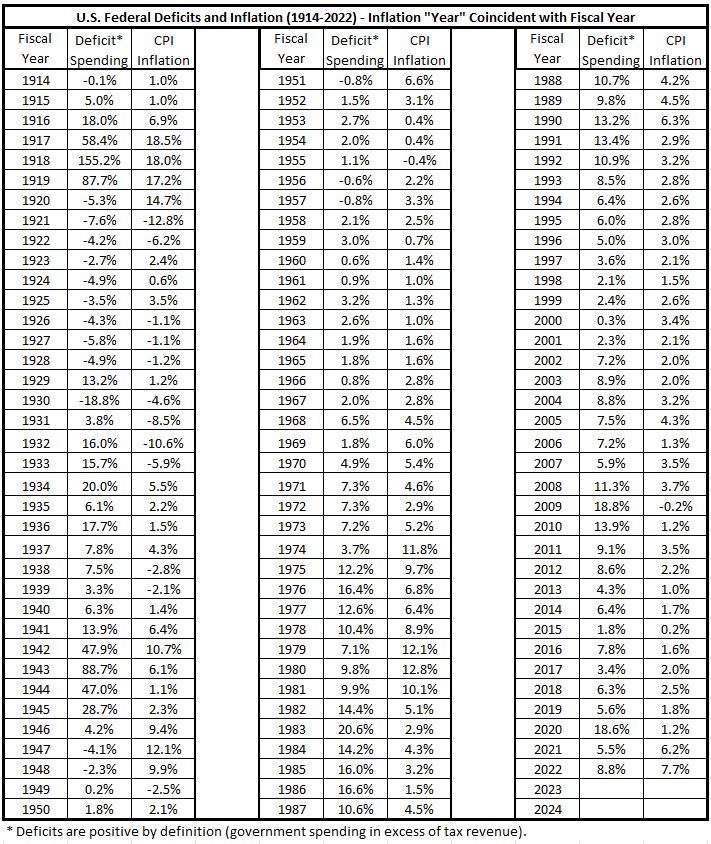
Table 2. Deficits and Inflation Aligned 3 Months Earlier than Fiscal Years
(1914 – 2022)
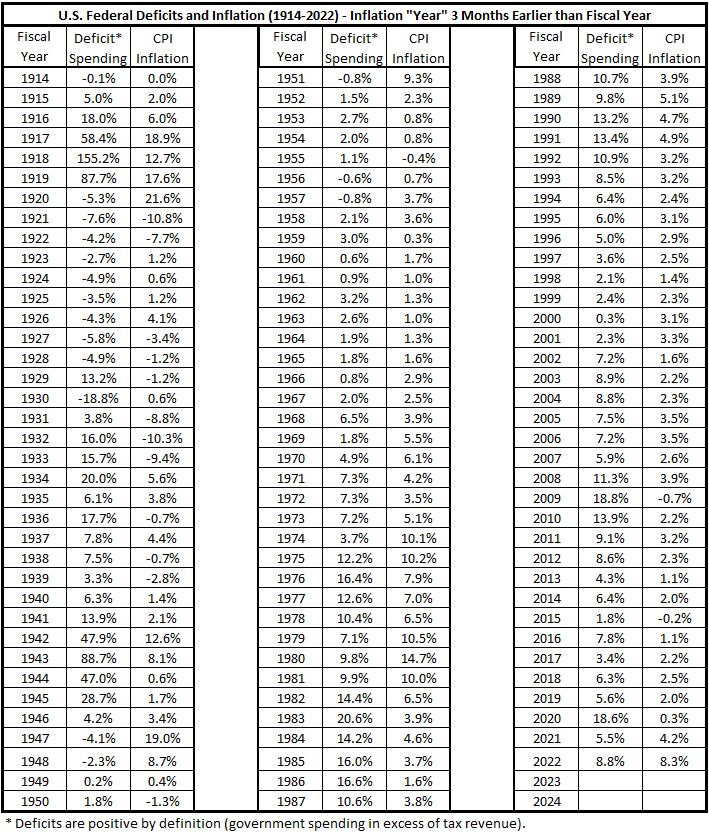
Table 3. Deficits and Inflation Aligned 3 Months Later than Fiscal Years
(1914 – 2022)
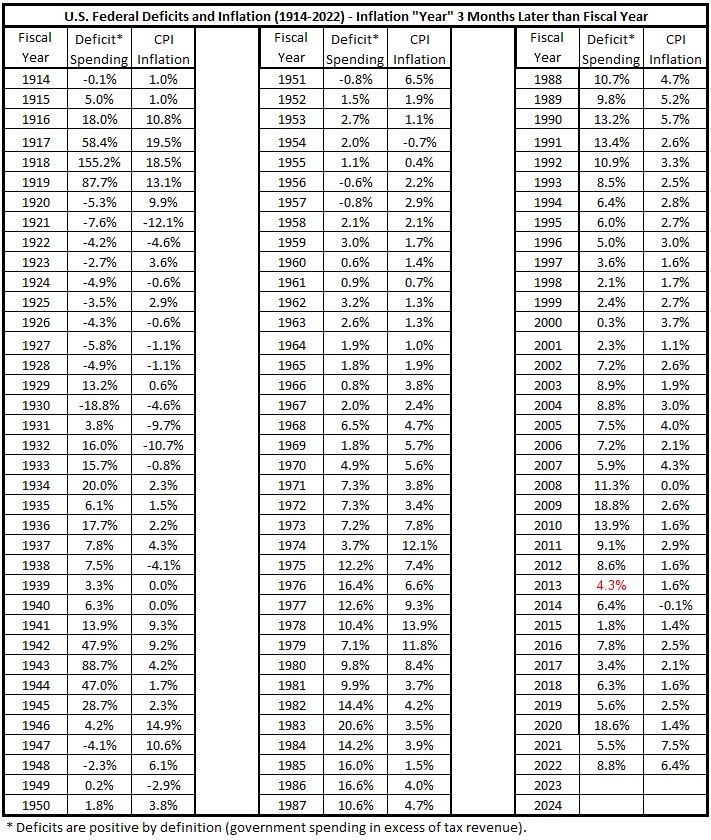
Table 4. Deficits and Inflation Aligned 6 Months Earlier than Fiscal Years
(1914 – 2022)
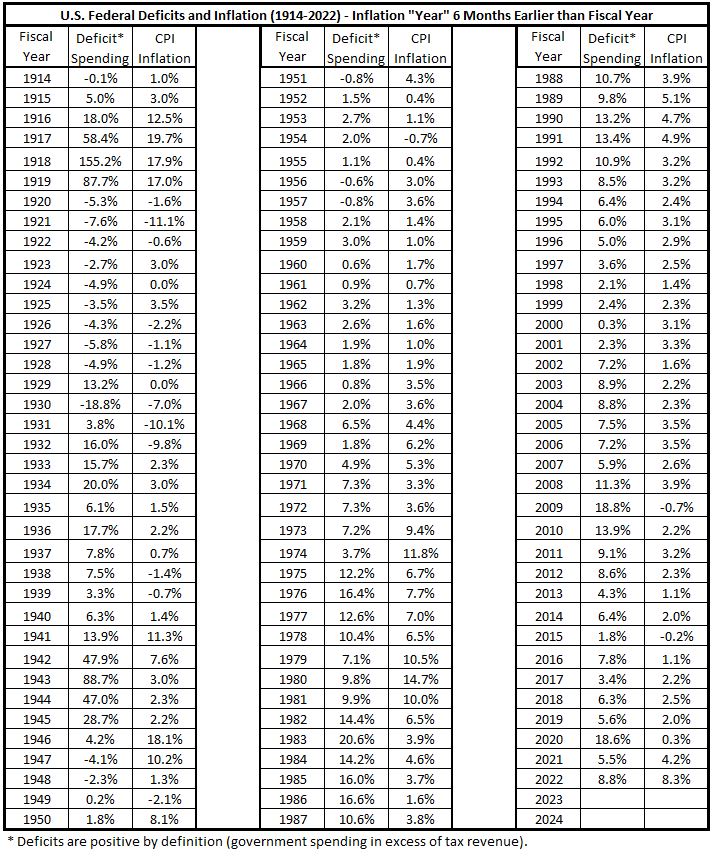
Table 5. Deficits and Inflation Aligned 6 Months Later than Fiscal Years
(1914 – 2022)
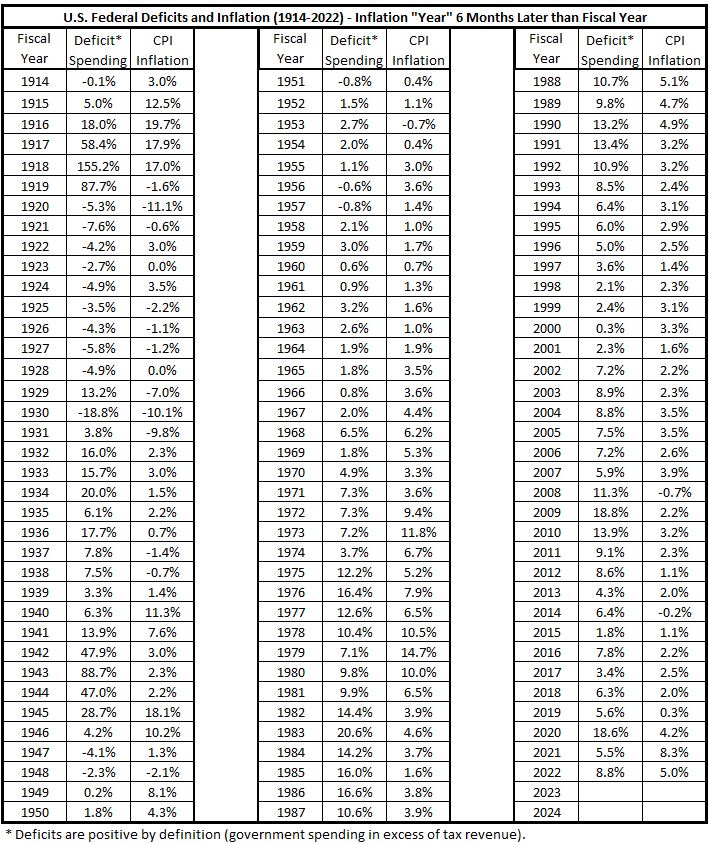
The sources and procedures for organizing the above data are described in Part 11, Appendix.2
The periods of significant increases in inflation are given in Table 6, as posted previously.1
Table 6. Periods of Significant Increases of Inflation 1914-2022
Likewise, the periods of significant decreases in inflation are given in Table 7, also posted previously.1
Table 7. Periods of Significant Decreases of Inflation 1914-2022
Analysis
In this post, we will look individually at the ten periods of significant inflation increases 1914-2022.
1915-1917
This period covers the two years preceding the U.S. entry into World War I plus the year with the first nine months for U.S. as a combatant. The specific data extracted from the tables in the data section above is shown in the Appendix, and the following three figures are create dfrom that data.
Figure 1. U.S. Federal Deficit Spending and Inflation for the Fiscal Years 1914-1918
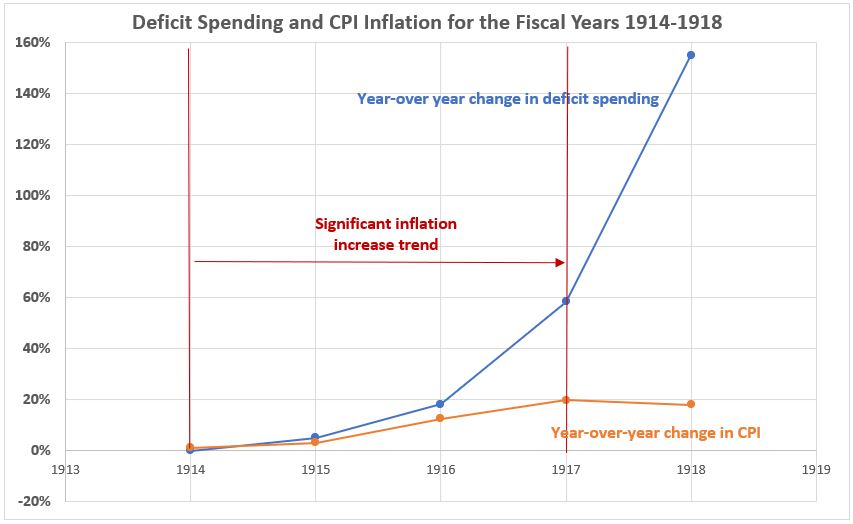
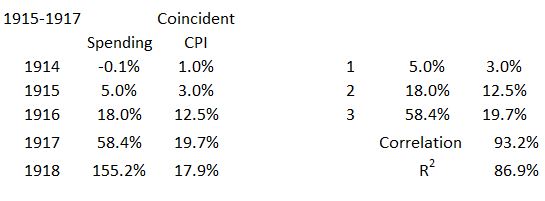
The deficit spending in the two years prior to the U.S. entry into World War I in April 1917. Even though federal deficit spending increased markedly in 1917, inflation continued at nearly the same rate as for 1916. In 1918 deficit spending surged to the largest percentage increase for the entire period 1914-2022, while the growth of inflation actually was lower.
Figure 2. Annual Changes in Deficit Spending vs. Inflation for the Fiscal Years 1914-1918

There are two trendlines for the data in Figure 2. The blue is for the years 1914-1918 and the red for the years 1915-1917 when a significant increase in inflation took place. As seen in the Appendix, the R2 value for the three years of red data is larger (89.6%) than for the total five years (67.9%).
Figure 3. Correlation Between Deficit Spending and Inflation 1915-1917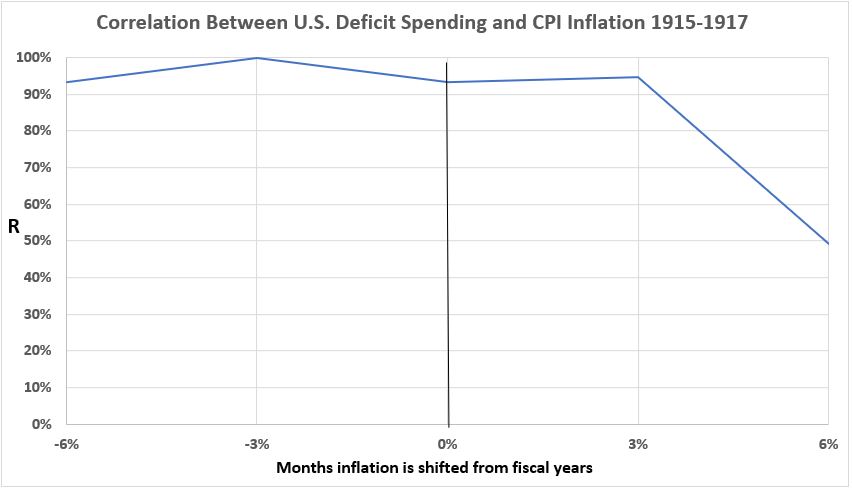
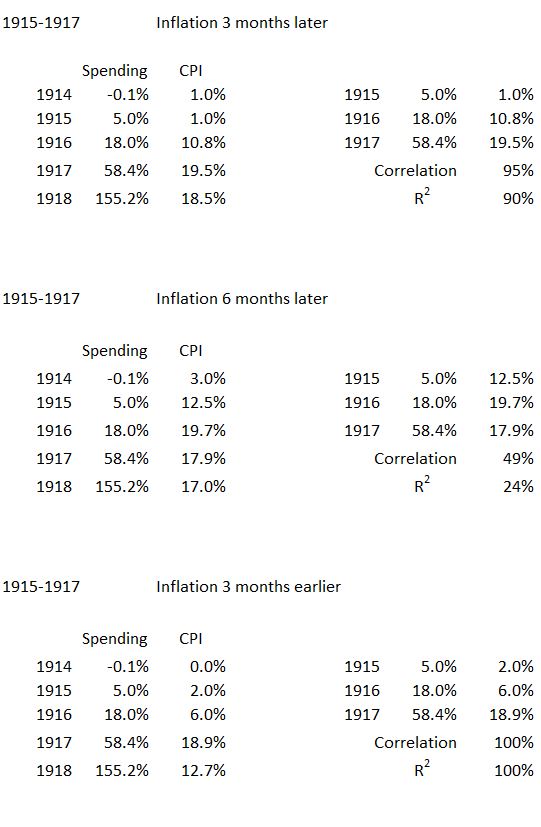
There is a strong association between deficit spending and inflation when the inflation preceeds spending by 3 and 6 months and when the inflation follows spending by 3 months. But the association sees a major decline for inflation six months after the spending.
1922-1923
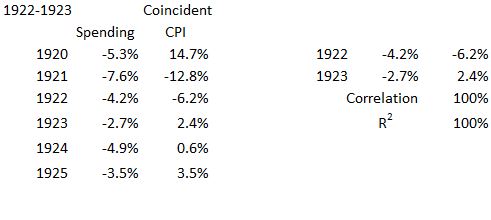
This period followed the severe 18 month recession of 1920-21, which ended in July 1921. The data used for analysis is shown in the Appendix.
Figure 4. U.S. Federal Deficit Spending and Inflation for the Fiscal Years 1920-1925
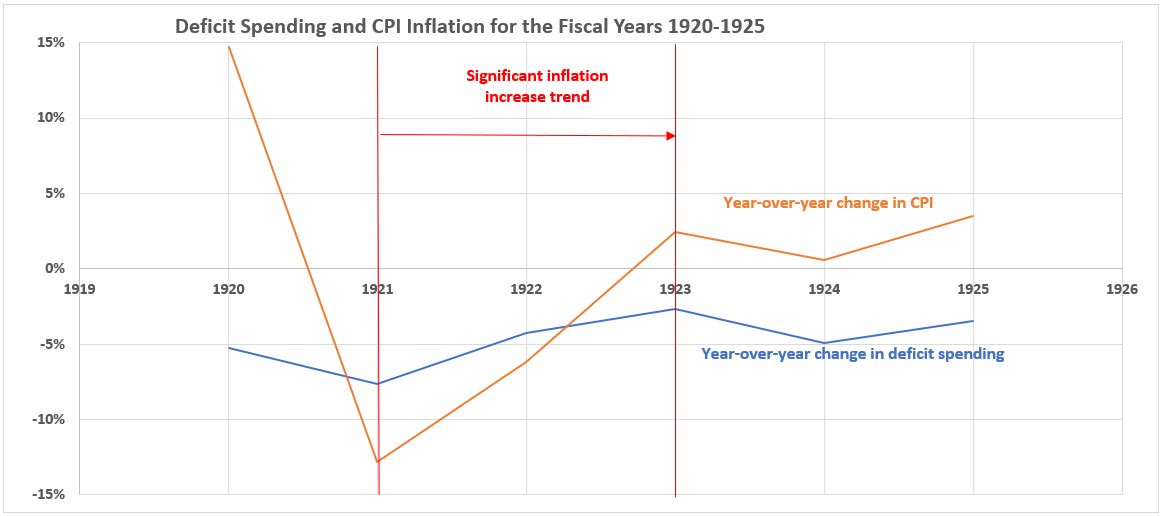
Inflation increased more rapidly in this period than did the growth in government spending. Note that, although government spending was in surplus for every year on this graph, the surpluses were decreasing in 1922 and 1923. This is equivalent in trend to increasing deficit spending.
Figure 5. Annual Changes in Deficit Spending vs. Inflation for the Fiscal Years 1920-1925
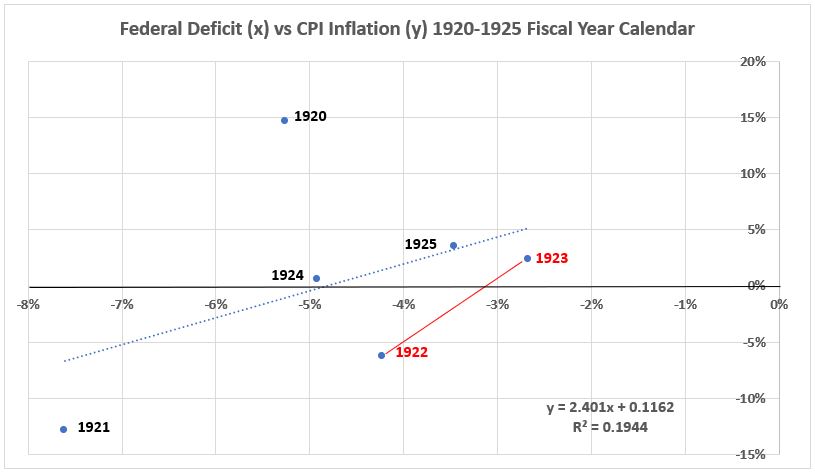
The trendlines are shown for the entire six years of data (blue dots) and for the change for 1922 and 1923 (solid red). The R2 value for 1922-1923 is much larger (100%, see Appendix) than for the entire six years shown in the graph (19%).
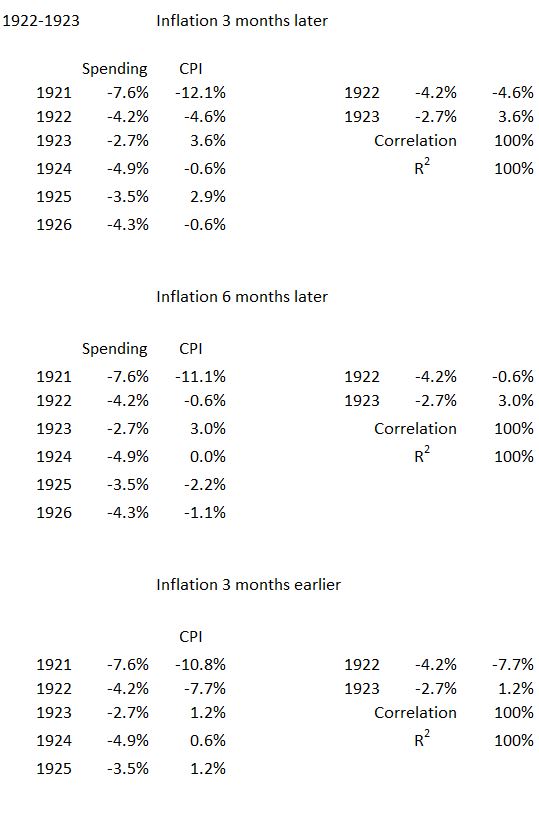
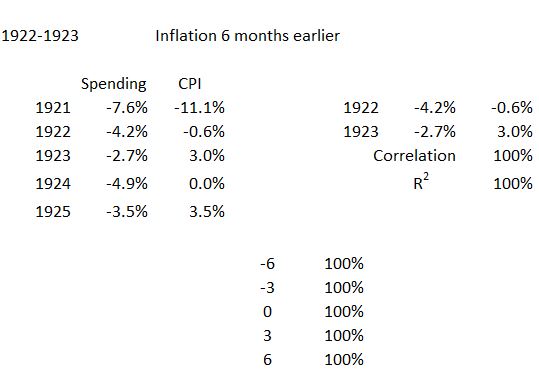
No graph is shown for correltion between deficit spending and inflation for this period. The correlation is 100% for all five alignments of inflation with the fiscal calendar: ±3 and ±6 months plus coincident alignment.
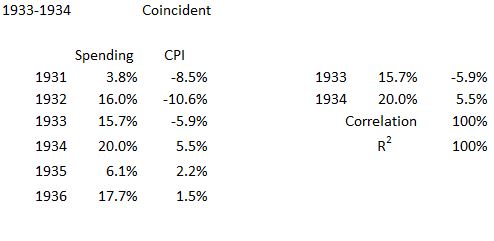
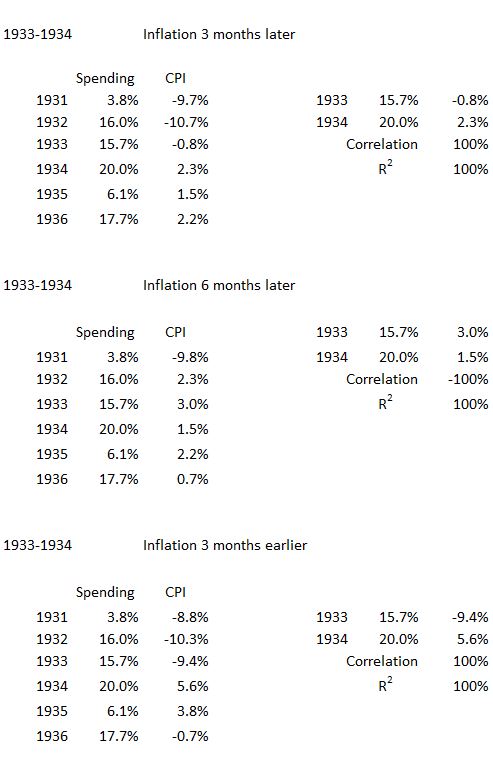
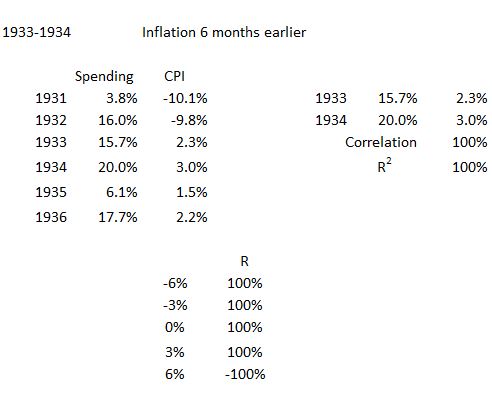
1933-1934
This period covers the first two years after the bottom of The Great Depression (March 1933). See the Appendix for the specific data.
Figure 6. U.S. Federal Deficit Spending and Inflation for the Fiscal Years 1931-1936

Deficit spending and inflation both saw dramatic increases during this time period.
Figure 7. Annual Changes in Deficit Spending vs. Inflation for the Fiscal Years 1931-1936
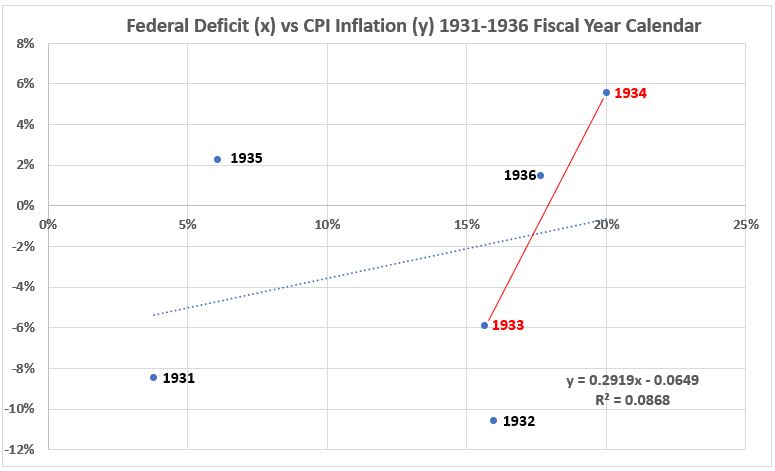
The trendlines are shown for the entire six years of data (blue dots) and for the change for 1933 and 1934 (solid red). The R2 value for 1922-1934 is much larger (100%, see Appendix) than for the entire six years shown in the graph (9%).
Figure 8. Correlation Between Deficit Spending and Inflation 1933-1934

This is similar to the correlation see for 1915-1917. The association is strong when the inflation preceeds spending by 3 and 6 months and when the inflation follows spending by 3 months. But the correlation declines to -100% for inflation six months after the deficit spending.
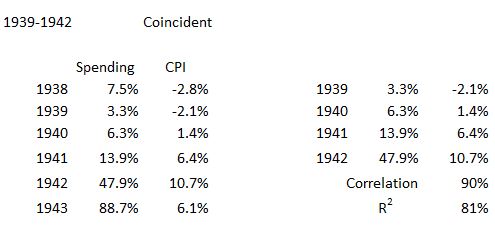
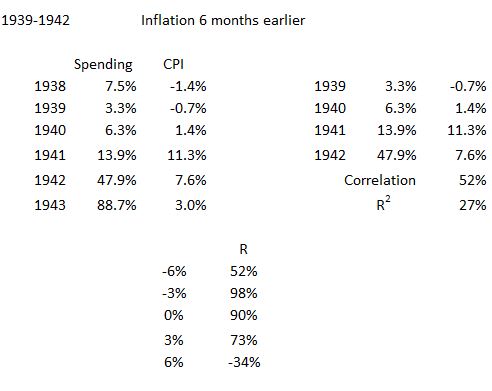
1939-1942
Figure 9. U.S. Federal Deficit Spending and Inflation for the Fiscal Years 1938-1943
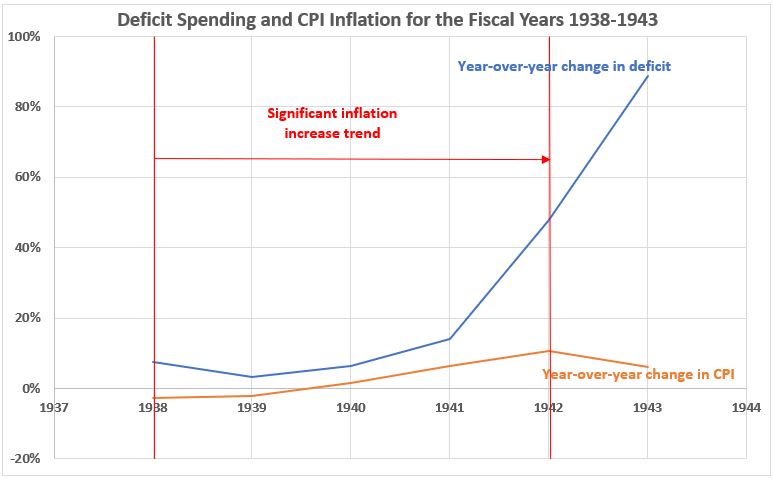
The increases in deficit spending and inflation are similar for 1940 and 1941. For 1939 deficit spending deceased from the previous year but inflation increased slightly. In 1942, deficit spending surged dramatically, but inflation continued increasing at the slower established trend. A factor in the slower inflation increase for 1942 was the implementation of wage and price controls in September of that year.
Figure 10. Annual Changes in Deficit Spending vs. Inflation for the Fiscal Years 1938-1943
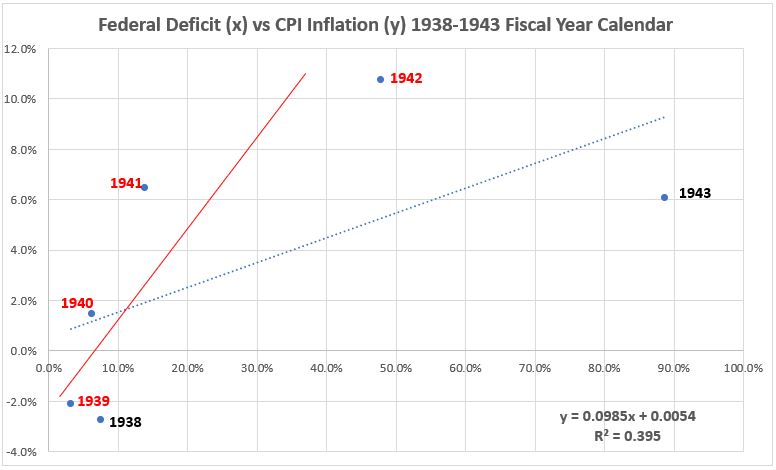
The trendline for the entire six years of data (blue dots) has a significantly smaller slope for the time period 1938-1943 than does the trendline for the inflation surge years 1939-1942 (solid red). The R2 value for 1939-1942 with inflation coincident is larger (81%%, see Appendix) than for the entire six years shown in the graph (39.5%).
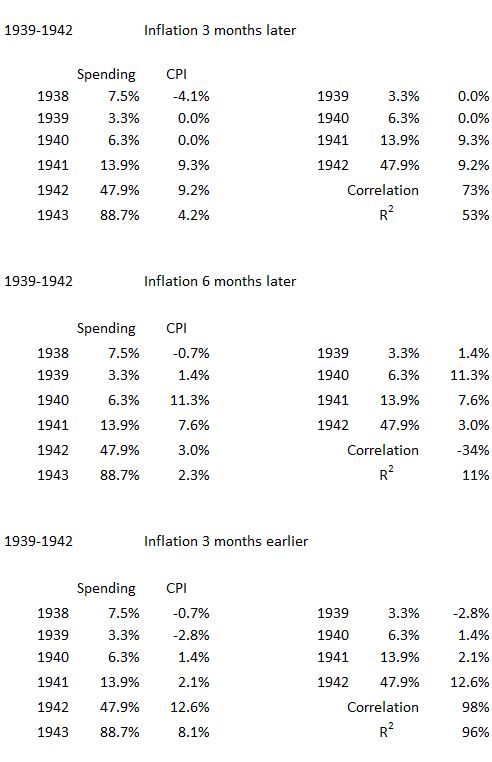
Figure 11. Correlation Between Deficit Spending and Inflation 1939-1942
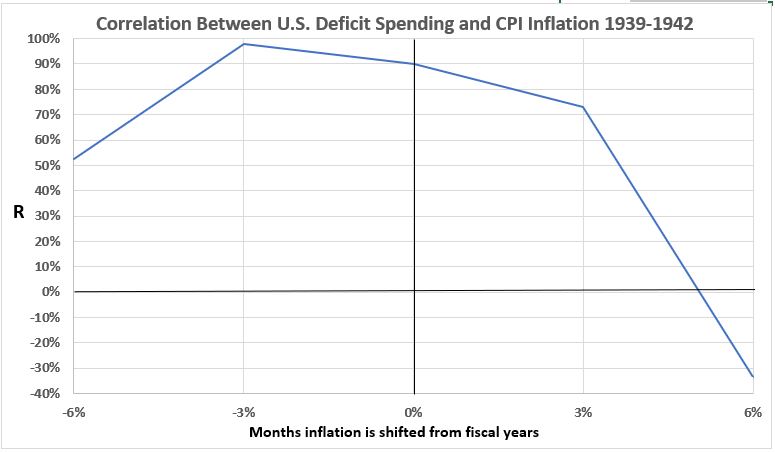
The association between deficit spending and inflation is strong for coincident alignment of inflationwith fiscal years for coincidence and leads/lags of ±3 months.For inflation six months earlier than spending, the correlation is moderate. Inflation six months later than spending has negative correlation. For this inflation surge the possibility of inflation leading deficit spending is greater than for spending causing inflation. Note: The word “possibility”, association does not prove causation.
1945-1947
Figure 12. U.S. Federal Deficit Spending and Inflation for the Fiscal Years 1943-1948
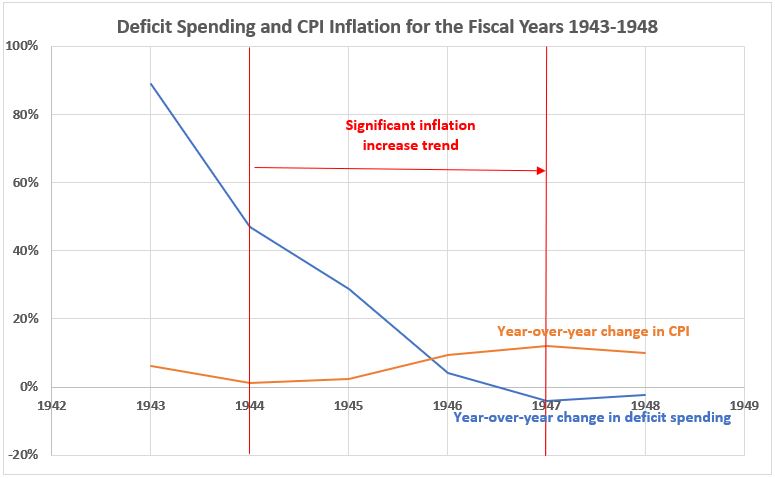
The increase in inflation with a sharp decline in federal deficit spending was caused by three things:
- Price and wage controls ended in 1946.
- The transition from war to peacetime production took time.
- Private savings had built up to high level during the rationing years.
Figure 13. Annual Changes in Deficit Spending vs. Inflation for the Fiscal Years 1943-1948
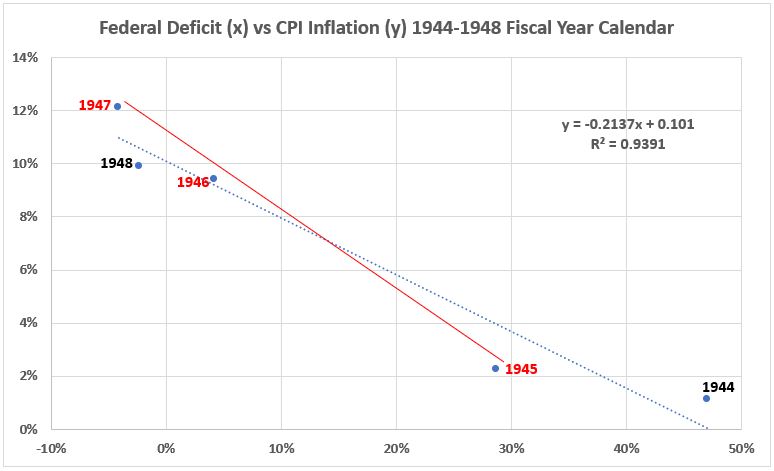
The slopes of the two trendlines are similar, as are the R2 values: 100% (red) and 94% blue. This occurred even though inflation was increasing for the red years and declining for the black years.
Figure 14. Correlation Between Deficit Spending and Inflation 1945-1947
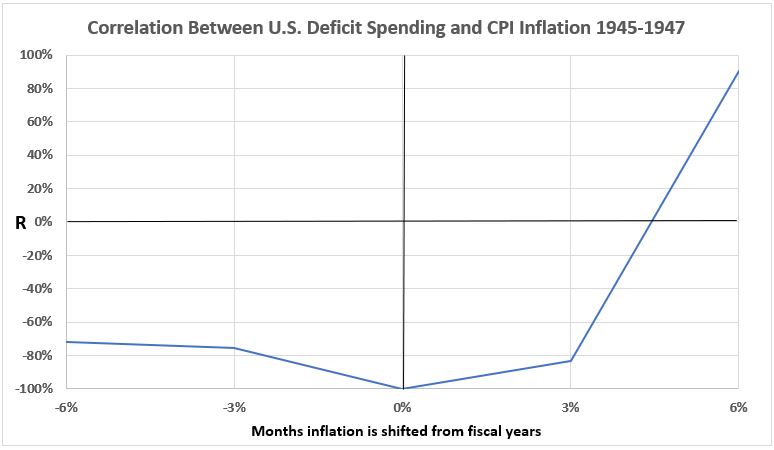
There was strong negative correlation for inflation aligned six and three months before deficit spending, three months following, and coincident with spending. However, six months following the spending the association is strong. This data supports the possibility that inflation can be caused by federakl government deficit spending.
1950-1951
Figure 15. U.S. Federal Deficit Spending and Inflation for the Fiscal Years 1948-1953
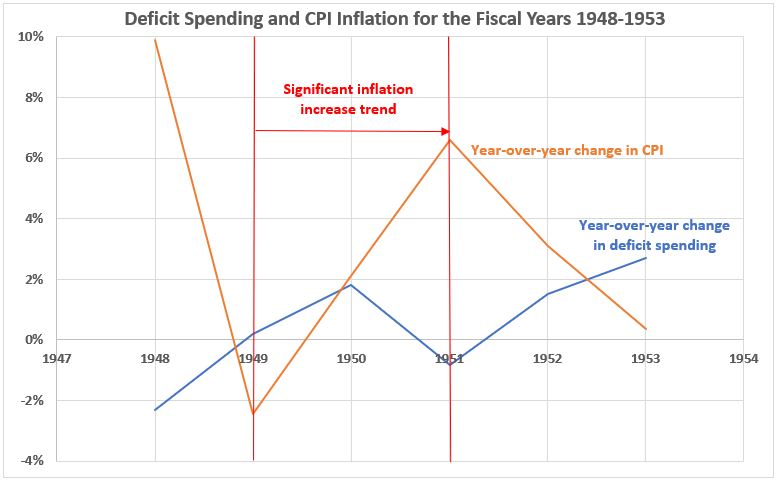
The variations in inflation and disinflation during this time period are much larger than the variations in deficit spending. (Two years,1948 and 1951, even have negative deficits – the federal government budgets were in surplus.) The average federal deficit over the six years is only slightly positive (0.55% – that’s just over 1/2 of 1%). The inference is that something other than federal spending must be causing the very large positive/negative inflation swings.
Figure 16. Annual Changes in Deficit Spending vs. Inflation for the Fiscal Years 1950-1951
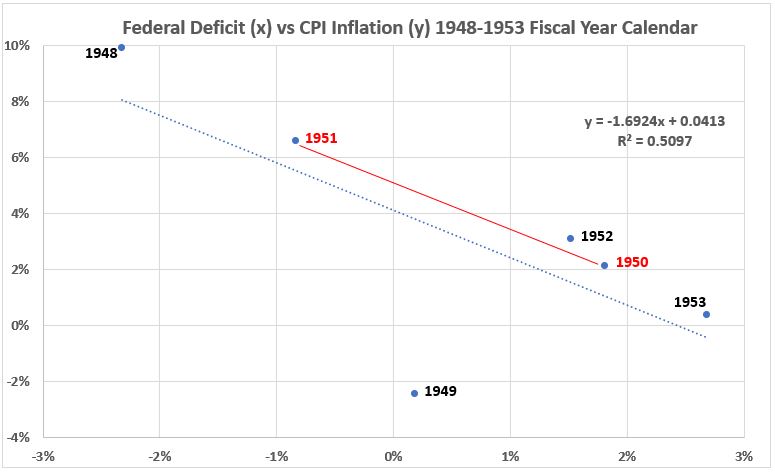
The trend lines for 1948-1953 and 1950-1951 are parallel. This is a surprising result (at least to me) because 1950-51 has a significant surge of inflation while the six-year period contains two major disinflationary surges bracketing the inflation. The correlations (R) are different: -71% for 1948-1953 and -100% for 1950-1951. However, both R values indicate a strong negative association both both data samples. The inference is that there is no “systemic” cause and effect possible between the two variables during this time period.
Figure 17. Correlation Between Deficit Spending and Inflation 1950-1951
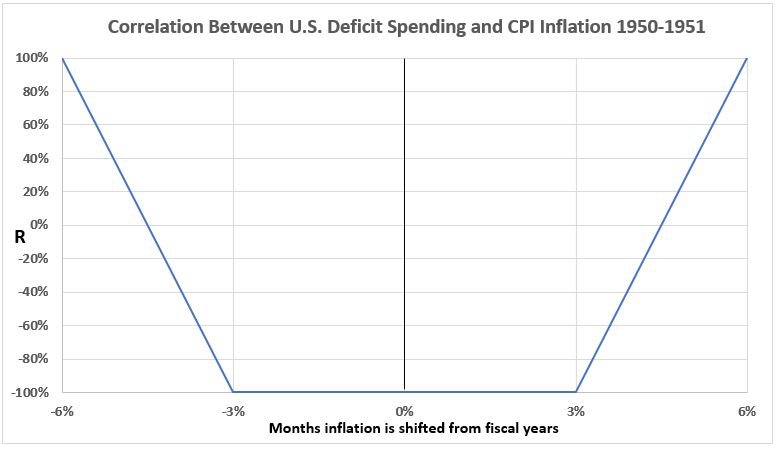
Taken on face value in isolation, one might conclude that deficit spending is associated with inflation six months earlier and also with inflation six months later. This would be in sharp contrast to the two variables having a strong negative correlation when timelines are coincident and when displaced by ±3 months. While the strong negative correlations may have some meaning, for the time being we must reserve judgment about the ±6 months strong positive correlations because they may be influenced by the very large disinflations in the years immediately preceeding and following the two-year inflation surge.
1960-1969
Figure 18. U.S. Federal Deficit Spending and Inflation for the Fiscal Years 1959-1970
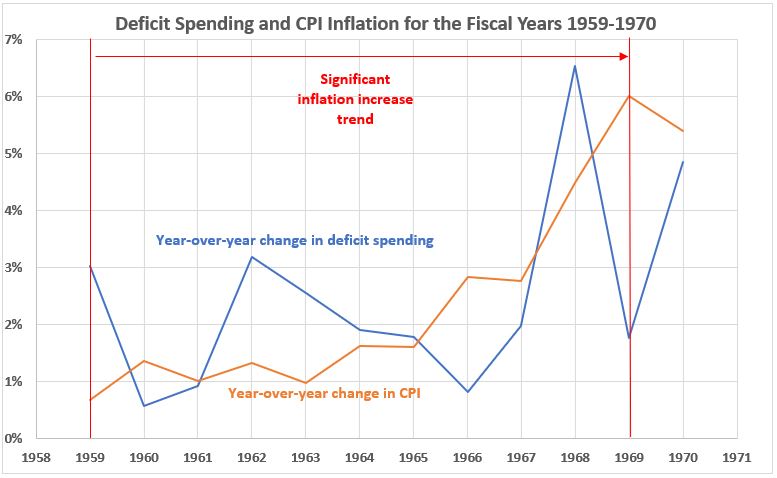
This is the longest lasting significant rise in inflation for the 1914-2022 period. The associations found between deficit spending and inflation are changed between the start of this decade and the end, as discussed below.
Figure 19. Annual Changes in Deficit Spending vs. Inflation for the Fiscal Years 1960-1969
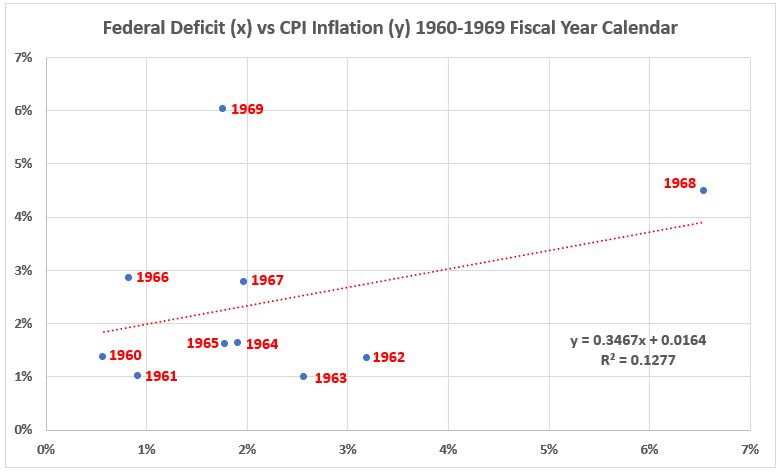
The scatter diagram is interesting in that the year 1969 appears to be a possible outlier. Looking at Figure 18 shows the reason. Both 1968 and 1969 had comparable inflation surges, while deficit spending rose sharpley in 1968 and fell sharply in 1969. So, rather than being considered as an outlier to data for the rest of the decade, the 1969 data point should be highlighted as an example of how correlation between deficit spending and inflation can be drastically changed from year to year.
Figure 20. Correlation Between Deficit Spending and Inflation 1960-1969
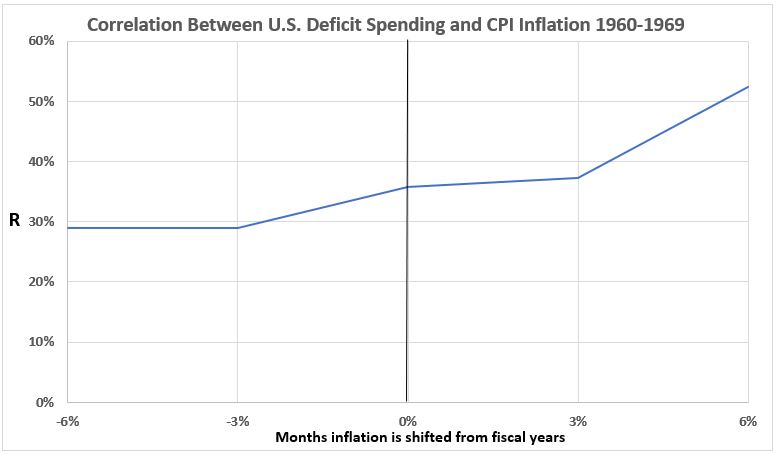
During this decade long increse in inflation, the association between deficit spending and inflation for all but one alignments are weak (coincident, ±3 months, and -6 months). But for inflation lagging deficit spending by six months, the association reaches into the moderate range. This upper limit of the possible cause and effect relationships falling between ~8% (-3 and -6 months) and 27% (+6 months) indicate that there are likely more impactful causes for inflation in the 1960s.
1973-1974
Figure 21. U.S. Federal Deficit Spending and Inflation for the Fiscal Years 1971-1976
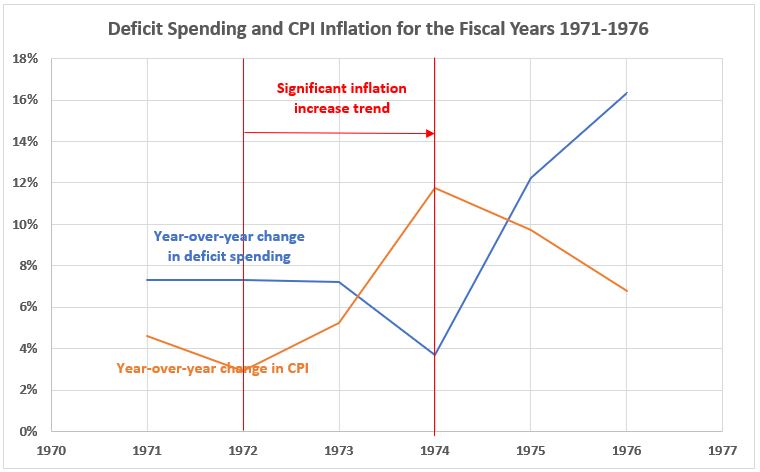
Both inflation and deficit spending have major increases during this period. There is an obvious (by inspection) large positive correlation for inflation with deficit spending two years later.
Figure 22. Annual Changes in Deficit Spending vs. Inflation for the Fiscal Years 1971-1976
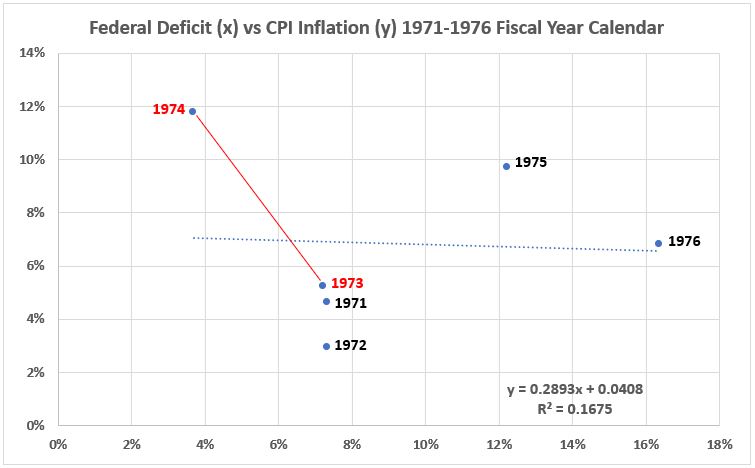
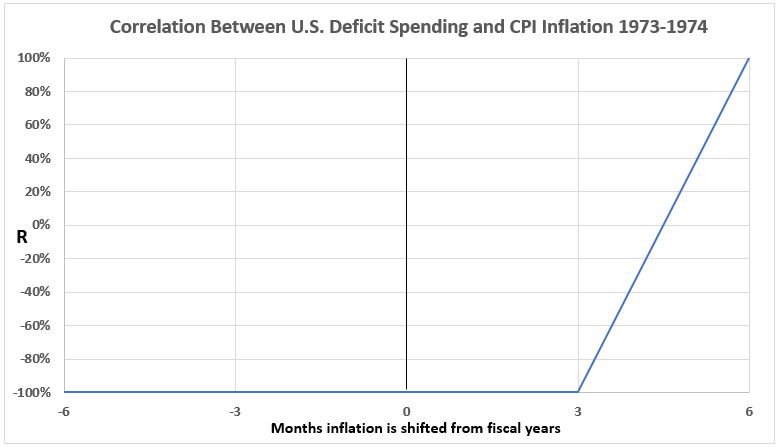
For the years 1973-1974, R2 = 100% (R = -100%). For the entire six years 1971-1976, R2 = 17%. The data for inflation and deficit spending occurring coincidently (Figures 21 and 22) as well as for alignments ±3 and -6 months shows R = -100% for all four alignments. However, the correlation for inflation following spending by 6 months is +100%. (See Figure 23.) This is in contrast to the strong association with deficit spending two years after the inflation surge. In that case, there is potential for an opposite cause and effect, with inflation causing increased deficit spending.
Figure 23. Correlation Between Deficit Spending and Inflation 1973-1974
1978-1980
Figure 24. U.S. Federal Deficit Spending and Inflation for the Fiscal Years 1976-1981
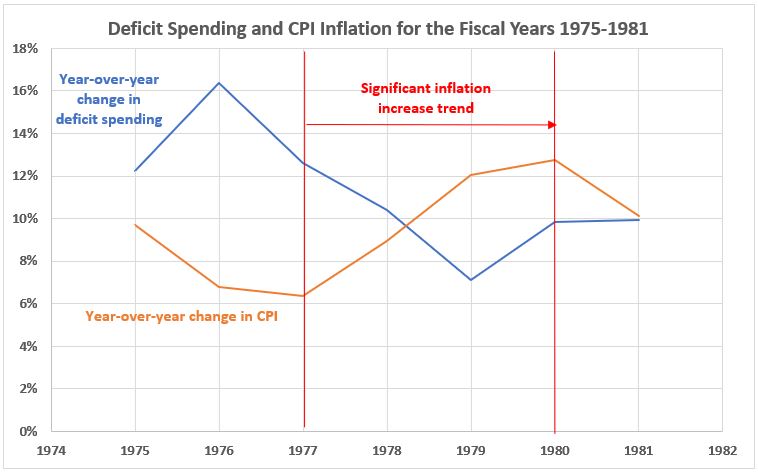
In the six years, two years have inflation and spending moving in the same direction: 1977 (both are declining) and 1980 (both are increasing). As in the case of 1973-1974, visual inspection shows a strong correlation beyween the inflation for 1978 and 1979 with the deficit spending two years later (1980-1981).
Figure 25. Annual Changes in Deficit Spending vs. Inflation for the Fiscal Years 1976-1981
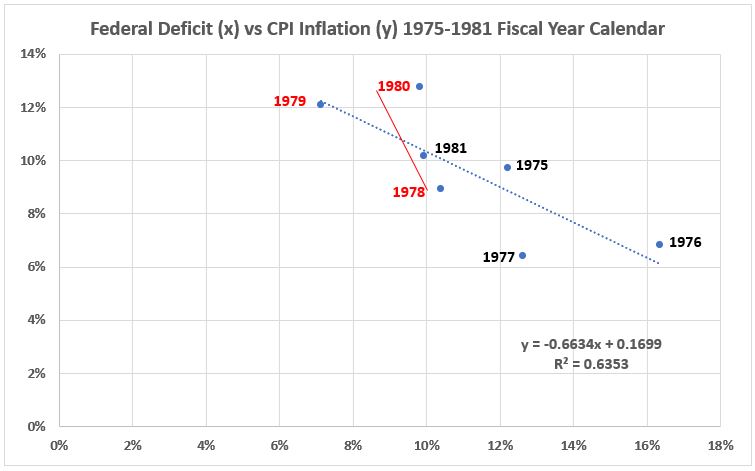
The correlations here are strongly negative: For all seven years, R = -79.7%, and for the three red years, R = -50%.
Figure 26. Correlation Between Deficit Spending and Inflation 1978-1980
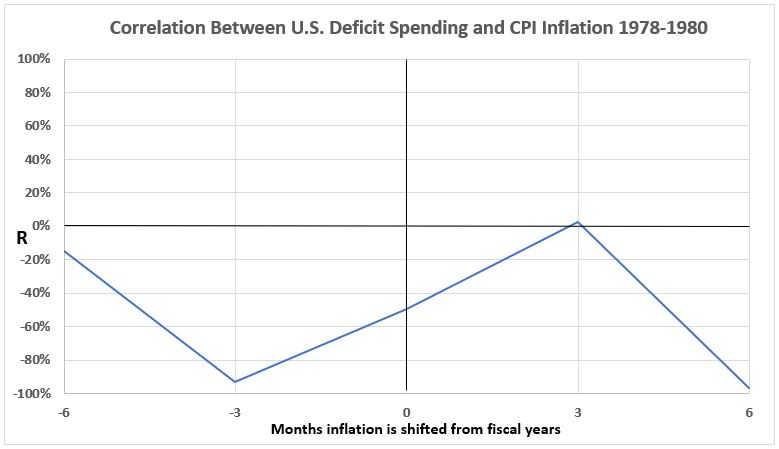
There appears to be no possibility of any immediate cause and effect between inflation and deficit spending, as all correlations for alignments within ±6 months are either null or negative. However, there is the observed positive correlation for 1978-1979 inflation with deficit spending two years later.
2021-2022
Figure 26. U.S. Federal Deficit Spending and Inflation for the Fiscal Years 2018-2022
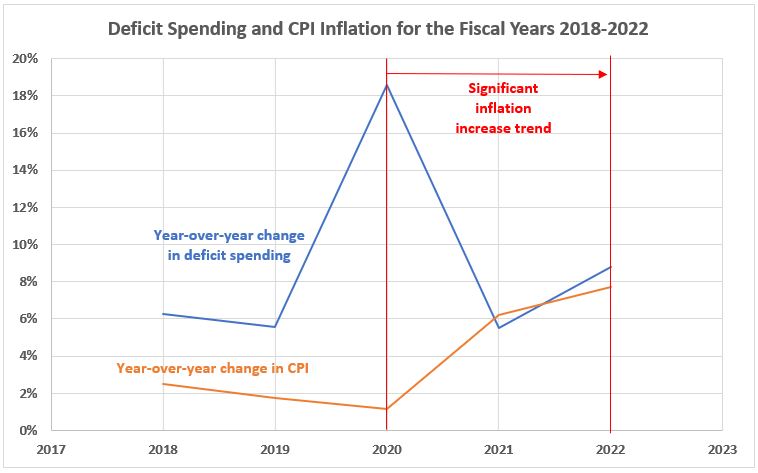
In the four year period, two years have deficit spending and inflation moving in the same direction: 2019 (both are declining) and 2022 (both are increasing). We see that the 2020 increase in deficit spending is correlated with an increase in inflation one year later, but the comparable decrease in deficit spending in 2021 does not correlate with inflation in 2022, which continued to increase.
Figure 28. Annual Changes in Deficit Spending vs. Inflation for the Fiscal Years 2018-2022
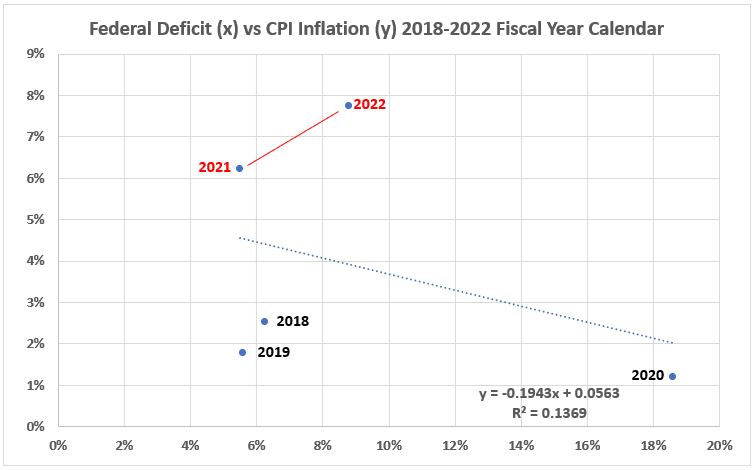
The correlations are negative for the five years (R = -37%) and positive for the two year inflation surge.
Figure 29. Correlation Between Deficit Spending and Inflation 2021-2022
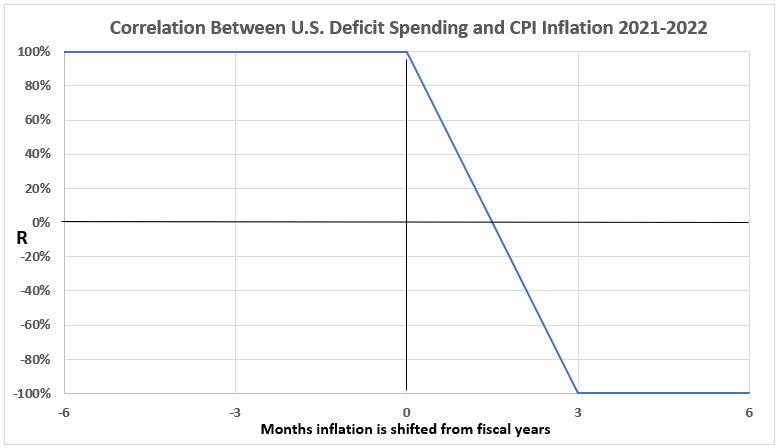
For this data, inflation three and six months before deficit spending has positive correlation, as well as inflation coincident with deficit spending. However, inflation three and six months after deficit spending in negatively correlated.
Analysis Summary
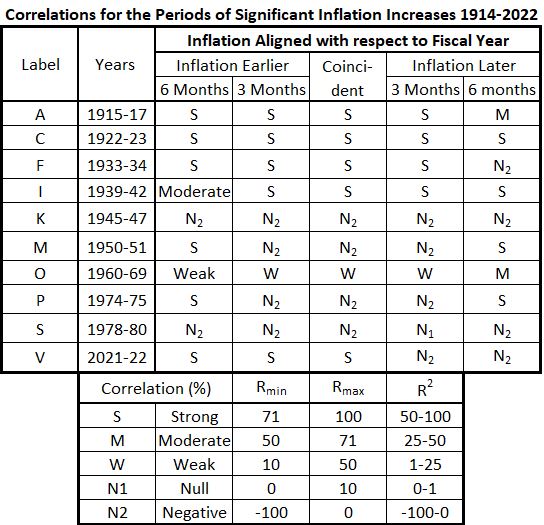
There are no pervasive patterns for the association of inflation with deficit spending across the ten periods that saw significnat inflation increases over the years 1914-2022. This is emphasized in Table 8 which summarizes the analysis results above.
Table 8. Summary of Correlation Results for Significant Inflation 1914-2022
It is now evident why no usable results were obtained when we tried time series analyses of inflation and deficit spending over the time period 1914-2022. There are clearly no trends in the association of inflation with deficit spending that apply generally across many years, at least for a positive association between the two variables.
Conclusion
We can draw some conclusions from the results. Seven of the ten significant inflation periods do have some strong associations between deficit spending and inflation. But there is limited evidence that deficit spending might possibly cause inflation (or that inflation might cause increased deficit spending). The word limited is key because there are some hints here and there that inflation has led deficit spending increases and vice versa. Proof is another question.
Strongest Correlations
- The 1922-23 inflation surge shows strong correlations across all the alignments tested. Thus the association is strong when inflation leads spending as well as when spending leads inflation.
- The 1915-17 inflation surge also shows strong correlations across all alignments tested, except the correlation declines to moderate when spending leads inflation by 6 months.
- In 1933-34, the pattern of 1915-17 is repeated except that the correlation becomes negative when spending leads inflation by 6 months.
- In 1939-42, the pattern shows a moderate correlation for inflation leading spending by 6 months. Then all other alignments show strong correlations
Next Strongest Correlation
The inflation surge (apparently) just completed in 2021-22 had strong correlation when spending and inflation were coincident and when inflation led spending by three and six months but was negative for spending occurring three and six months before inflation.
We did not test spending leading inflation by one year, but Figure 24 shows that the first year of inflation (2021) rose strongly as did deficit spending in 2020. For that one year offset comparison (inflation coming a year later aligned with the previous fiscal year spending), there is obviously a strong correlation. But then the inflation growth was still positive for 2022 which would now be aligned with 2021 deficit spending which declined sharply.
It would seem from the above observations that still more time granularity would be indicated, atleast for some situations.
Strong Correlations, But…
The two periods 1950-51 and 1974-75 have exactly the same pattern. The timeline offsets of ±6 months show a strong correlation but the coincident and ±3 months aligments have negative correlations. This is hard to rationalize. Perhaps both of these inflation surge events are affected by some other variables that create what looks in isolation like a distortion. In such a case, the negative correlations may be realtively more important than the ±6 months strong correlations that could be circumstantial.
Weak and Negative Correlations
After the above inflation surges have been set aside, we are left with inflations surges dominated by weak or negative correlations with deficit spending.
One of these is 1960-69 with weak correlations for all the alignments examined except for moderate correlation for spending leading inflation by 6 months. In such a case, we can infer a negative result, namely the weak correlations limit the possible extent to which one variable might cause the other. R2 gives the limit of the portion of causation for one variable due to the other. If R2= 40%, for variables A and B, then then maximum influence of A on B (or vice versa without independent information about direction) is 40 %. Then 60% or more of B must come from other causes.
But do not forget that with an R2 of any value, there may still be no direct causation. It is a limit of possible causation. Other evidence must be sought to prove that A causes B. And the extent of any causation may be smaller than R2, even zero.
The final two cases are nearly identical: 1945-47 and 1978-80. Each has negative correlations for all offsets tested, with the exception of 1978-80 having a null corelation for inflation following spending by three months. The inference from these results is that federal deficit spending had no immediate causative effect on inflation (or vice versa) during those two inflation surges.
What is Next?
The next project is to repeat the study done here for the eleven significant disinflation periods between 1914 and 2022.
Appendix
Here we show the data selections and statistics for the analysis in each time period with significant positive inflation changes.
1915-1917
1922-1923
1933-1934
1939-1942
1945-1947
Footnotes
1. Lounsbury, John, “Government Spending and Inflation. Part 11”, EconCurrents, May 7, 2023. https://econcurrents.com/2023/05/07/government-spending-and-inflation-part-11/.
2. Lounsbury, John, “Government Spending and Inflation. Part 11”, EconCurrents, May 7, 2023. Appendix. https://econcurrents.com/2023/05/07/government-spending-and-inflation-part-11/.
3. Lounsbury, John, “Government Spending and Inflation. Part 5”, EconCurrents, March 12, 2023. https://econcurrents.com/2023/03/12/government-spending-and-inflation-part-5/.