This article is based primarily on the May 9, 2023, USDA Crop Bulletin which covers the May 1 – 7 period of time. The USDA report becomes available on Tuesdays but I plan to publish my article on Saturdays as it will be featured all day on Saturday. I may later decide to publish this report on Tuesday nights. might add additional information. For those who need the information as soon as possible, the links to the information are provided at the end of the article.
This article includes a short international review of agricultural conditions also
It is early in the season so we are just beginning to have information on most crops. Moisture is not the major issue but some areas have to get a bit warmer.
We start with the National Agriculture Summary. The Tables below the summary may have additional data. The boxes with my comments may be incomplete so for crops of interest check the data out yourself to be sure.
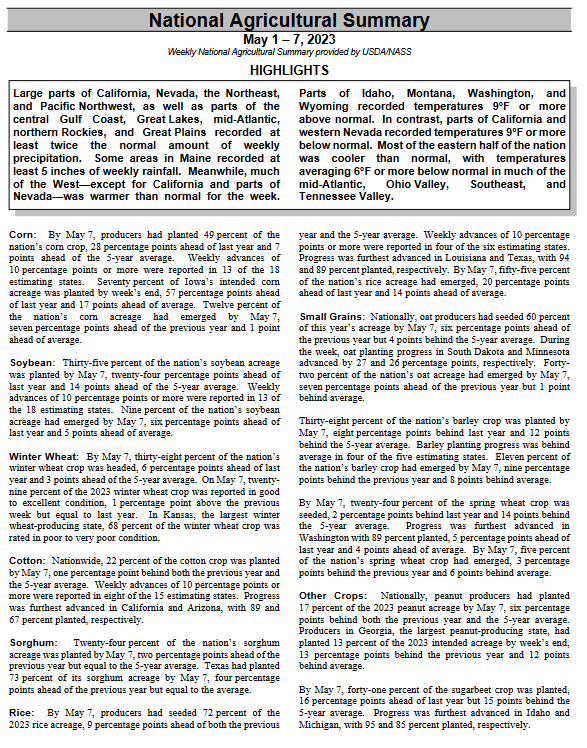
–
| Below is pretty much the same information in table format. However, there is additional information in these tables. |
–
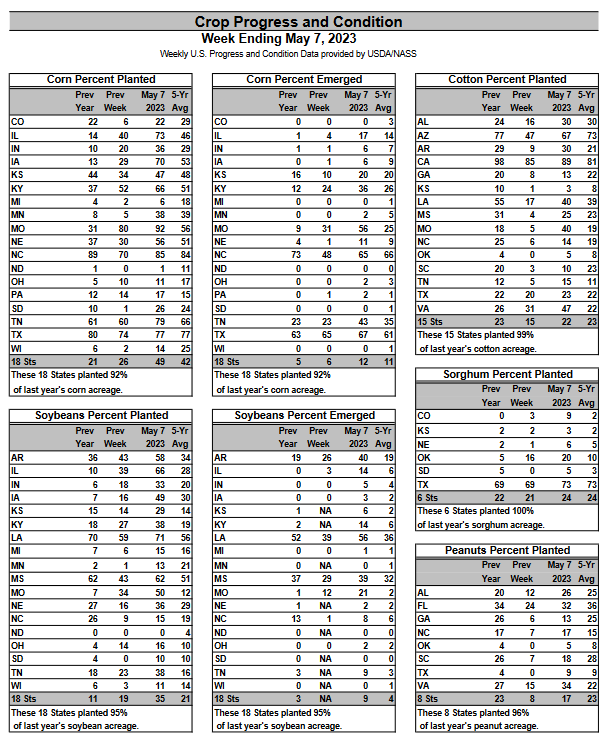
| It is early but soybeans are ahead, the others are too soon to tell. Corn does look a little better than last year and peanuts might be a bit slow. |
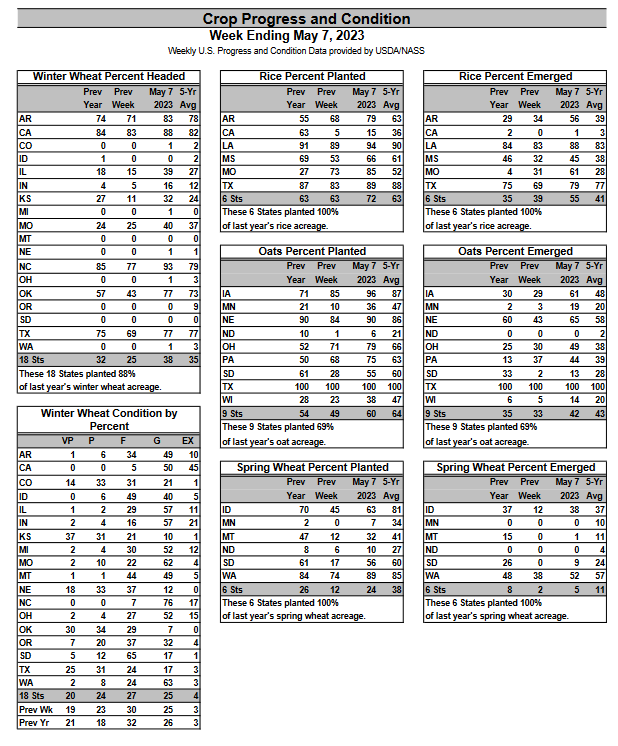
| It is early but Spring wheat is slow. Winter wheat is fine. |
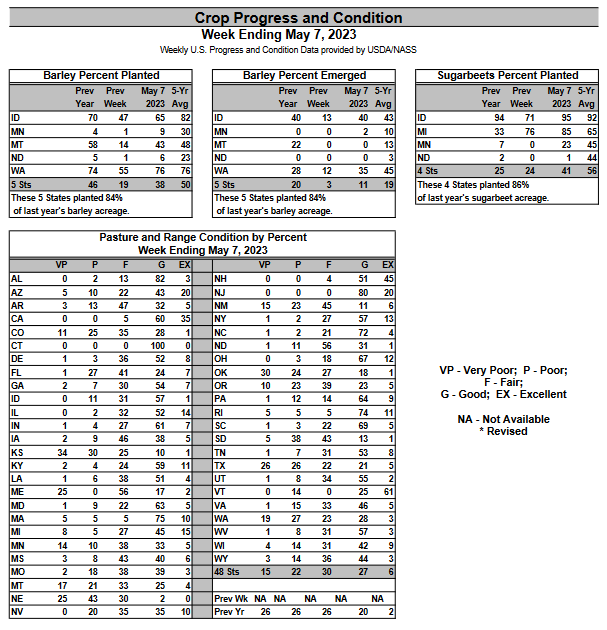
| Barley is slow. Sugar beets are similar to last year but below the five-year average. |
Weather Conditions
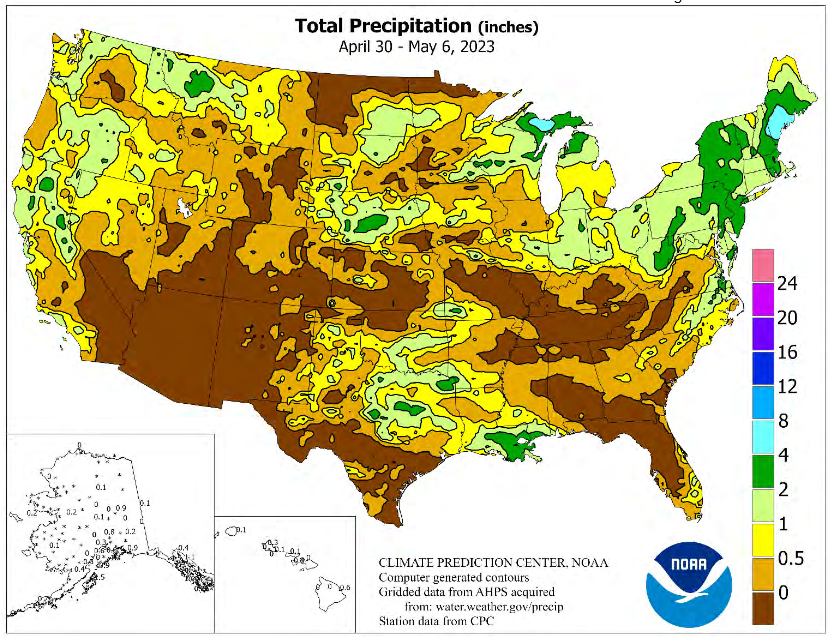
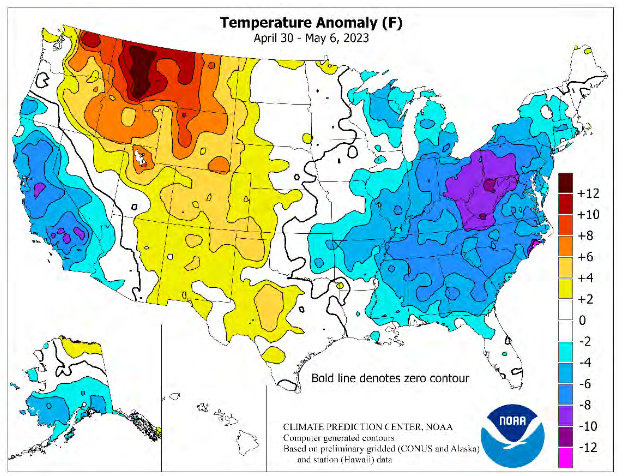
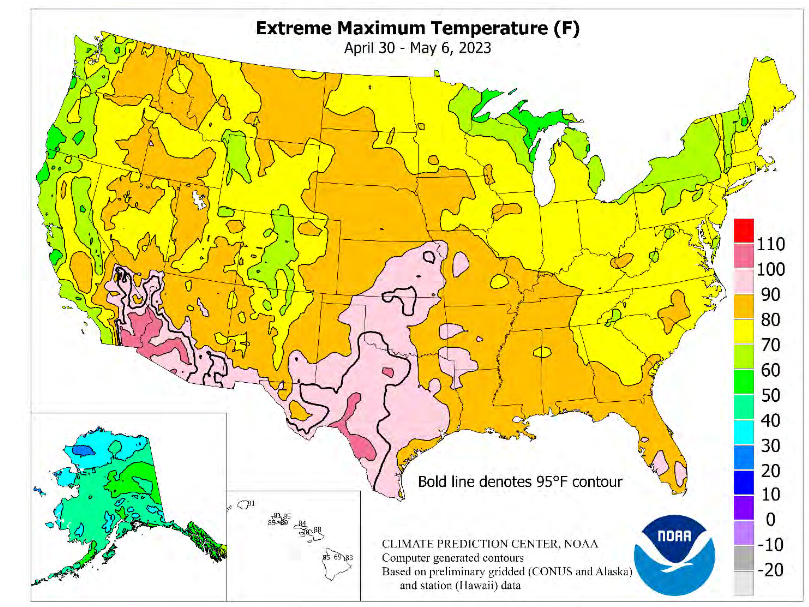
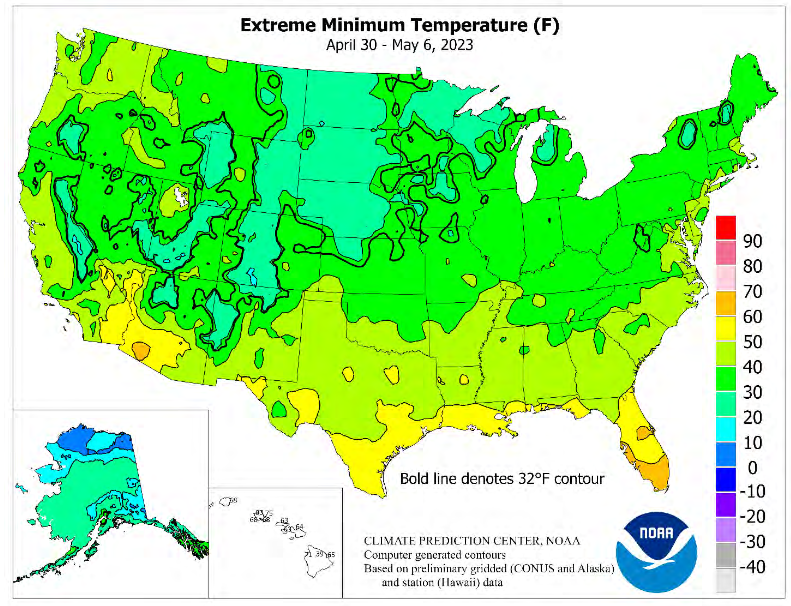
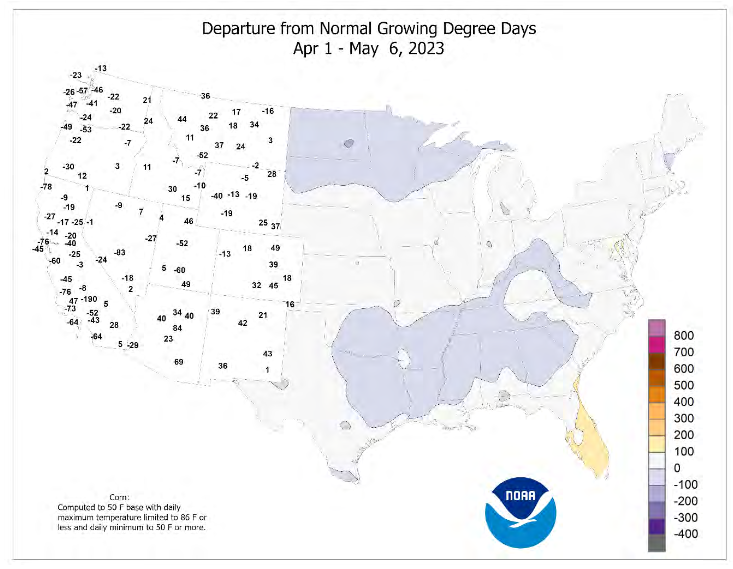
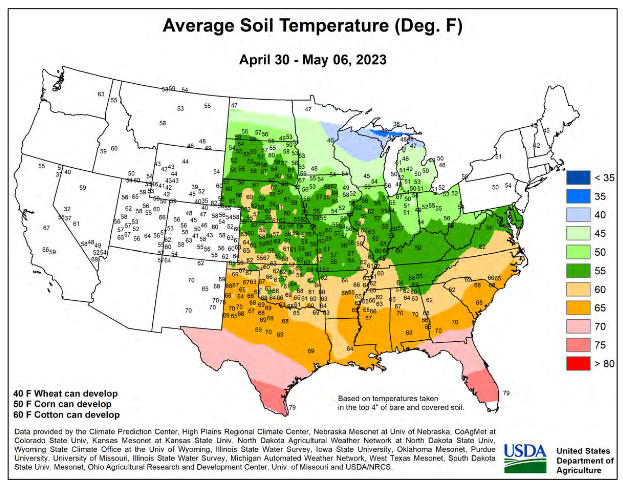
| The minimum temperatures and the cold anomalies are what is of most interest this time of the year. The above four graphics show different things so paying attention to the title of the graphic is important. The second graphic shows the anomalies. The bottom graphic might be the most important one right now in terms of losses to overnight frosts. It looks like it would be minimal |
Some additional information
–
| Mostly this shows where it has been slightly cooled than usual. It has been fairly minor but should show up as slower than usual growth rates. |
–
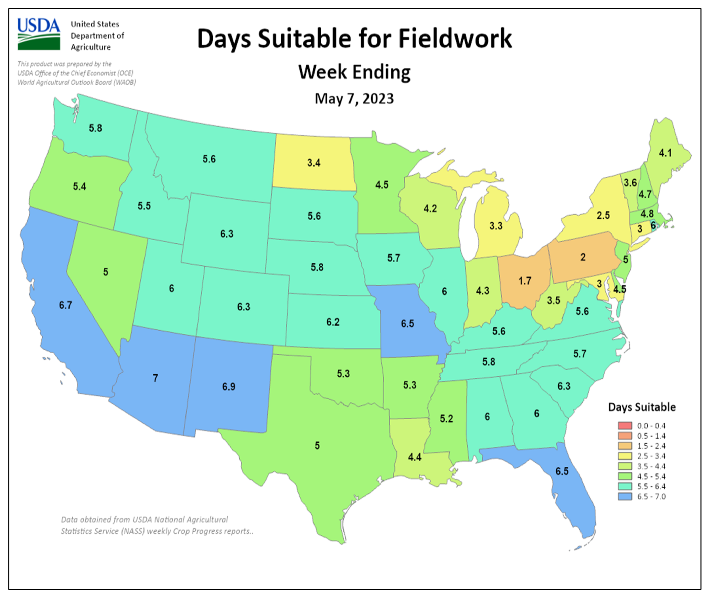
| The yellows and oranges are of interest. They show areas where the number of days suitable for fieldwork was low. |
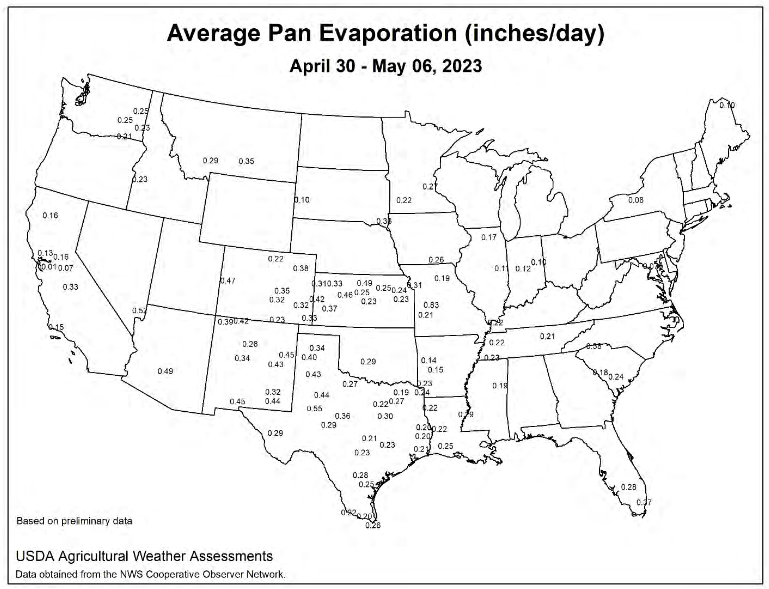
| Pan evaporation refers to the technique (water in a pan) for determining the amount of drying that took place in different areas. Sometimes satellite imagery is used instead of this old-fashioned method but it seems to be preferred in the weekly Crop Bulletin. Very high or low values might be the result of faulty measurement equipment but I did not notice any but I did not study the map carefully. The values that I see are pretty low. That is not surprising given the wet cool weather in much of the area where these readings were taken.When I see values greater than 1.0 I am concerned. |
–
| The Northern Tier still needs to warm up a bit for corn to develop. Excess precipitation may be a problem in the Gulf States. |
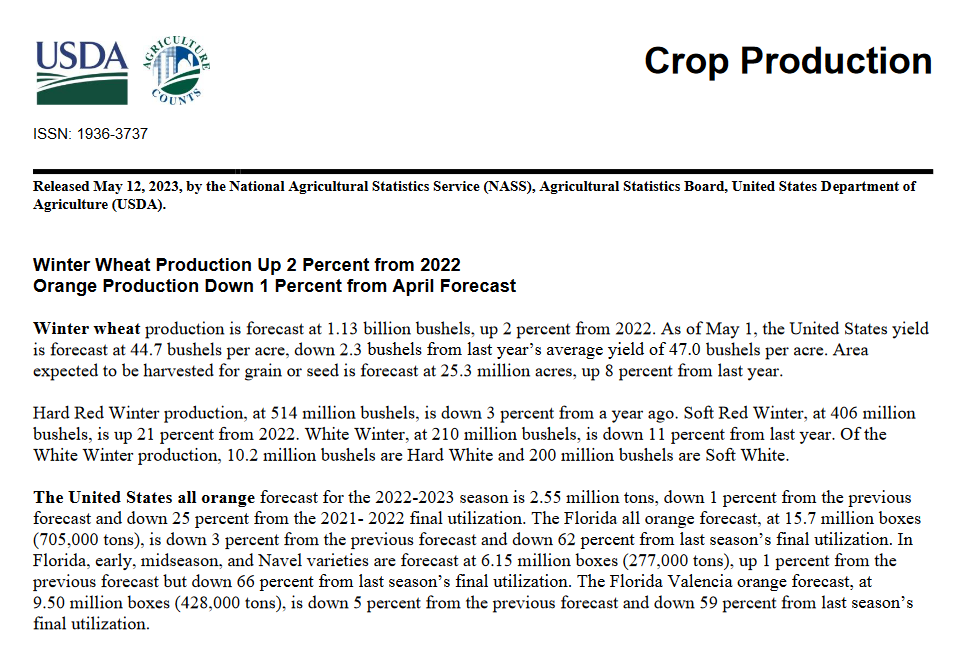
NASS Report of the Week – What is shown is just the highlights. The full report can be accessed HERE.
International
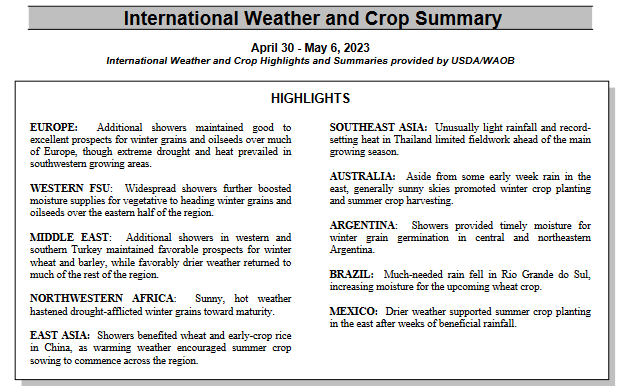
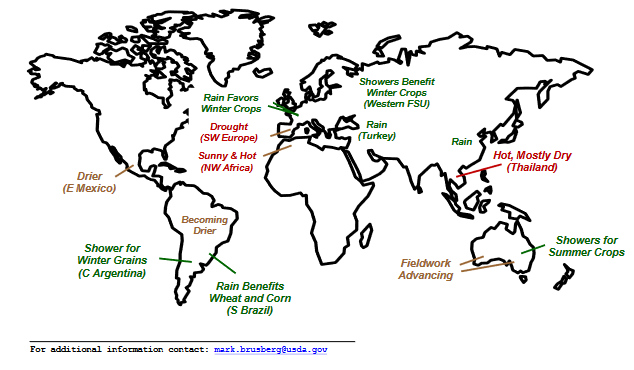
And the map
–
| Southwest Europe seems to be the one area where the weather has been very unfavorable. But conditions in Northwest Africa and Thailand were not ideal. |
Sources of Information
Weekly Updates can be found HERE
and perhaps more directly HERE
Additional Useful Sources of Information
WASDE: World Agricultural Supply and Demand Estimates HERE
NASS Report Schedule HERE
Executive Briefings HERE
Economics and Prices HERE
| I hope you found this article interesting and useful. |
–

