Note: This article was originally posted on May 7, 2023. The Analysis and Conclusion sections were completed on May 8. The final additions to the Appendix were made on May 9.
Previously,1 encouraging results were obtained when correlation analysis was restricted to periods of significant inflation or disinflation. In this post, we examine what can be learned about the correlation between deficit spending and inflation when timeline adjustment of the data is implemented.

Credit: Image by Gerd Altmann from Pixabay
Introduction
In the previous post in this series1 (let’s call it pass 1), the data used was a mixture of inflation which followed deficit spending by 3 months for a part of the 108 years period and by six months for the remainder. This was because the inflation data used was for calendar years, whereas deficit spending was for fiscal years. The U.S. federal fiscal year before 1976 was July 1 year prior to June 30 of the fiscal year. After 1976, the fiscal year ran from October 1 to September 30. This post shows the correlations between deficit spending and inflation when the inflation data is aligned to the fiscal years.
As in the previous post, we continue with the arbitrary decision to define significant changes in inflation, positive or negative, to be 4% or greater. We allow counter-trend moves <1.5% to occur within each larger move. As shown below in the data section, there are 21 such instances between 1914 and 2022. Note: In pass 1 we found 23 instances of significant inflation.
Data
The data is presented here in three groups: Inflation data coincident with fiscal years, inflation data earlier than fiscal years by various amounts and inflation data later than fiscal years by various amounts.
Inflation Coincident with Fiscal Years
The following table shows the data prepared using the process defined in the Appendix.
Table 3. Deficits and Inflation Aligned with Fiscal Years (1914 – 2022)
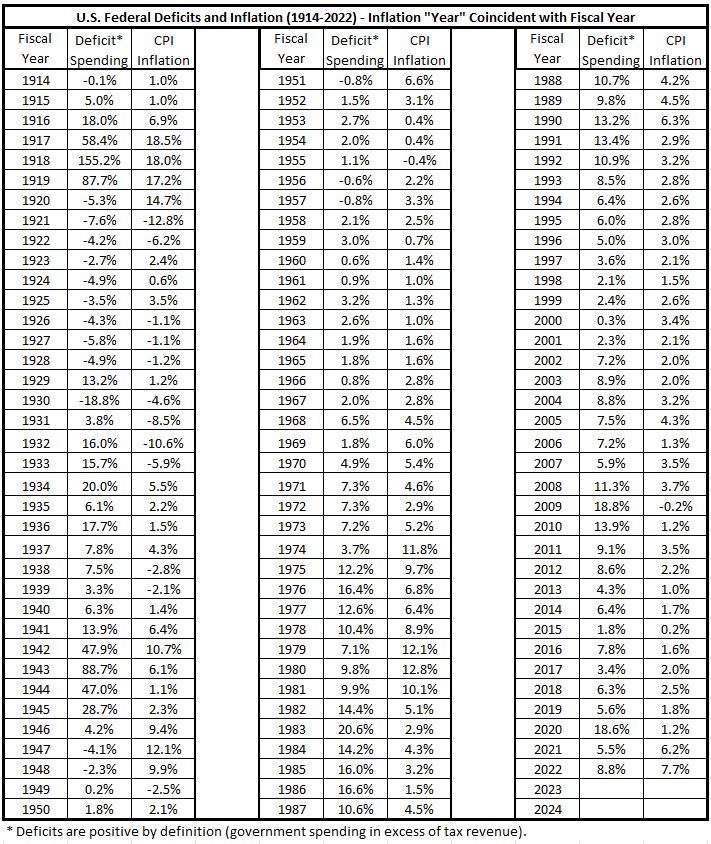
The scatter diagram for the data in Table 3 is shown in Figure 1.
Figure 1. Deficits (x) vs Inflation (y) Aligned with Fiscal Years (1914 – 2022)
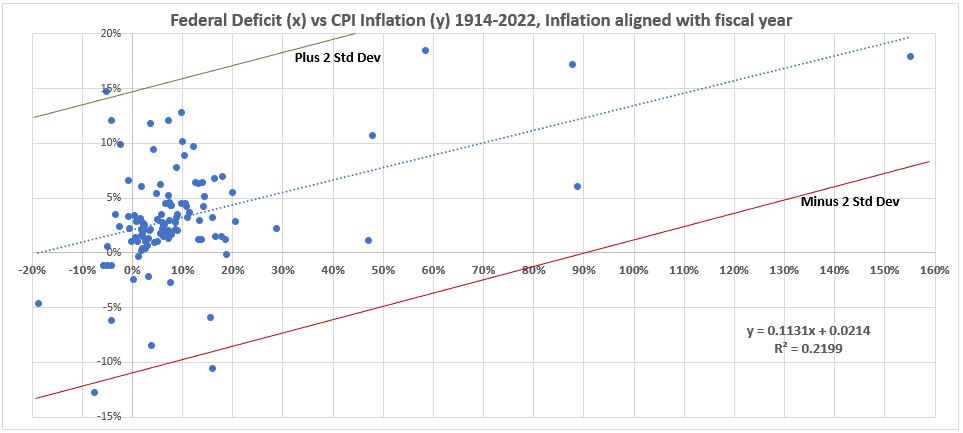
There are no outliers in this data. The expected number of data points falling outside of ± 2σ lines for a normal distribution of 109 data points is 5.45. In figure 1, there are 3 points lying beyond ± 2σ.
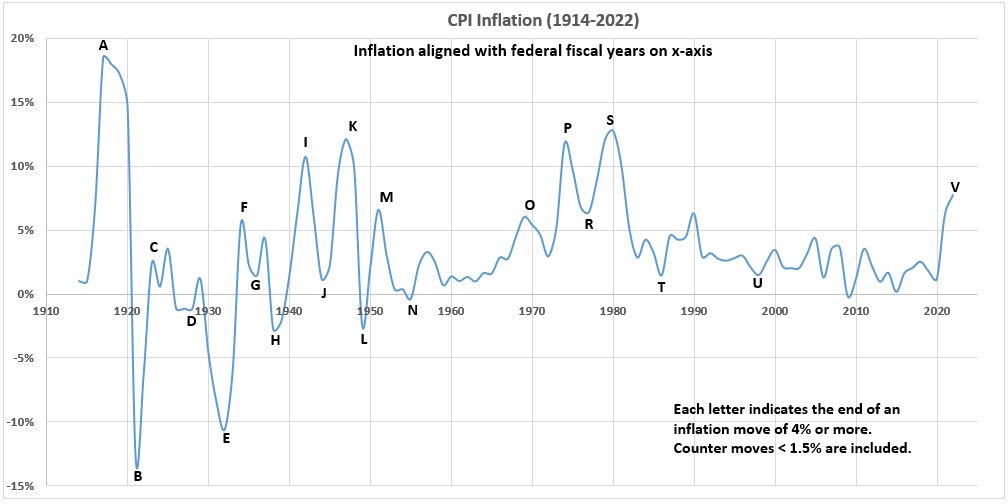
Figure 2. CPI Inflation 1914-2022 with Significant Changes in Inflation Noted
(Each letter identifies the end of a significant move.)
Inflation Earlier than Fiscal Years
The process for generating the data tables is described in the Appendix.
Table 4. Deficits and Inflation Aligned 3 Months Earlier than Fiscal Years (1914 – 2022)
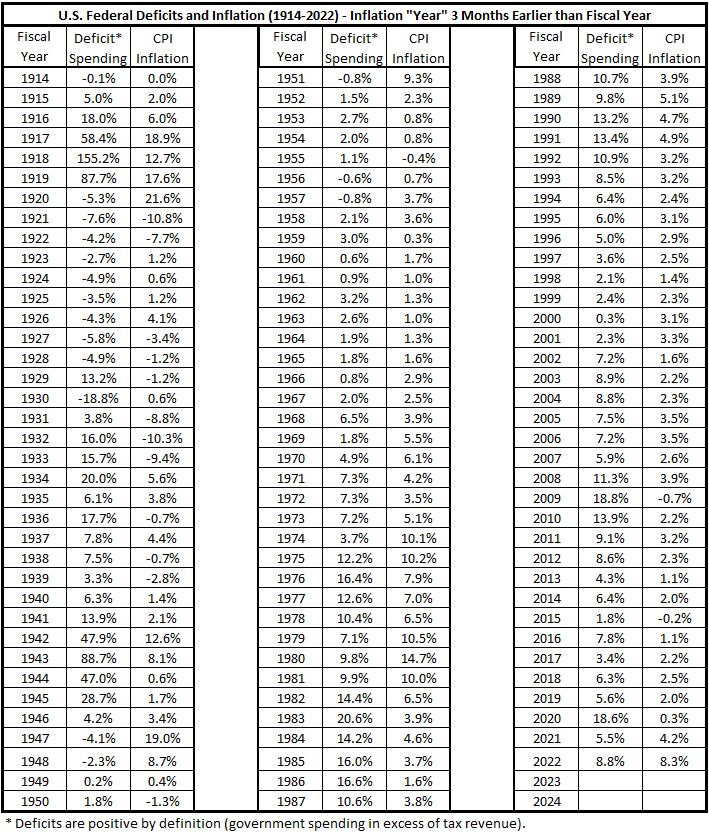
Figure 3. Deficits (x) vs Inflation (y) Aligned 3 Months Earlier than Fiscal Years
(1914 – 2022)
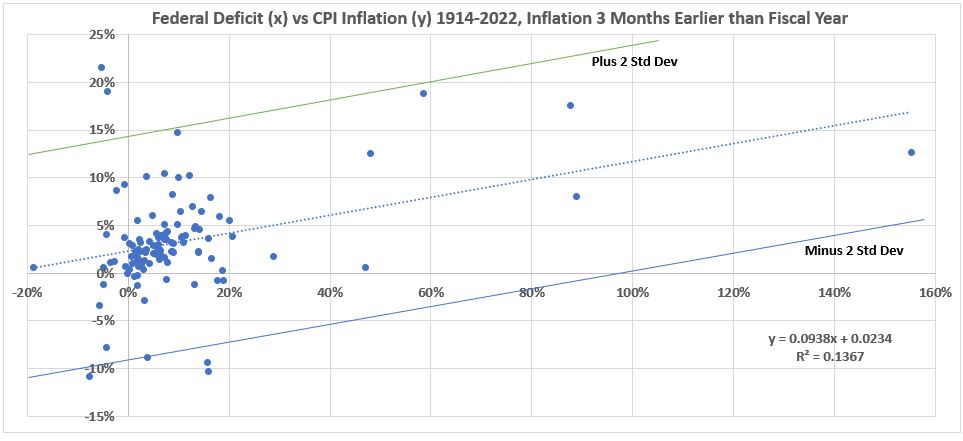
There are five data points lying outside of ± 2σ lines. With 109 data points, there are expected to be 5.4 points beyond of ± 2σ for a normal distribution. Therefore, we are not identifying any outliers in this data set.
Table 5. Deficits and Inflation Aligned 6 Months Earlier than Fiscal Years (1914 – 2022)
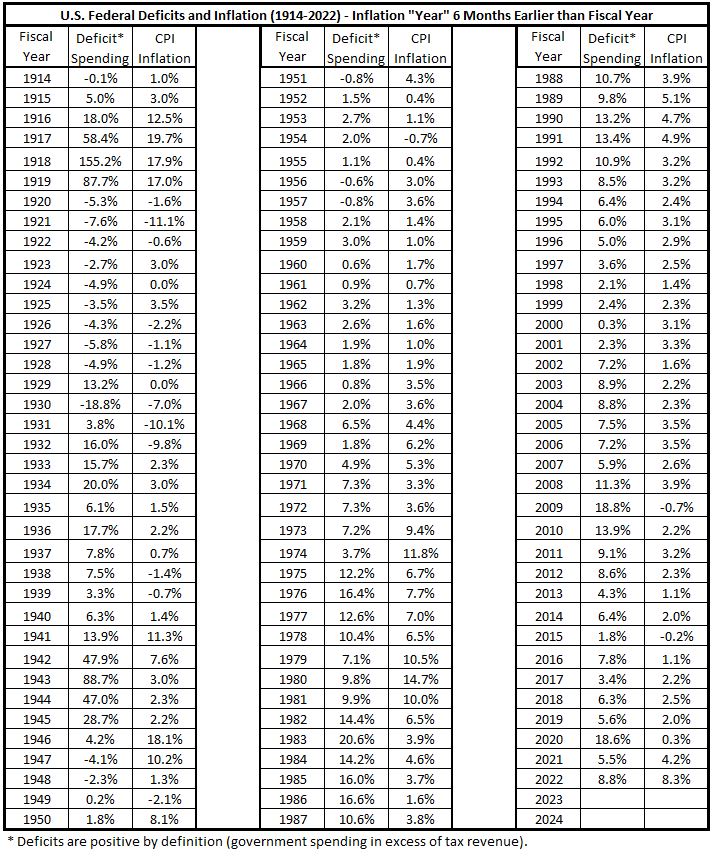
Figure 4. Deficits (x) vs Inflation (y) Aligned 6 Months Earlier than Fiscal Years (1914 – 2022)
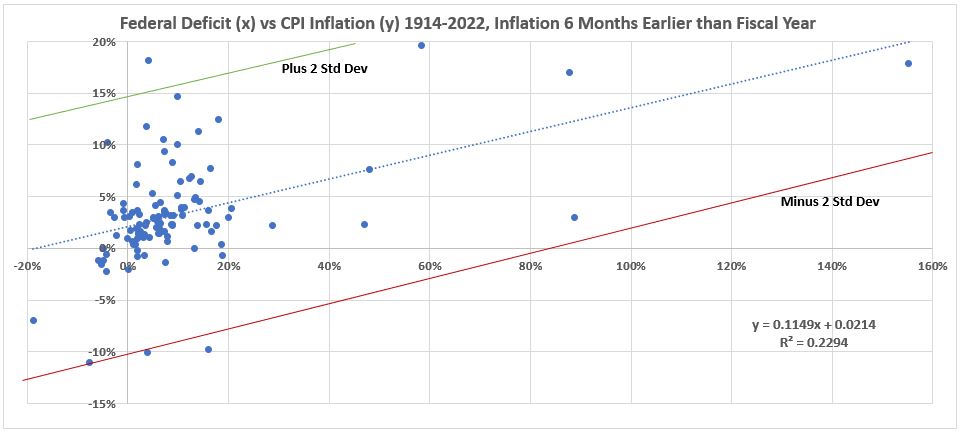
There are no data outliers identified here. There are only three data points lying outside of ± 2σ lines. With 109 data points, there are expected to be 5.45 points beyond of ± 2σ for a normal distribution.
Table 6. Deficits and Inflation Aligned 9 Months Earlier than Fiscal Years (1914 – 2022)
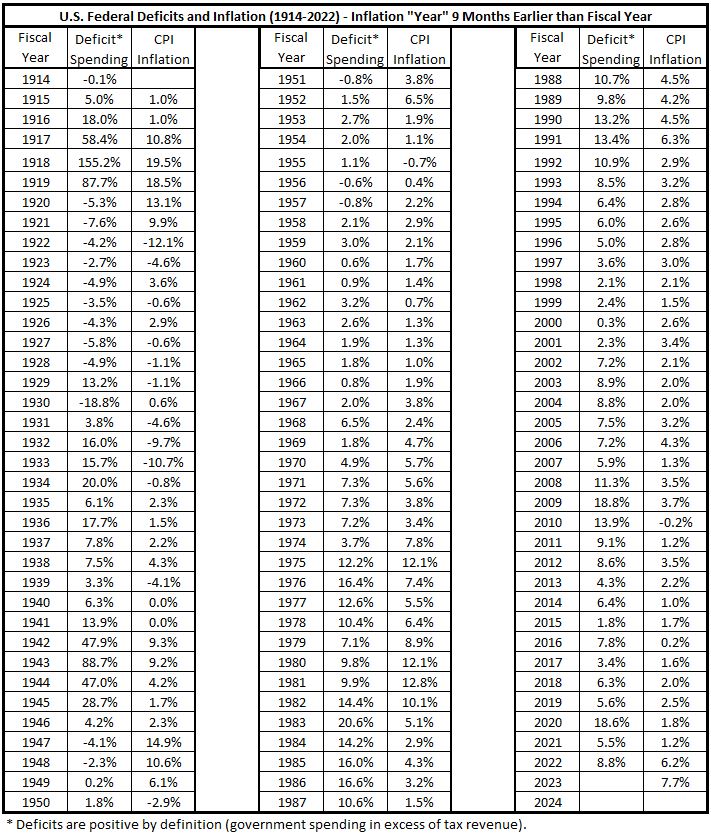
Figure 5. Deficits (x) vs Inflation (y) Aligned 9 Months Earlier than Fiscal Years (1914 – 2022)
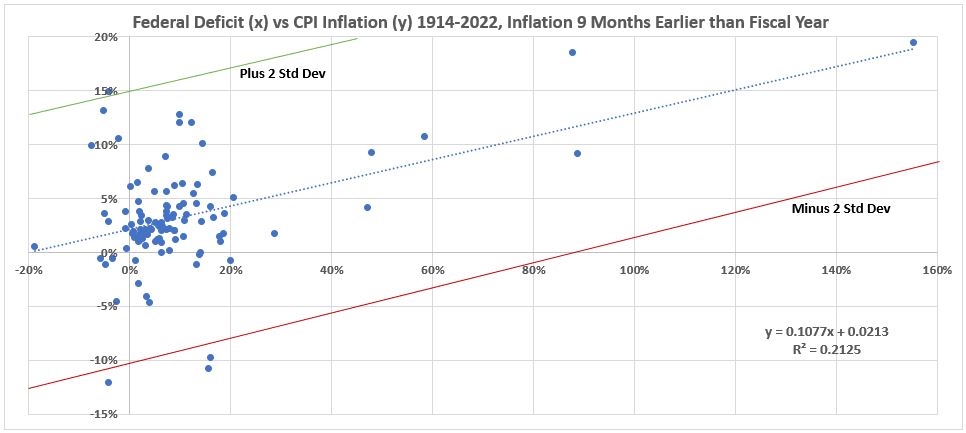
Since there are only 4 data points outside the ± 2σ lines, and 5.4 data points out there would be expected for a normal distribution with 108 data points, there are no outliers identified for this data set.
Table 7. Deficits and Inflation Aligned 12 Months Earlier than Fiscal Years (1914 – 2022)
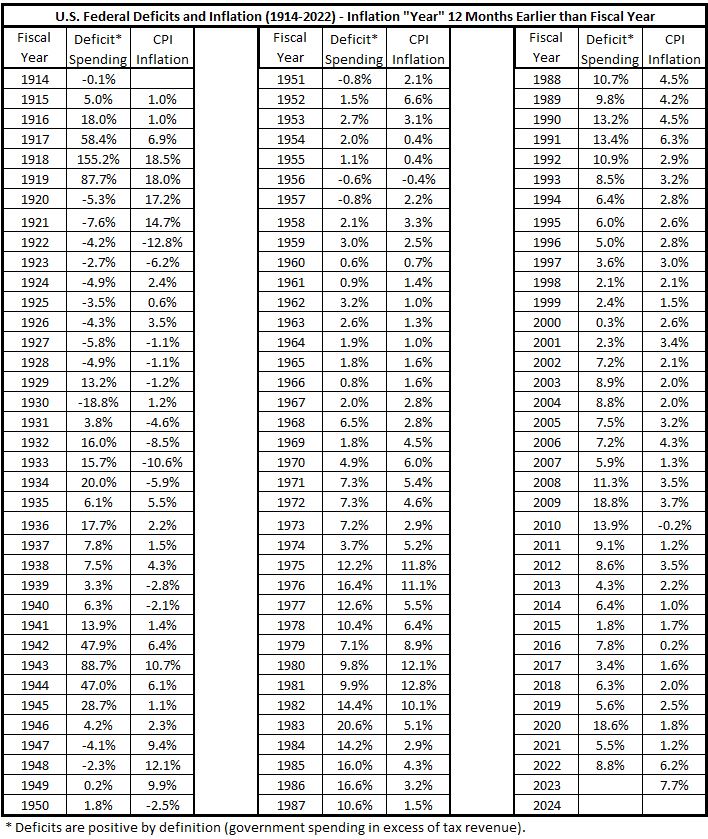
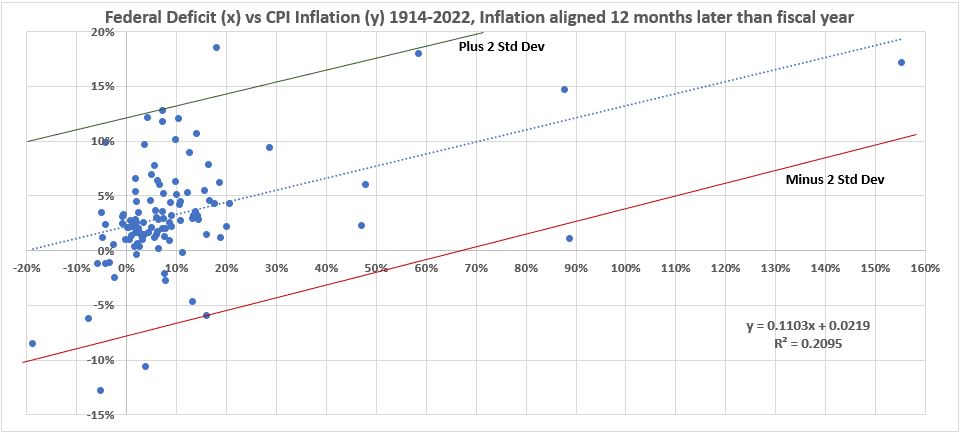
Figure 6. Deficits (x) vs Inflation (y) Aligned 12 Months Earlier than Fiscal Year
(1914 – 2022)
Since there are only 4 data points outside the ± 2σ lines, and 5.4 data points out there would be expected for a normal distribution with 108 data points, there are no outliers identified for this data set.
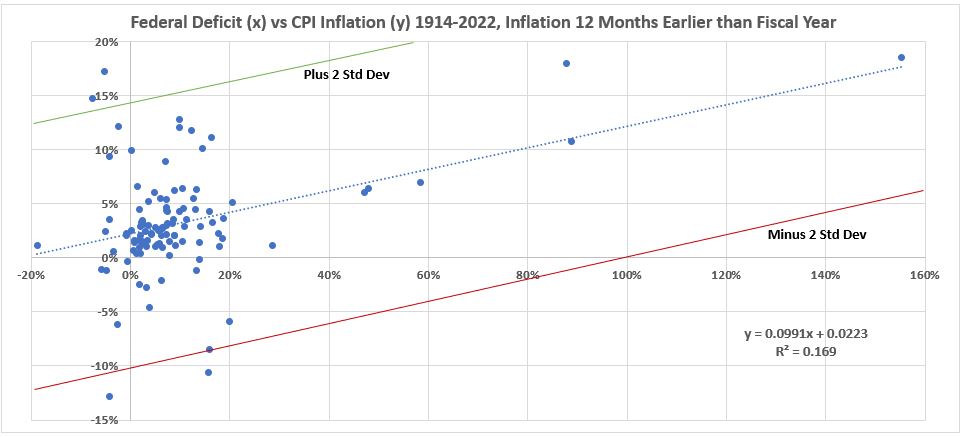
Table 8. Deficits and Inflation Aligned 18 Months Earlier than Fiscal Years (1914 – 2022)
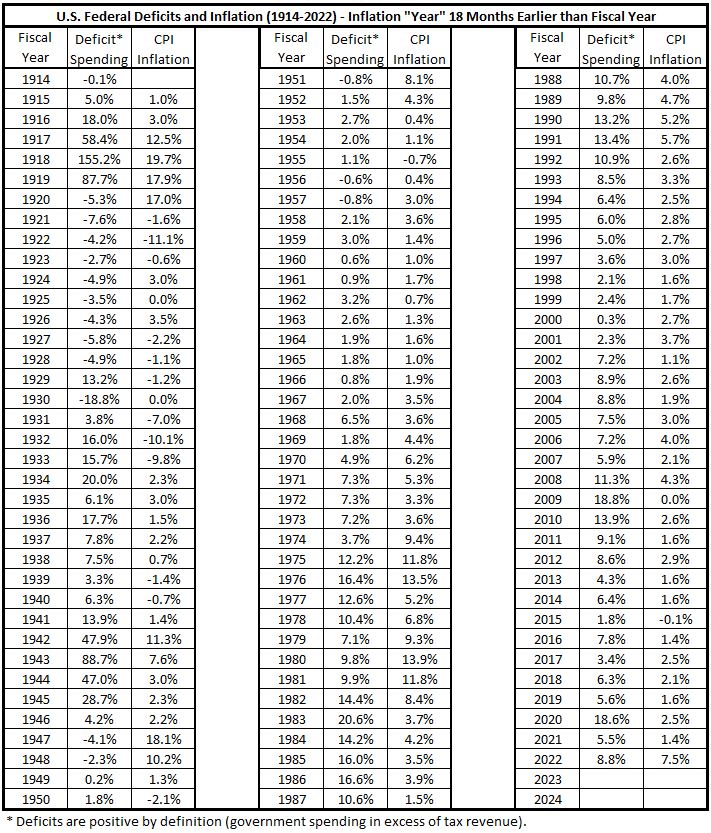
Figure 7. Deficits (x) vs Inflation (y) Aligned 18 Months Earlier than Fiscal Year
(1914 – 2022)
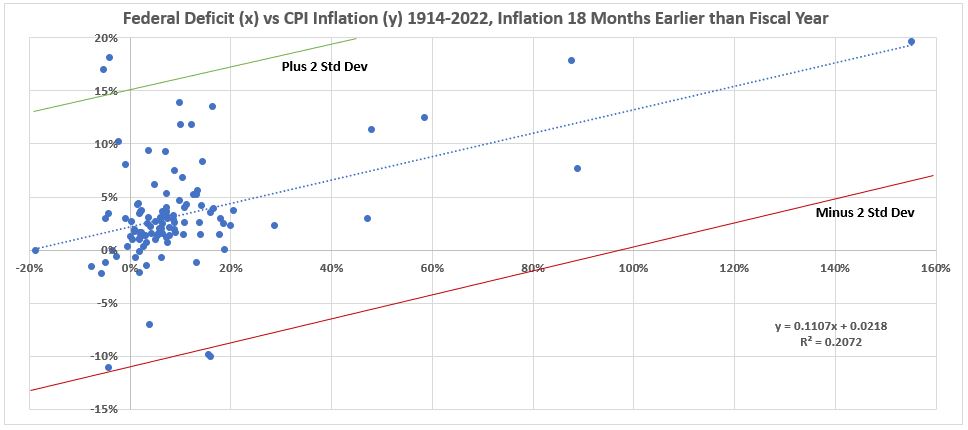
Since there are only 4 data points outside the ± 2σ lines, and 5.4 data points out there would be expected for a normal distribution with 108 data points, there are no outliers identified for this data set.
Inflation Later than Fiscal Years
Table 9. Deficits and Inflation Aligned 3 Months Later than Fiscal Years
(1914 – 2022)
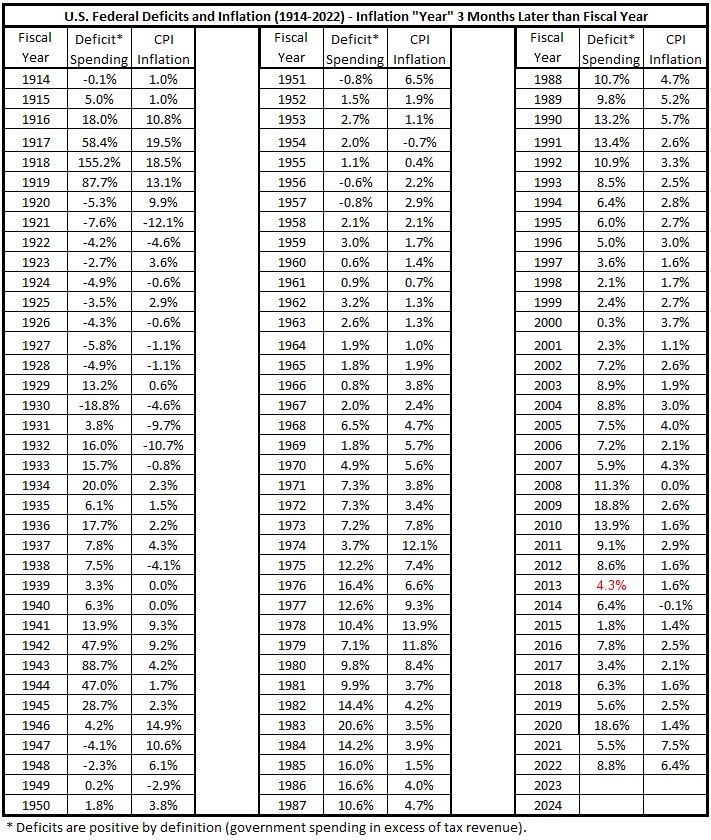
Figure 8. Deficits (x) vs Inflation (y) Aligned 3 Months Later than Fiscal Years
(1914 – 2022)
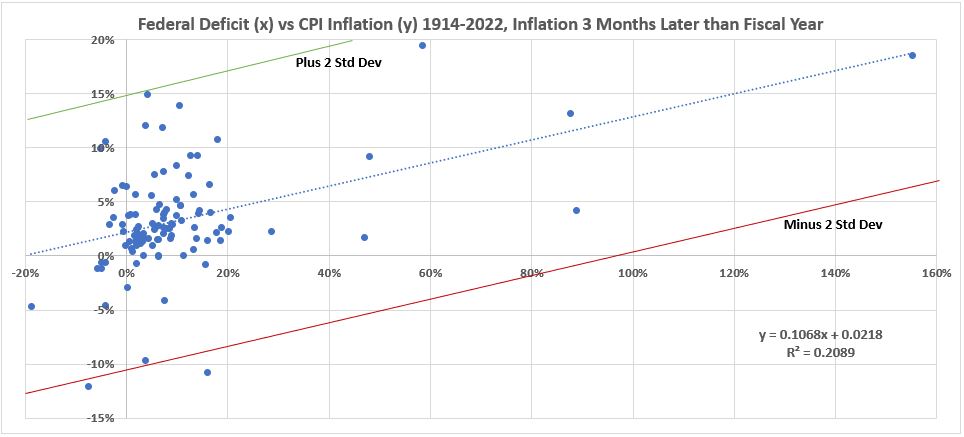
There are no data outliers identified here. There are only two data points lying outside of ± 2σ lines. With 109 data points, there are expected to be 5.45 points beyond of ± 2σ for a normal distribution.
Table 10. Deficits and Inflation Aligned 6 Months Later than Fiscal Years
(1914 – 2022)
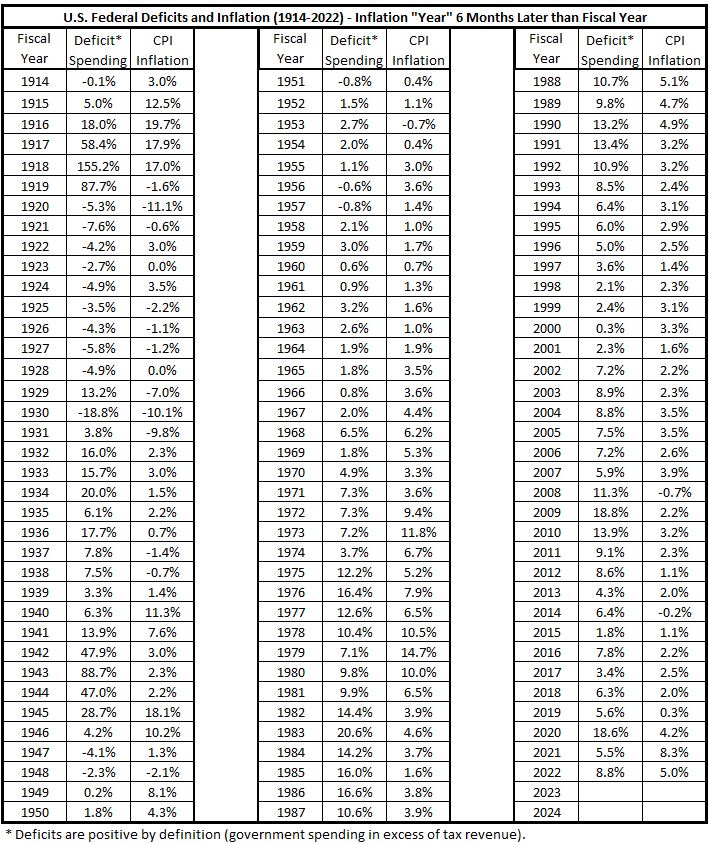
Figure 9. Deficits (x) vs Inflation (y) Aligned 6 Months Later than Fiscal Years
(1914 – 2022)
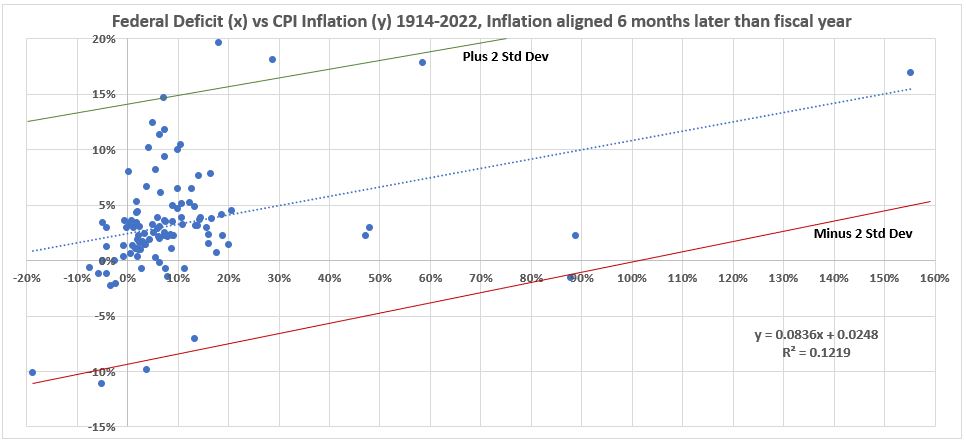
Since there are only 5 data points outside the ± 2σ lines, and 5.45 data points out there would be expected for a normal distribution with 109 data points, there are no outliers identified for this data set.
Table 11. Deficits and Inflation Aligned 9 Months Later than Fiscal Years
(1914 – 2022)
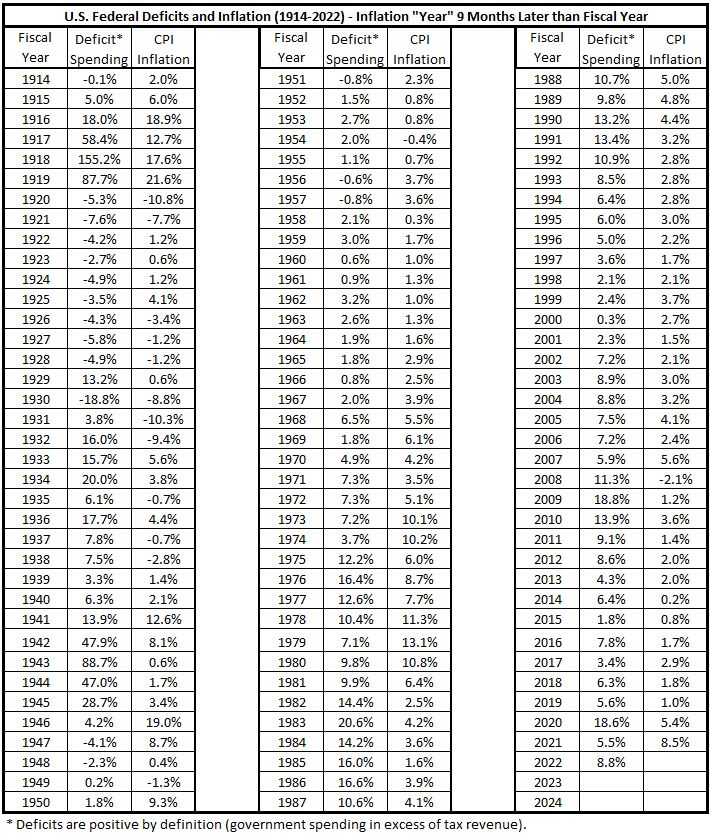
Figure 10. Deficits (x) vs Inflation (y) Aligned 9 Months Later than Fiscal Years
(1914 – 2022)
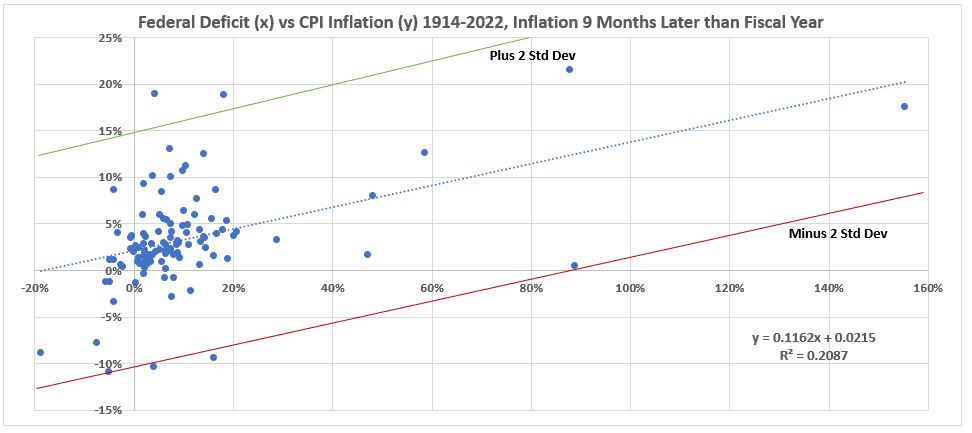
There are no data outliers identified here. There are only four data points lying outside of ± 2σ lines. With 108 data points, there are expected to be 5.4 points beyond of ± 2σ for a normal distribution.
Table 12. Deficits and Inflation Aligned 12 Months Later than Fiscal Years
(1914 – 2022)
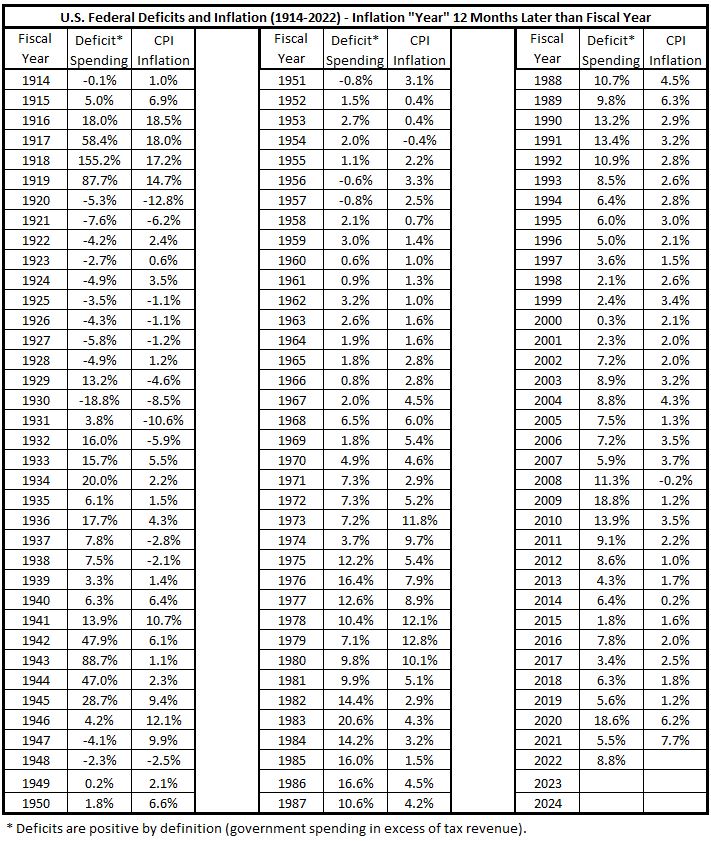
Figure 11. Deficits (x) vs Inflation (y) Aligned 12 Months Later than Fiscal Year
(1914 – 2022)
There are no data outliers identified here. There are only three data points lying outside of ± 2σ lines. With 109 data points, there are expected to be 5.4 points beyond of ± 2σ for a normal distribution.
Table 13. Deficits and Inflation Aligned 18 Months Later than Fiscal Years
(1914 – 2022)
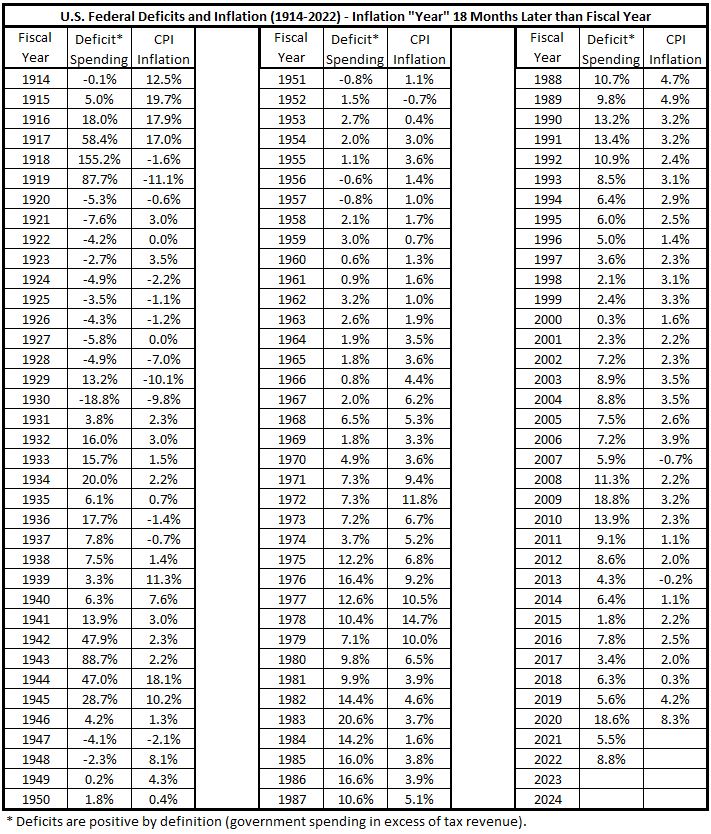
Figure 12. Deficits (x) vs Inflation (y) Aligned 18 Months Later than Fiscal Year
(1914 – 2022)
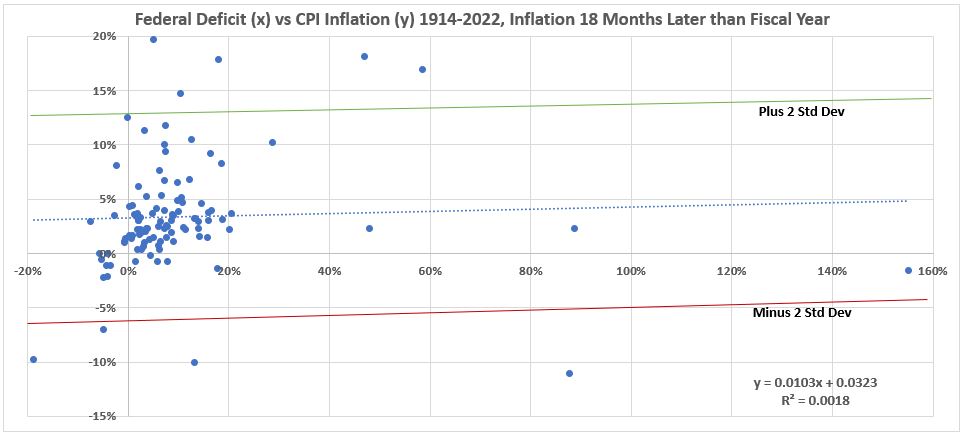
This data does not fit well to a normal distribution. There are eight data points outside the ± 2σ lines. With 107 data points, there are expected to be 5.35 points beyond of ± 2σ for a normal distribution. The other feature of this data that is not what is seen for normal distributions is the samller lateral range of data points compared to the other scatter plots seen in this post. Because the correlation for this data set is so near to zero (4%), it is not considered worthwhile to obtain the correlation with two or three outliers removed.
Analysis
In this post we are examining what can be learned from the aggregate data time series for the 109 years studied. First we consider the entire data set. Then we look at the extracted data sets for significant periods of inflation and disinflation/deflation.
Correlation of U.S. Federal Government Deficit Spending with CPI Inflation (1914-2022)
We have shown in the data section above eleven timeline offsets for CPI inflation for the fiscal years 1914-2022. The correlation data is smmarized in Table 14 and shown graphically in Figure 13.
Table 14. Average Correlations for Deficit Spending and CPI Inflation 1914-2022.
Eleven Timeline Alignments.
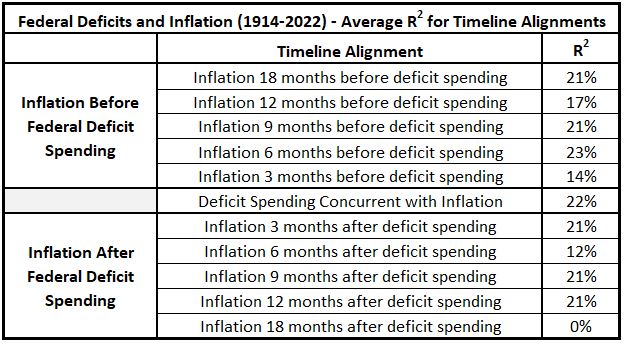
Figure 13. Variation of Correlation Between Deficit Spending and CPI Inflation 1914-2022.
Various Timeline Leads and Lags.
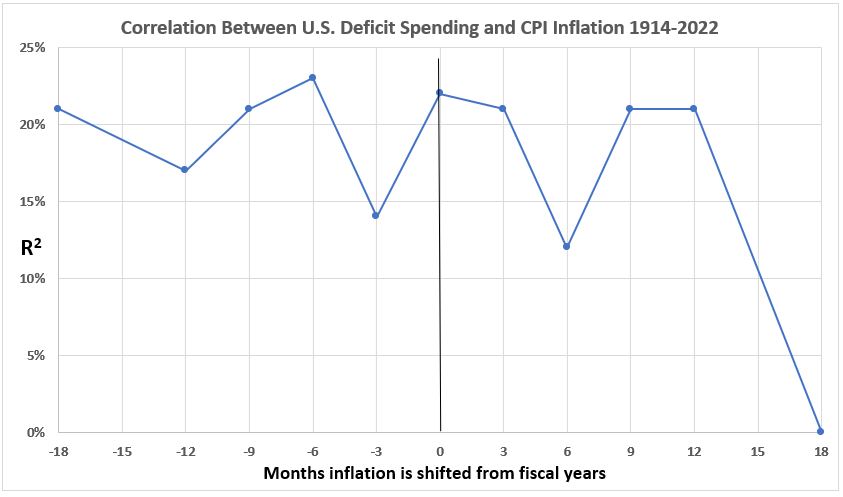
There is little to say about this aggregated data except that there appears to be significant correlation over the data set between deficit spending and inflation for inflation leading deficit spending, coincident with deficit spending and following deficit spending. The symmetry around zero (spending and inflation coincident) seen previously using approximate data4 is not seen here with the more exact data. The downward trend for the result may or may niot have significance. We reserve further comment on that until analysis of disaggregated data has been done.
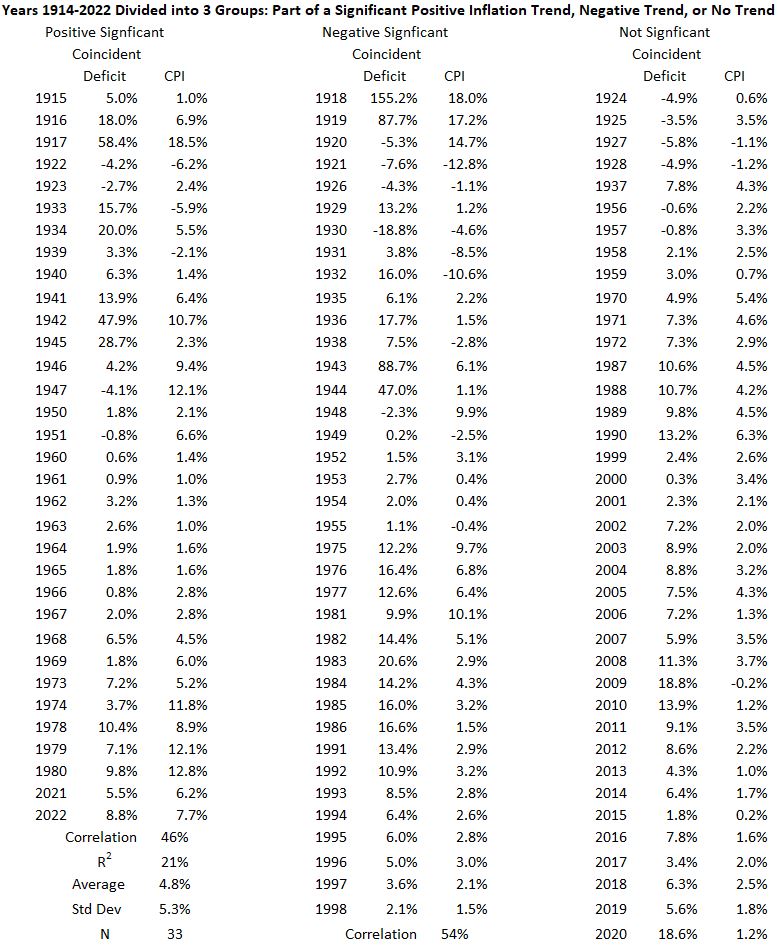
Significant Periods of Inflation and Disinflation
In Figure 2 above, 21 periods of significant inflation and disinflation/deflation were identified. We remind you that significant was defined as a 4% change in inflation without and intervening pullback greater than 1.5%.
The data from Figure 2 is presented in Tables 15 and 16.
Table 15. Periods of Significant Increases of Inflation 1914-2022
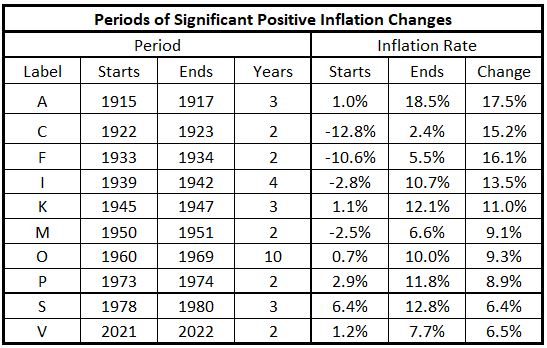
Table 16. Periods of Significant Decreases of Inflation 1914-2022
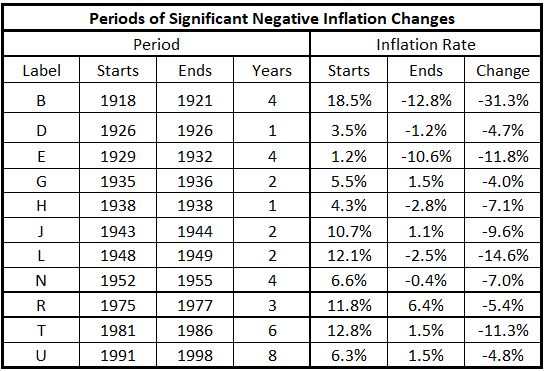
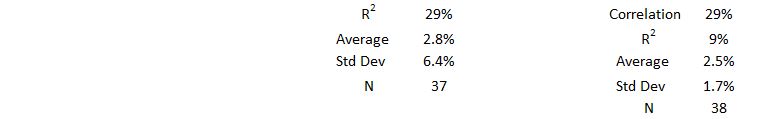
From Tables 15 and 16, we see that there have 10 periods (encompassing 33 years) of significant inflation from 1914 to 2022 and 11 periods (37 years) of significant disinflation.
Figure 14. Deficits (x) vs Coincident Inflation (y) For Periods with Significant Inflation Increases.
(1914 – 2022)
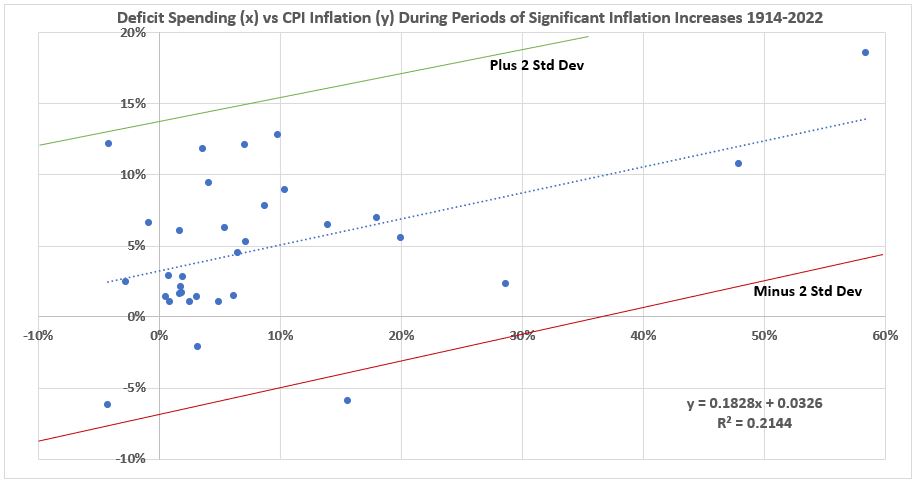
For 33 data points to average expectation for sample to exceed ± 2σ is 1.65 data points. Here there is only one data point outside ± 2σ, so there are not outliers.
Figure 15.
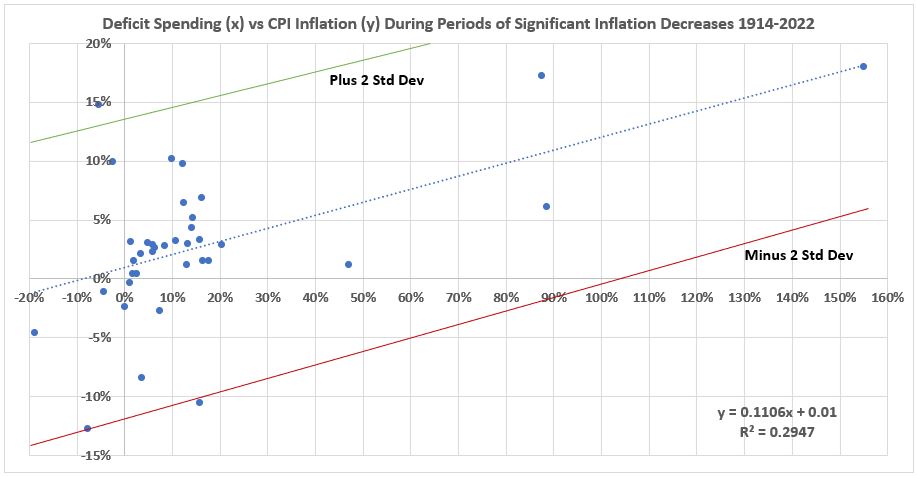
For 37 data points to average expectation for sample to exceed ± 2σ is 1.85 data points. Here there are two data points outside ± 2σ, consistent with expectations. Therefore there are no outliers in this data set.
Conclusion
Throughout this series we have been trying to identify characteristics of relationships that pervade the history of U.S. federal deficit spending and consumer inflation. We have repeatedly been thwarted. We have been unable to establish correlations that would establish that deficit spending has a consistent association pattern with inflation. Even when we have isolated data (in this post) to consider only years in which there has been significant changes in inflation, the correlations appear to be similar to those for the entire 109 years.
It is tempting to propose that there may be the following relationships based on our observations:
- Positive associations between inflation and deficit spending exist for both cases where inflation occurs before deficit spending and vice versa.
- There may be self-reinforcing feedbacks between spending possibly causing inflation and inflation causing increased spending.
- Correlations appear to have significant variations over time.5
- The associations between deficit spending and inflation may be stronger when the two variables are decreasing.
But we are not tempted to finalize these relationships without further study. What remains is to examine individually each of the 21 periods with significant inflation changes. If there are any common factors between different periods of inflation, we may be able to sort these time periods into categories with common characteristics.
In the current week we will work on the study of individual inflation periods.
Appendix
Included in this appendix are tables of the inflation data used and the calculation “accounting” details used in this post. Please note: The keeping track of the “accounting” details may seem tedious, but without this effort errors can easily occur. And with the process detailed thusly, when errors occur they can be more quickly identified and corrected.
The data used to calculate inflation in this post is given in Table A1. This data is from the Fed data base CPIAUCNS.3 (This data was posted previously.2)
Table A1. Consumer Price Index (CPI) Values, Monthly 1913-2022


Note: The data in Table A1 is for the first day of each month.
The index values are used to calculate the 12-month inflation using the formula
Inflation Rate (Month, Year) = {(Index (Month, Year) – Index (Month, Year-1)}/Index (Month, Year-1)
This formula is used to calculate the year-over-year inflation rate for any month in any year. These are shown in Table A2. (This table was posted previously.2)
Table A2. Year-over-Year Inflation (CPI), Monthly 1914-2022


Note: Since the values of the index in Table A1 is as of the first of each month, the percentage changes in Table A2 for a given month are year-over-year for the 12 months preceding the month listed. For example, the CPI rate of 1.0% for March 2014 covers the period from March 1, 2013 through February 28, 2014.
The data used to calculate deficit spending in this post is given in Table A3. This data is from the Fed data base Historical Debt Outstanding.6 (This data was posted previously.2)
Table A3. U.S. National Debt and Federal Budget Balances (1913-2022)
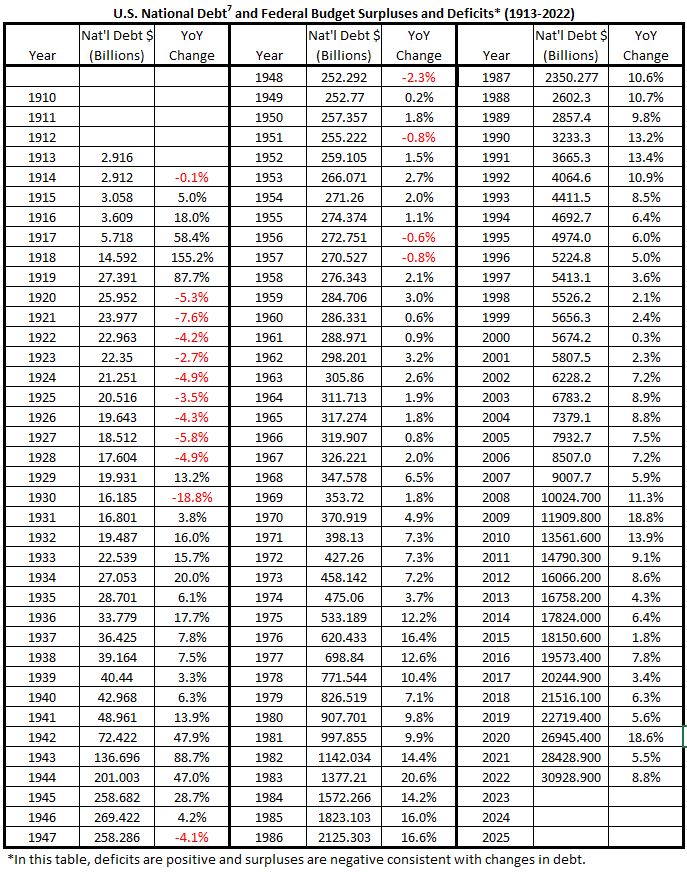
Table A4. Alignments for Various Leads and Lags for Inflation vs Fiscal Years
1914-2022
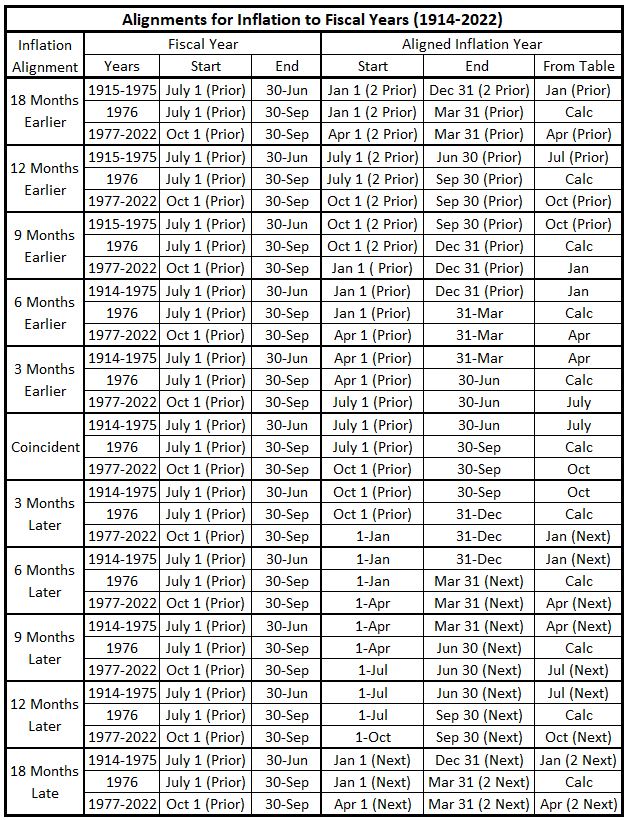
Table A5. Examples of Alignments for Various Leads and Lags
for Inflation vs Fiscal Years 1914-2022
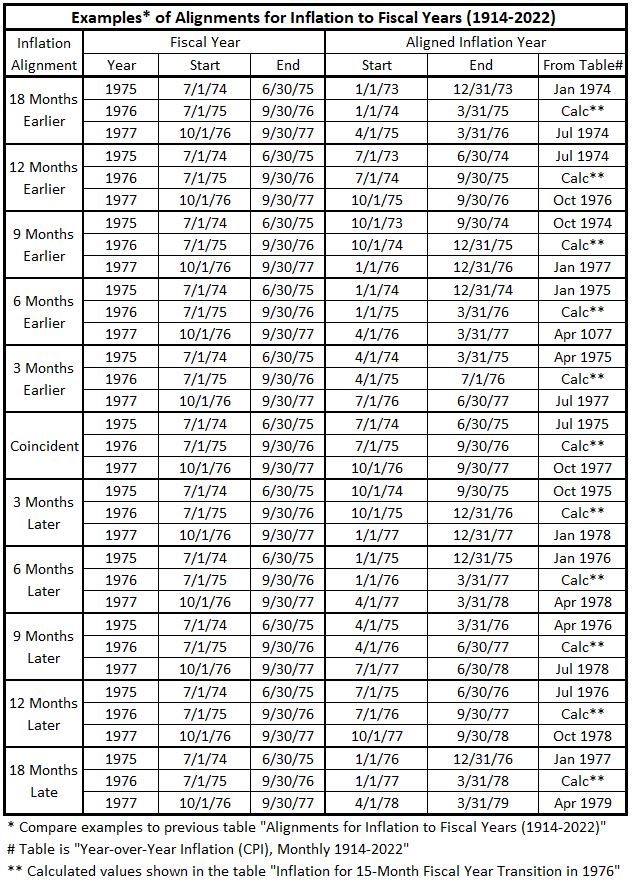
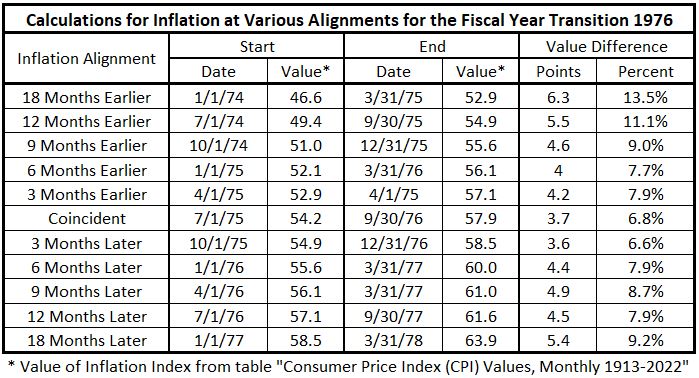
Table A6. Calculation of Inflation vs. Fiscal Year for the Transition Year 1976
The statistical analysis of the data reported in this post is presented in the following tables.
Table A7.
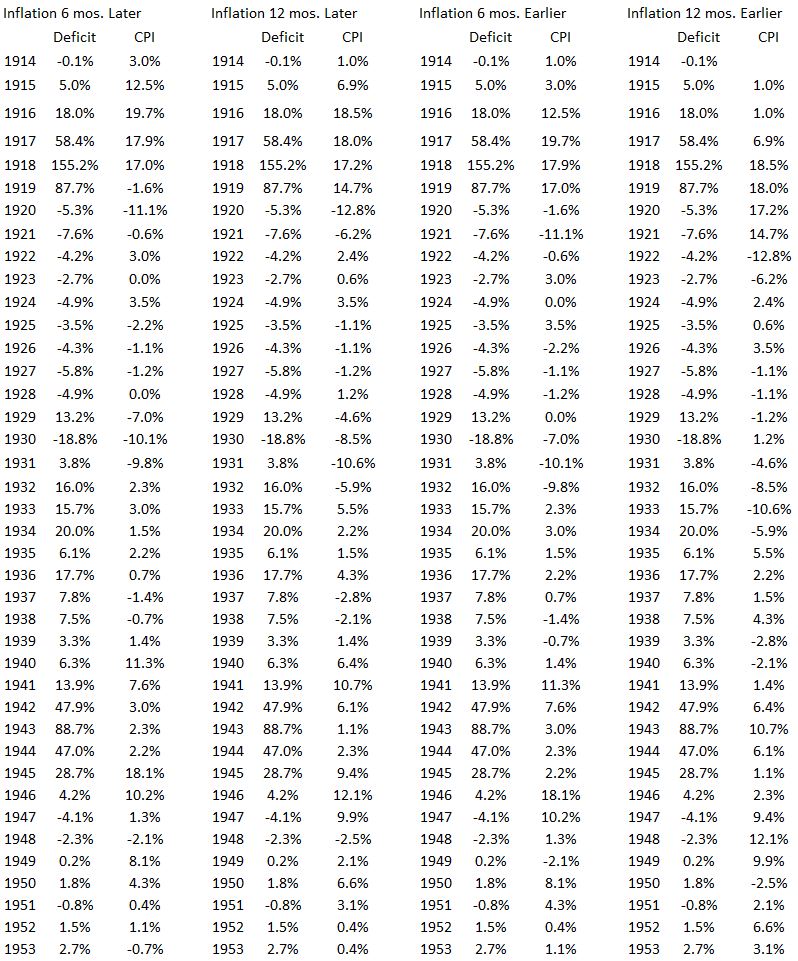
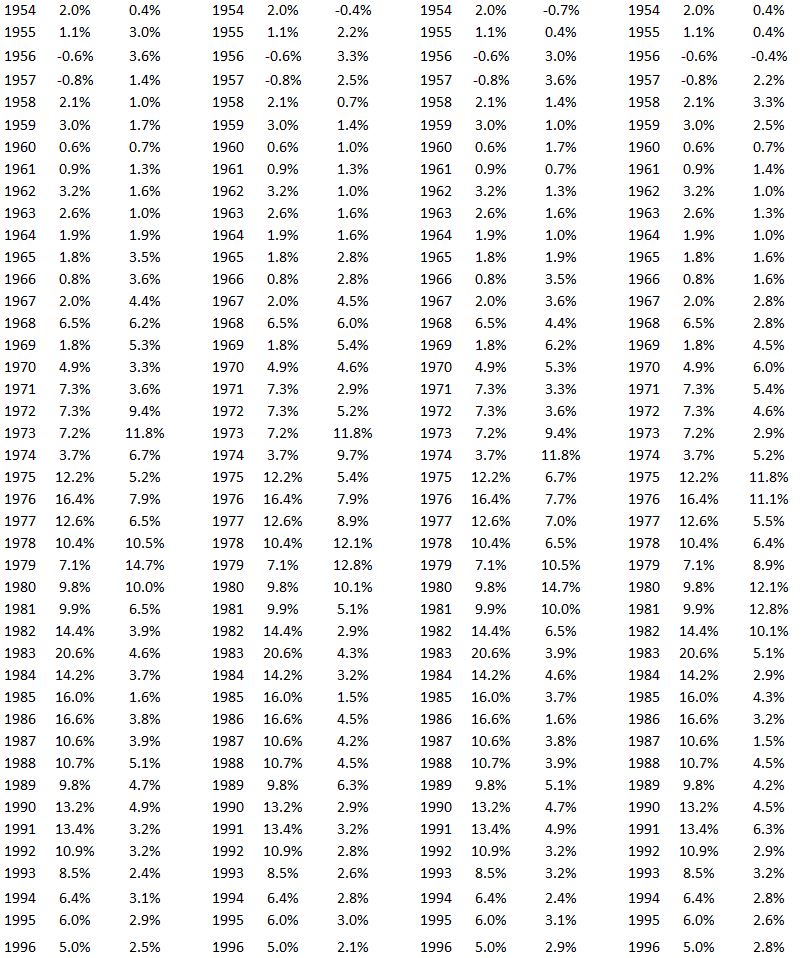
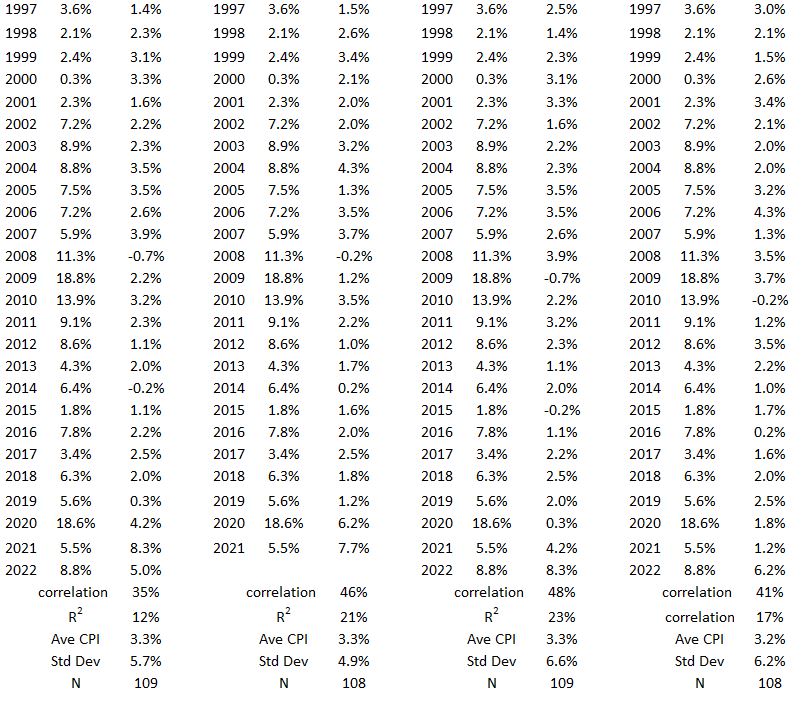
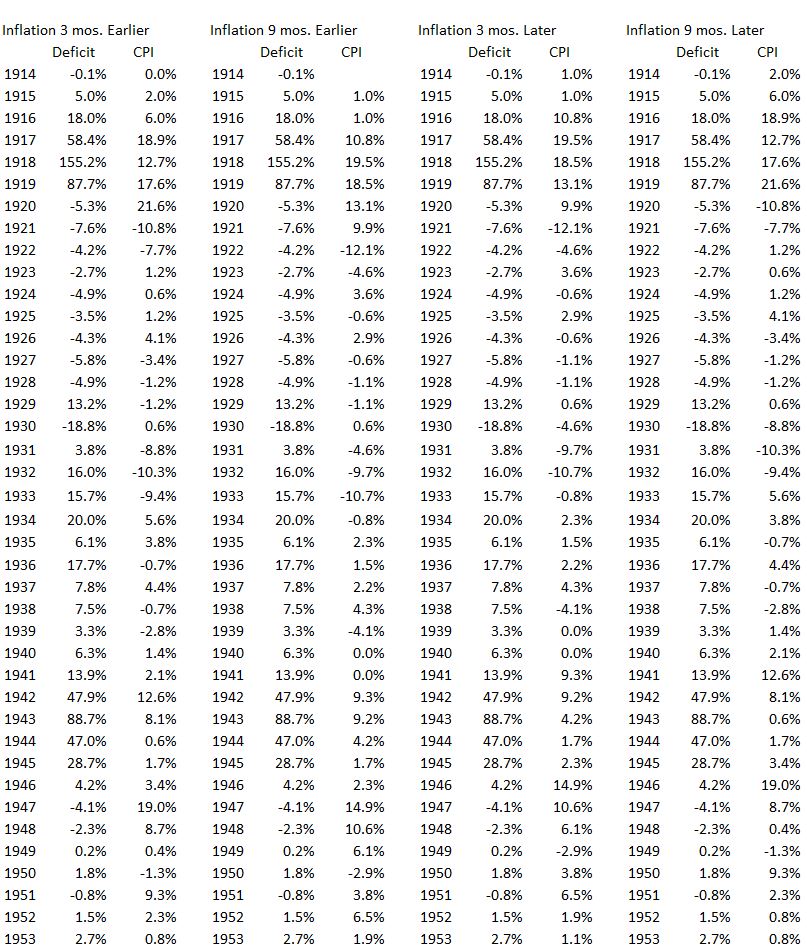
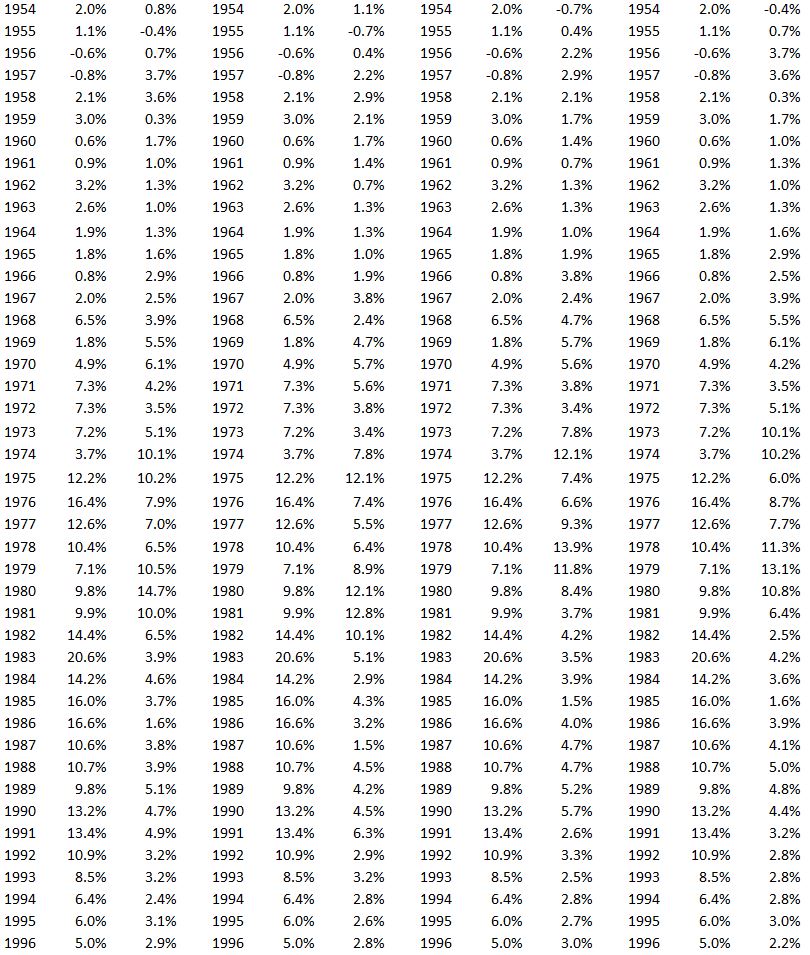
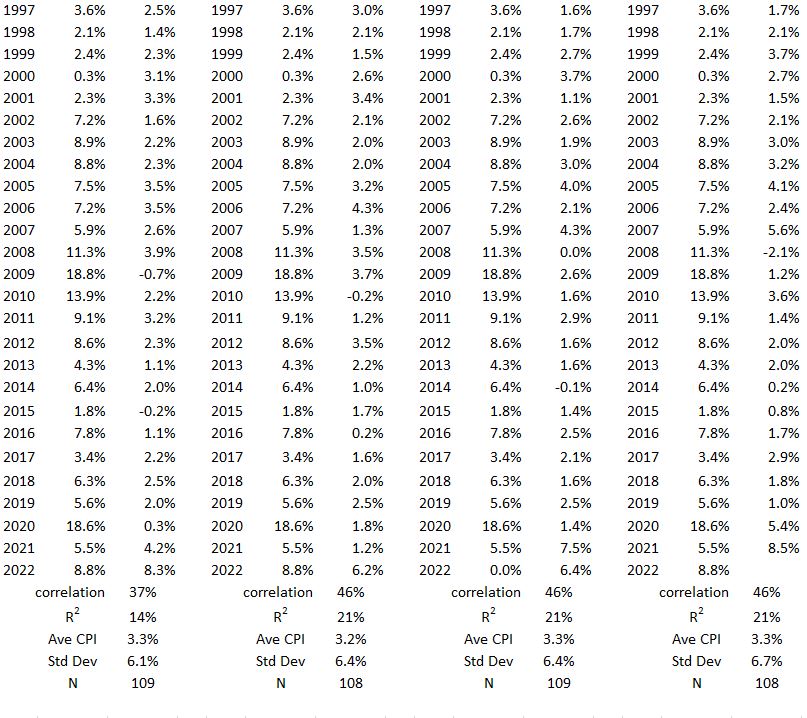
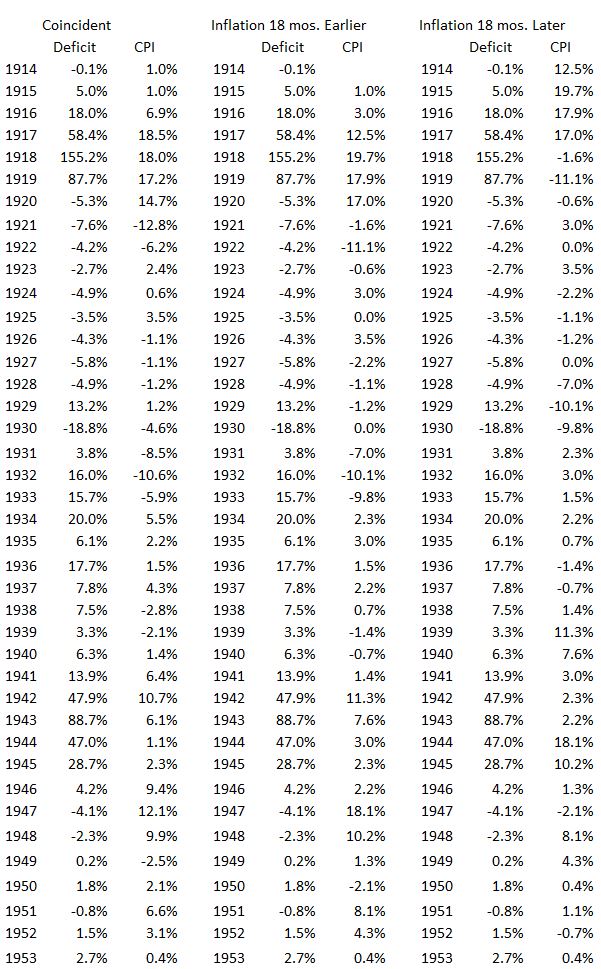
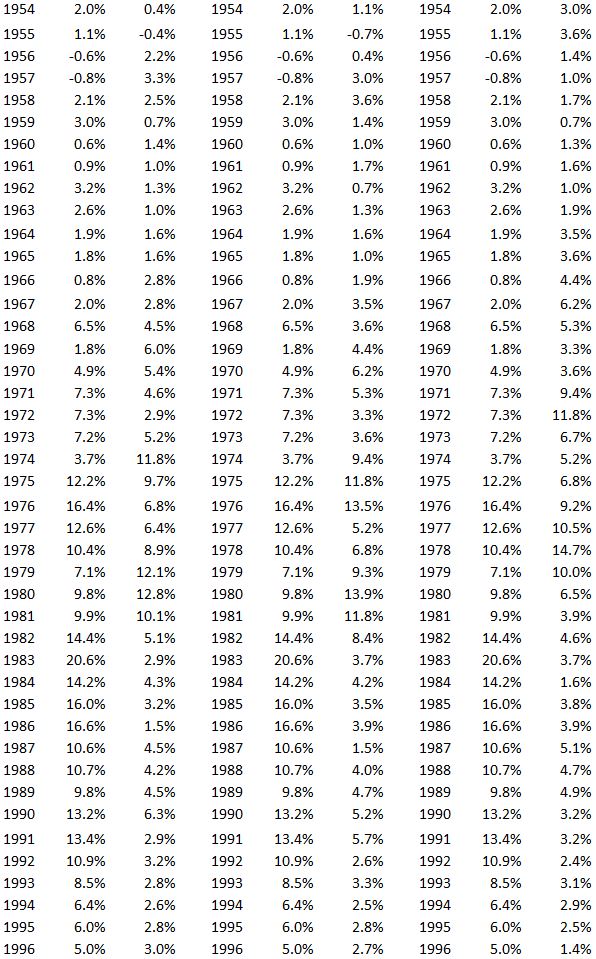
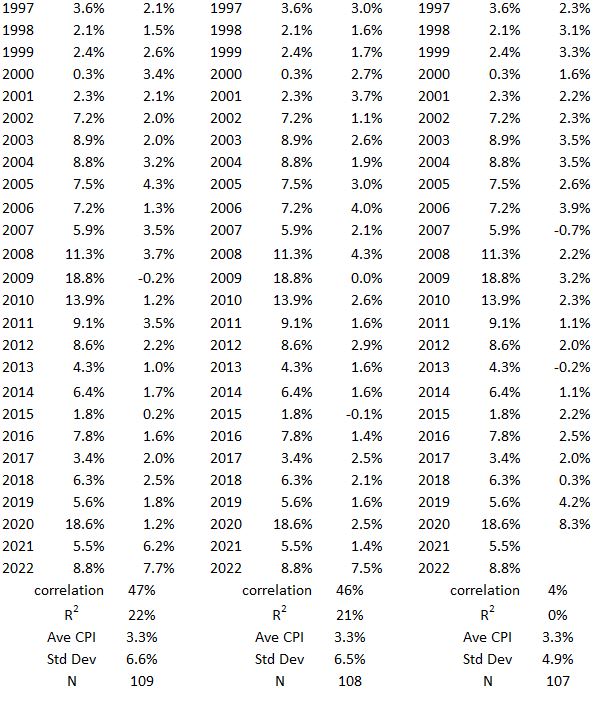
Table A8. Statistics for Deficit vs. Inflation 1914-2022 Divided into 3 Groups:
Years in Positive Inflation trends, Negative Trends, and Not in Significant Trends.
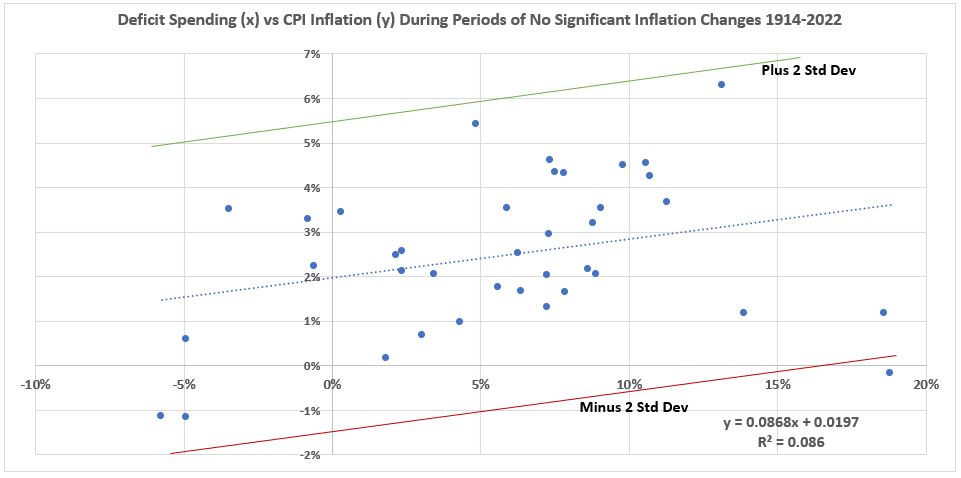
The graph below was not needed for the analysis and discussion in this post. It shows the scatter plot for the years not in a significant inflation (or disinflation) trend.
Figure A1. Deficits (x) vs Coincident Inflation (y) For Periods with Significant Inflation Increases.
(1914 – 2022)
Footnotes
1. Lounsbury, John, “Government Spending and Inflation. Part 10”, EconCurrents, April 23, 2023. https://econcurrents.com/2023/04/23/government-spending-and-inflation-part-10/.
2. Lounsbury, John, “Government Spending and Inflation. Part 4”, EconCurrents, March 5, 2023. https://econcurrents.com/2023/03/05/government-spending-and-inflation-part-4/
3. Federal Reserve Economic Data, Consumer Price Index for All Urban Consumers: All Items in U.S. City Average, Index 1982-1984=100, Monthly, Not Seasonally Adjusted, https://fred.stlouisfed.org/graph/?id=CPIAUCNS,.
4. Lounsbury, John, “Government Spending and Inflation. Part 9”, EconCurrents, April 16, 2023. https://econcurrents.com/2023/04/16/government-spending-and-inflation-part-9/.
5. Lounsbury, John, “Government Spending and Inflation. Part 6”, EconCurrents, March 26, 2023. https://econcurrents.com/2023/03/26/government-spending-and-inflation-part-6/.
6. U.S. Department of the Treasury, Historical Debt Outstanding, Last update October 4, 2022.
https://fiscaldata.treasury.gov/datasets/historical-debt-outstanding/historical-debt-outstanding
7. The Department of the Treasury, Document No. 3269, COMBINED STATEMENT OF RECEIPTS, EXPENDITURES AND BALANCES OF THE UNITED STATES GOVERNMENT FOR THE FISCAL YEAR ENDED JUNE 30, 1976 AND THE TRANSITION QUARTER ENDED SEPTEMBER 30, 1976, Stock Number 048 — 008 — 00011 — 9, Catalog Number T63. 113;975, https://www.govinfo.gov/content/pkg/GOVPUB-T63-aa06fae6dd8e856a4126668c7662a25d/pdf/GOVPUB-T63-aa06fae6dd8e856a4126668c7662a25d.pdf.
–
Pingback: Government Spending and Inflation. Part 12 - EconCurrents