Last week we thought we had wrapped up, for now, our work on timeline shift effects on the correlation between US federal government deficit spending and consumer inflation. However, more ideas have occurred, and this week we will look at further details regarding which comes first, inflation or increased government spending.

Credit: Photo by Grace O’Driscoll on Unsplash
Introduction
Previously,1 we found that the correlation between U.S. federal government spending and CPI inflation was nearly the same when spending occurred before the increased inflation (as generally expected by economic theory), concurrently with the increased inflation, and after the increased inflation. This latter observation is unexpected with traditional economic theory, which does not propose that inflation is the cause of increased spending and that inflation could come from some other source.
Of course, correlation does not imply causation, so the statements in the preceding paragraph are more correct replacing “cause” with “possibility of cause.” Once correlation establishes an association between two variables, additional information is required to confirm cause and effect. Some of the additional thoughts explored in this piece are an attempt to flesh out what that additional information might be.
A Deeper Look at How Timeline Shifts Change Correlation
Longer Timeline Shifts
Previously,1 we determined correlation for inflation concurrent with government spending and for timeline shifts of six months out to ±30 months. What happens if the shifts are extended further in time?
Correlations for Inflation 3 Years After and Before Federal Government Spending
Table 1. US Government Deficit Spending 1914-2022, CPI Inflation Three Years Later
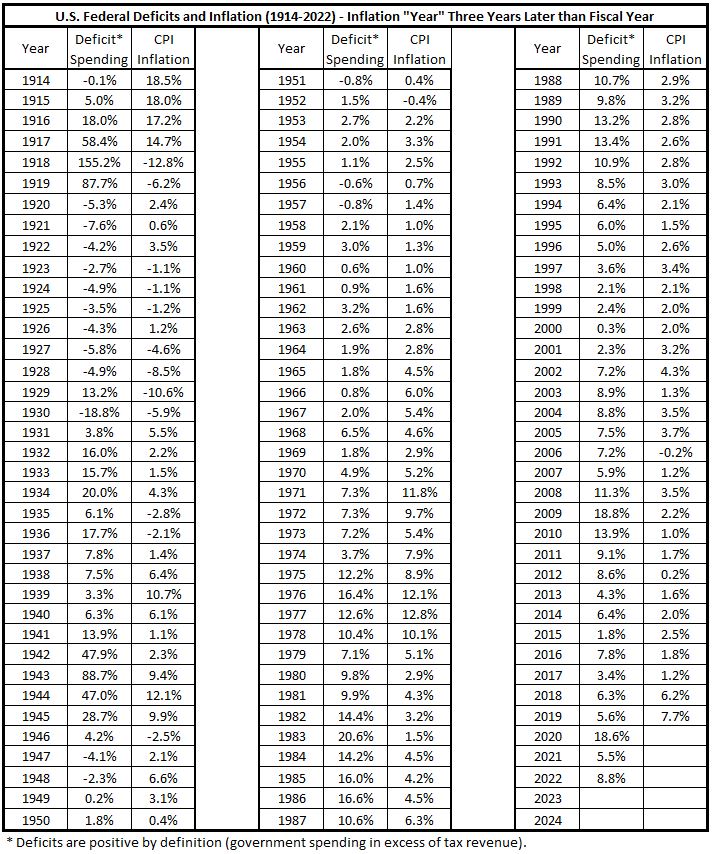
Figure 1.
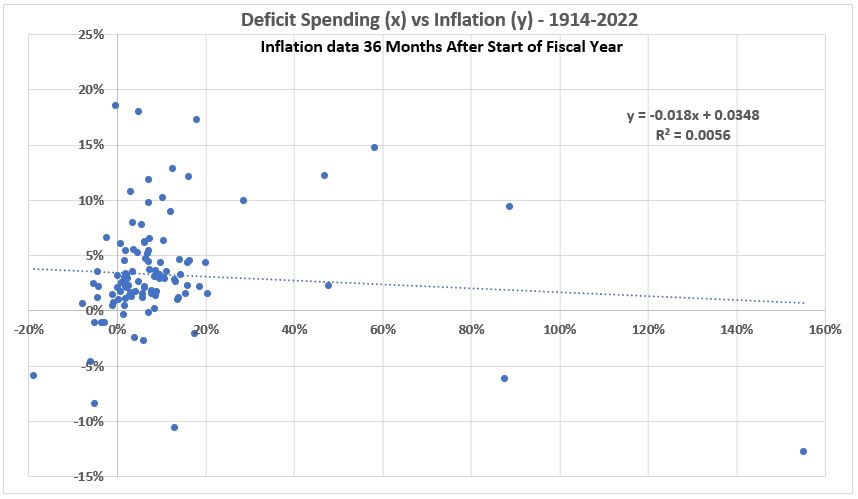
Table 2. US Government Deficit Spending 1914-2022, CPI Inflation Three Years Earlier
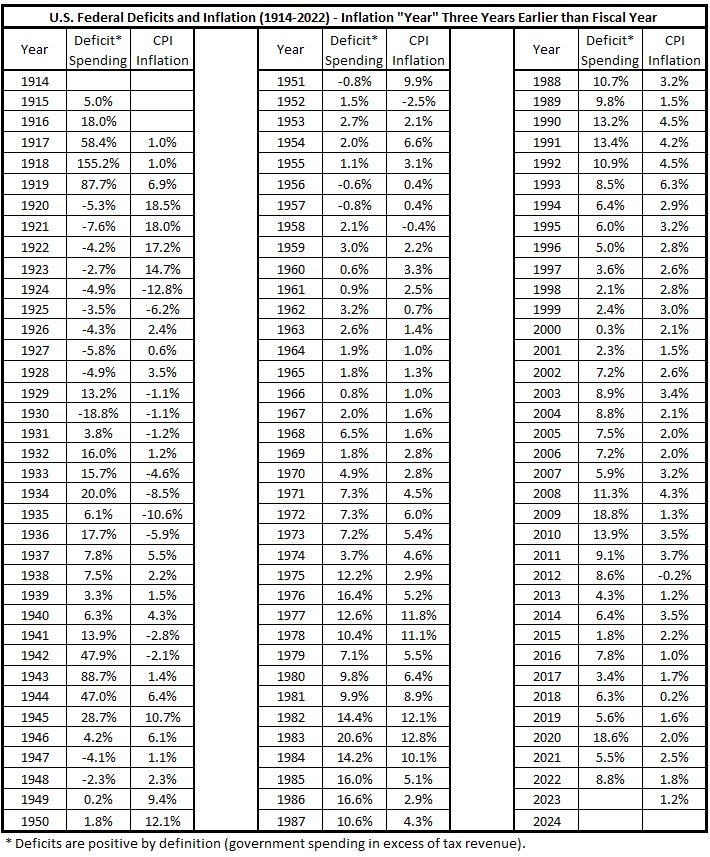
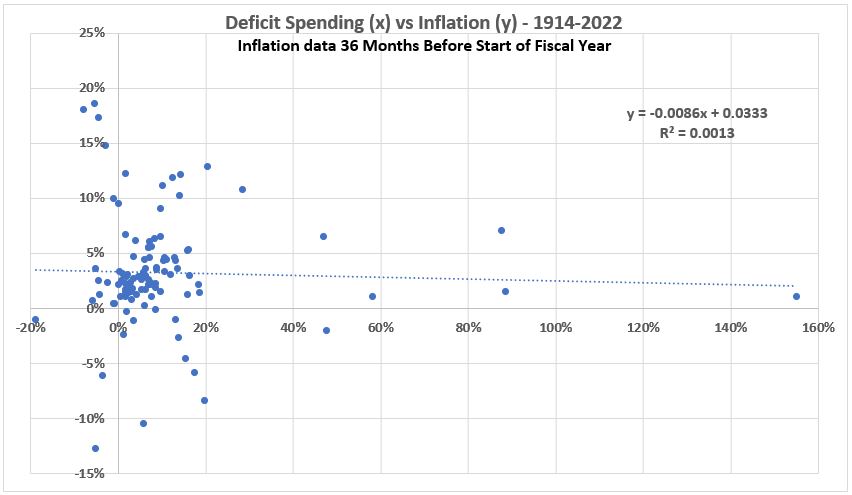
Figure 2. US Government Deficit Spending 1914-2022, CPI Inflation Three Years Earlier
Correlations for Inflation 4 Years After and Before Federal Government Spending
Table 3. US Government Deficit Spending 1914-2022, CPI Inflation Four Years Later
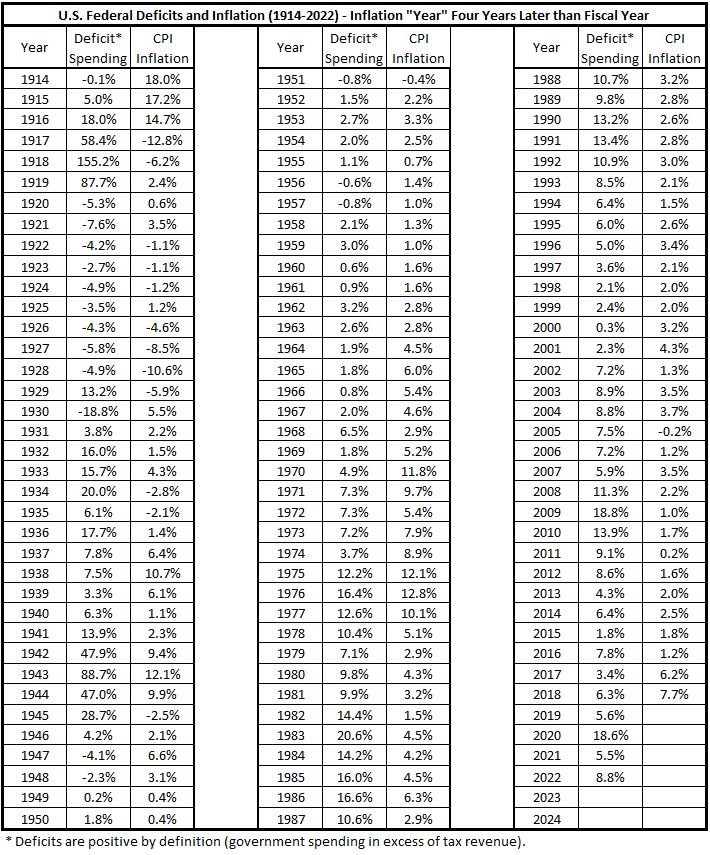
Figure 3. US Government Deficit Spending 1914-2022, CPI Inflation Four Years Later
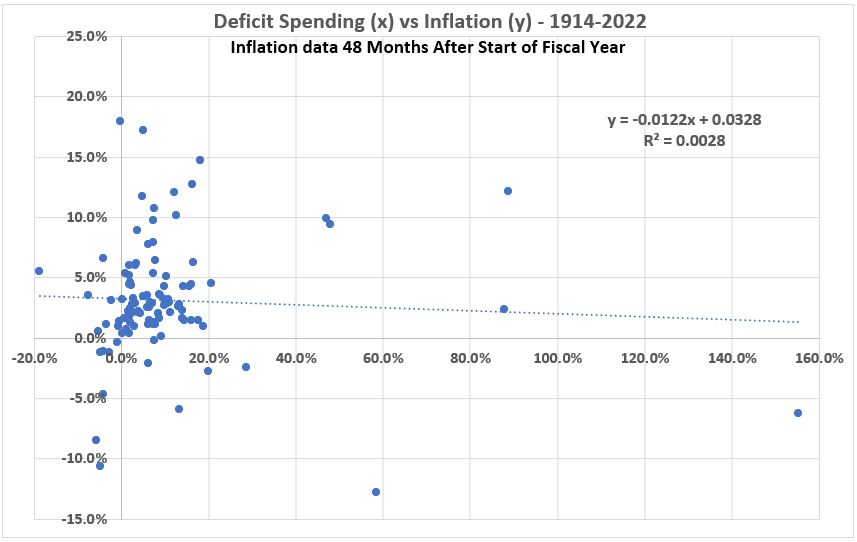
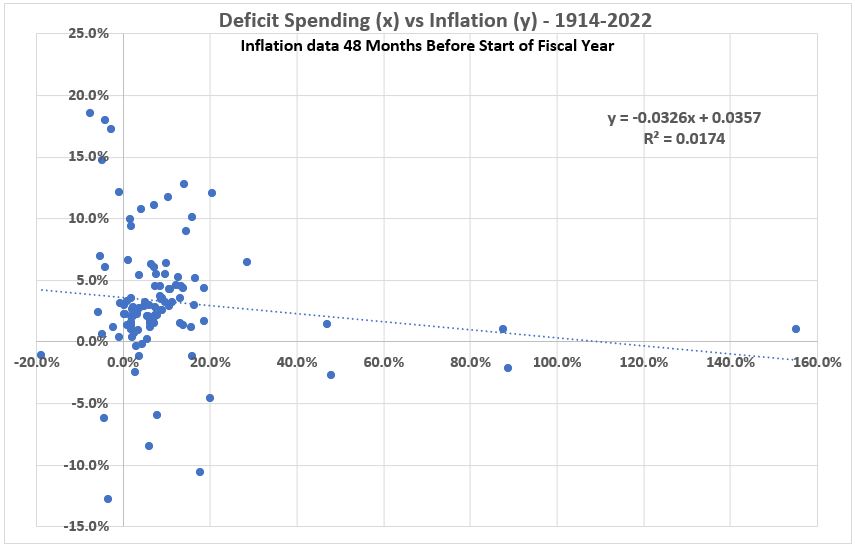
Table 4. US Government Deficit Spending 1914-2022 with CPI Inflation Four Years Earlier
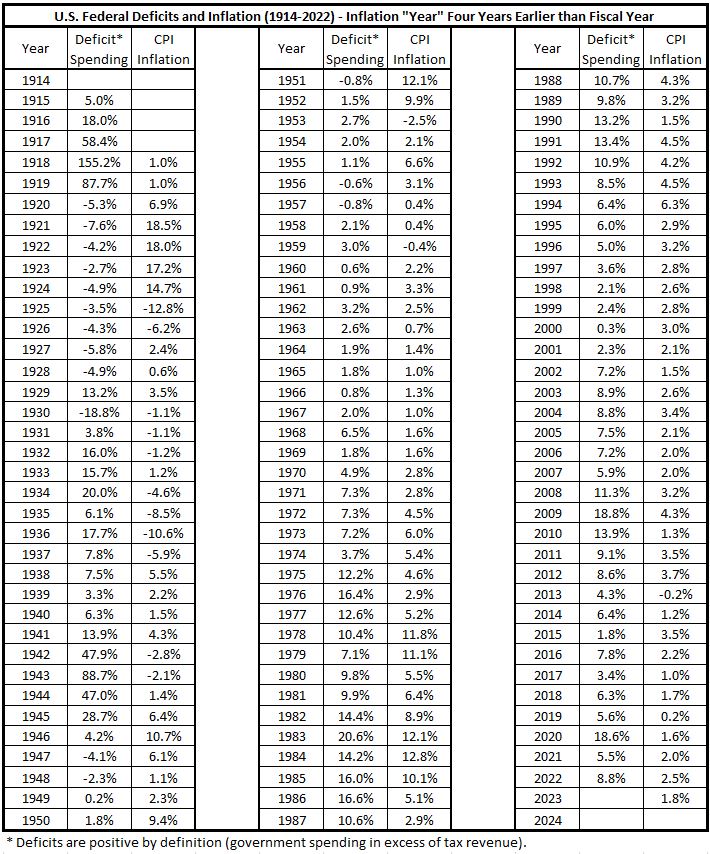
Figure 4. US Government Deficit Spending 1914-2022, CPI Inflation Four Years Earlier
Additional Correlations for Timeline Shifts Less the One Year
The graph for correlation between deficit spending and inflation shows some symmetry.1 The most noticable deviation from symmetry occurs for the more rapid decline in correlation for timeline shifts between six and twelve months when inflation precedes spending compared to the situation for for spending preceding inflation. To clarify the nature of this asymmetry, correlations for ±9 month timeline shifts would be useful.
To look at more points for correlation with new timeline shifts, new tables for alignments of deficit sending with inflation must be prepared. Since we want to calculate correlations for inflation shifts of ±9 months, this means two new tables. The process for constructing the new tables is that described previously.2
As previously,2 it is convenient to diagram the monthly data needed for each alignment from the master table for twelve-month inflation changes. (Table 2, Part 4.3) These diagrams are shown below:
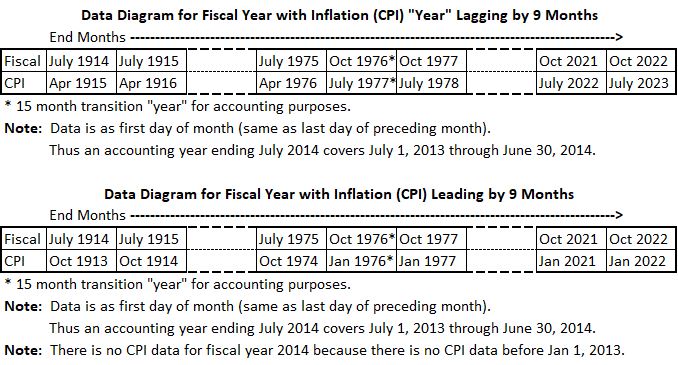
Correlations for Inflation 9 Months Before and After Federal Government Spending
Table 5. US Government Deficit Spending 1914-2022, CPI Inflation 9 Months Later
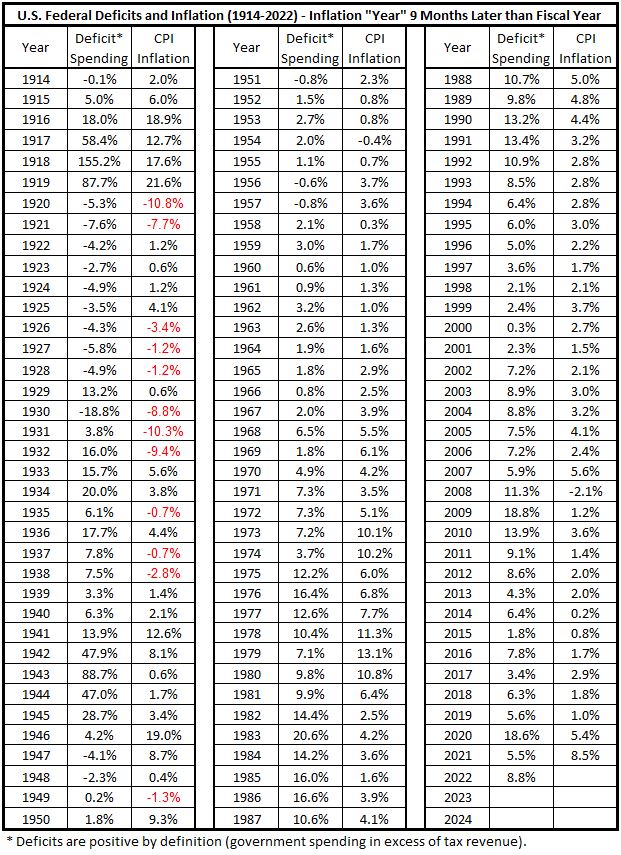
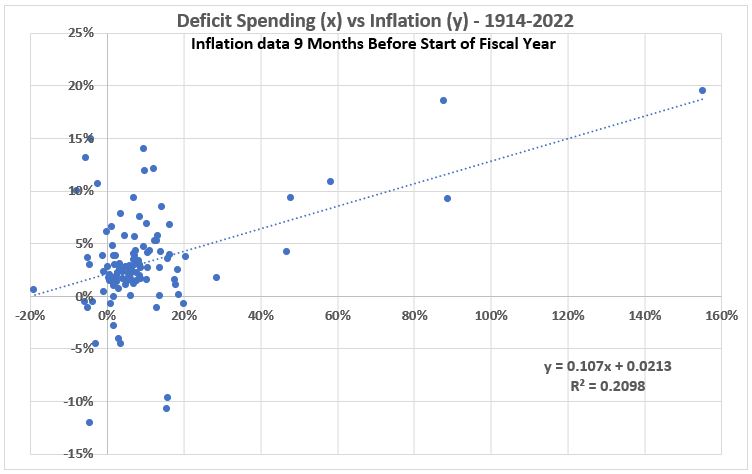
Figure 5. US Government Deficit Spending 1914-2022, CPI Inflation 9 Months Later
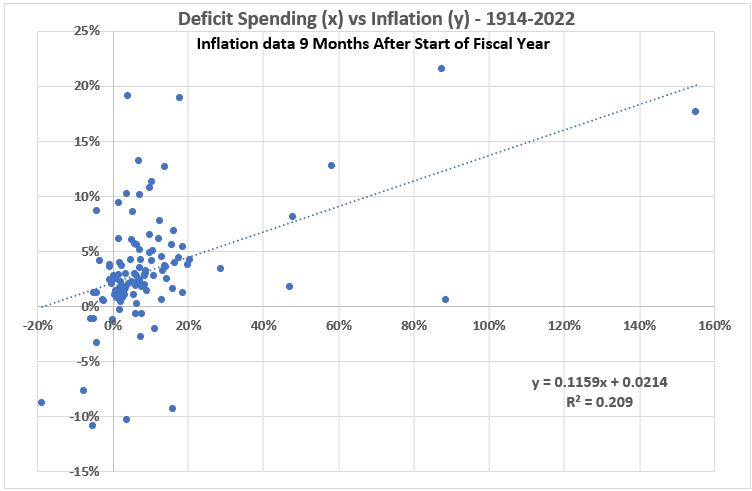
Table 6. US Government Deficit Spending 1914-2022, CPI Inflation 9 Months Earlier
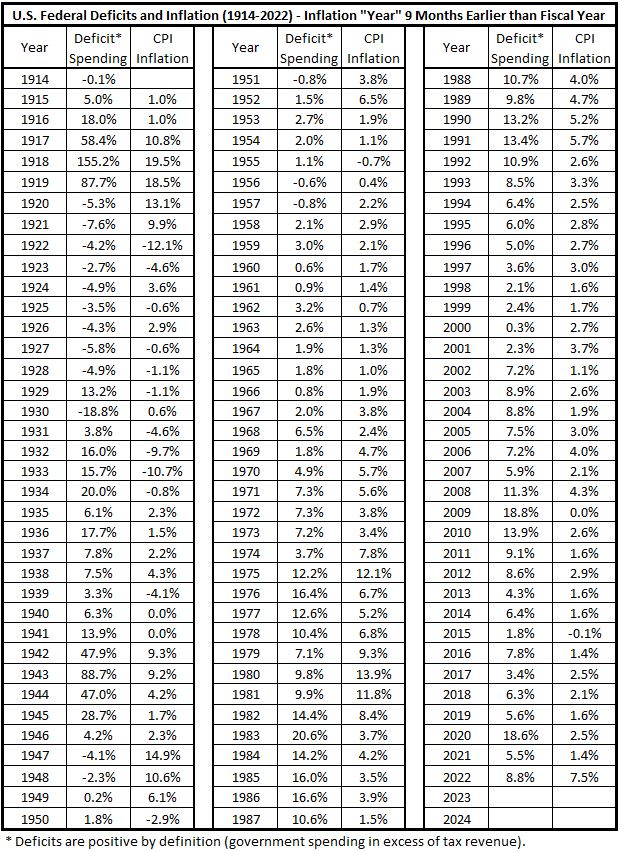
Figure 6. US Government Deficit Spending 1914-2022, CPI Inflation 9 Months Earlier
Correlation of U.S. Federal Government Deficit Spending with CPI Inflation from Four Years Before the Spending to Four Years After (1914-2022)
The data above has been combined with the data obtained previously1 to produce the following table and Figure 9.
Table 7. Average Correlations for U.S. Federal Deficit Spending and CPI Inflation
1914-2022.
Seventeen Timeline Alignments.
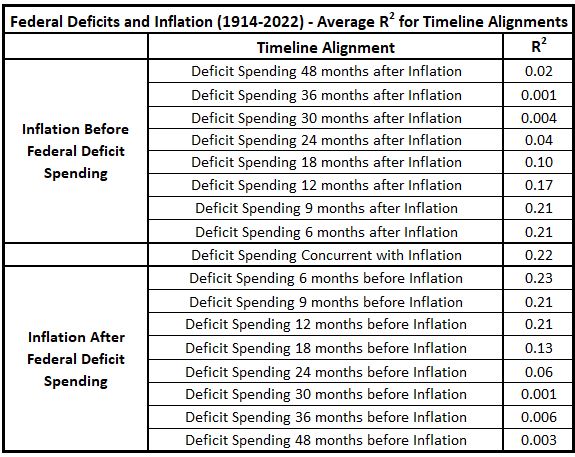
Figure 7. Variation of Corelation Between U.S. Federal Deficit Spending and CPI Inflation
with 16 Inflation Timeline Offsets Before and After Each Federal Fiscal Year (1914-2022)
This Updates Figure 11 Posted Previously1
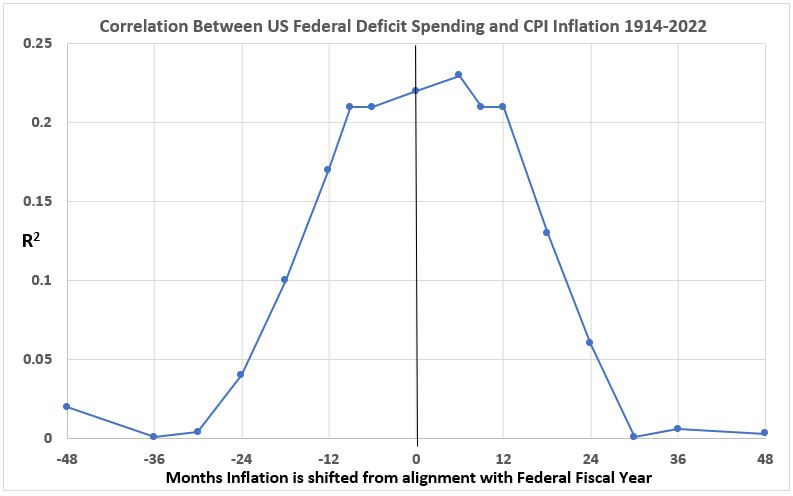
Compare Figure 7 with the previous1 Figure 11 (Part 8). The symmetry between average correlations for spending coming before inflation compared to the reverse is improved with the addition of the ±9 month timeline shift data, but it is still not “perfect”. Notably starting with the ±12 month offsets, inflation coming before spending declines faster than when inflation comes after spending.
How Consistent is the Correlation Across the Years 1914-2022?
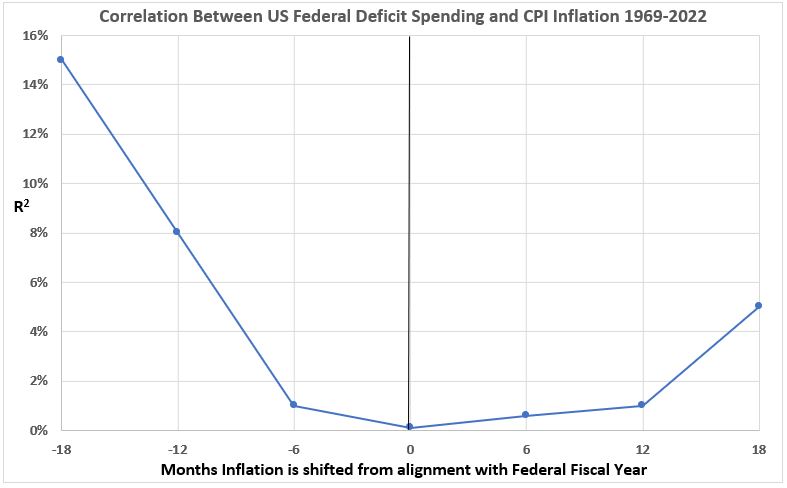
Does the correlation behavior change with sample size taken from the 109 years from 1914 to 2022? To test this sampling issue we have determined the correlation of interest on two samples, each consisting of half of the total. The two samples are 1914-1968 (55 years) and 1969-2022 (54 years). The data for these calculations came from Table 1 in Part 7 for inflation data aligned with fiscal years.4
The results, using the Excel CORREL function, for the years 1914-1968 correlation is 0.55 (R2 = 0.30) and for the years 1969-2022 it is 0.03 (R2 = 0.001).
Thus, as interesting as the correlation pattern is that we have determined for average correlations over the 109 years 1914-2022, we do not know how that result should be applied. There is a drastic change as the data sample selection is changed from the entire time period to two halves, confounding a simple interpretation. To emphasize this, we have created graphs similar to Figure 7 for the two halves of the time total time period 1914-2022.
Figure 8.
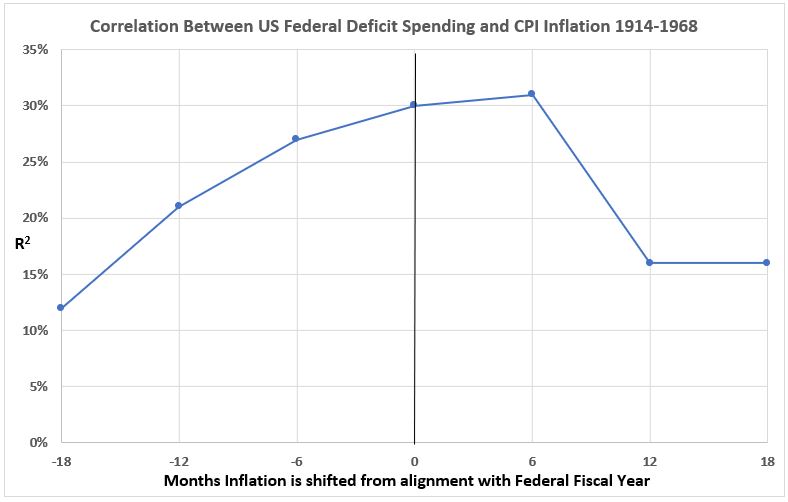
Figure 9.
Conclusion
There is a clear relationship of average correlation to the timeline alignments of inflation and deficit spending over the 109 years 1914-2022. But correlation is widely varying for subsets of the 109 years, shown by simply calculating correaltion for the two halves of the full time span. While the observation that there appears possibly to be some consistency in lead-lag relationships between inflation and spending, it is not obvious how to interpret that “average” result.
The clear inference from the observations in this work is that correlations vary over time. We have, in previous parts of this series, looked at time variations using rolling averages (moving averages). This was done on the basis that it was an interesting technique. But how reliable are the results? It appears that we must return to that (or some other technique) to track correlation over time. Thus, we will attempt next week to better understand the use of rolling averages to study time variation of correlation. We will also be looking for some other approaches for analyzing correlations that vary as a function of time.
Footnotes
1. Lounsbury, John, “Government Spending and Inflation. Part 8”, EconCurrents, April 9, 2023. https://econcurrents.com/2023/04/09/government-spending-and-inflation-part-8/.
2. Lounsbury, John, “Government Spending and Inflation. Part 5”, EconCurrents, March 12, 2023. https://econcurrents.com/2023/03/12/government-spending-and-inflation-part-5/.
3. Lounsbury, John, “Government Spending and Inflation. Part 4”, EconCurrents, March 5, 2023. https://econcurrents.com/2023/03/05/government-spending-and-inflation-part-4/.
4. Lounsbury, John, “Government Spending and Inflation. Part 7”, EconCurrents, April 1, 2023. https://econcurrents.com/2023/04/02/government-spending-and-inflation-part-7/.
Pingback: Government Spending and Inflation. Part 11 - EconCurrents