This week we return to the question of whether the inflation-spending correlation is greater when measured before, after, or concurrently with US federal deficit spending. The data for the 108-year period from 1914 to 2022 is used.

Credit: Image by Babil Kulesi from Pixabay
Introduction
The question of how the timing of inflation is related to when US federal deficit spending occurs was addressed previously.1 That previous analysis was done using 3-year rolling averages (moving averages) of the calculated correlations. Last week,2 we left (for the time being) the use of moving averages and looked closely at what could be determined using unsmoothed data. The only time relationship considered was for spending and inflation happening concurrently. We looked at several data arrangements, including eliminating what appeared to be data outliers. The conclusion was the entire data set with no data eliminations gave the largest value for correlation.
This week the same full data set is used, and we look at correlations for inflation measured for 12-month periods starting six and twelve months before and after the start of each fiscal year.
Data
Data used this week was first presented in Part 5.3
Inflation Starting Six Months After the Start of the Fiscal Year
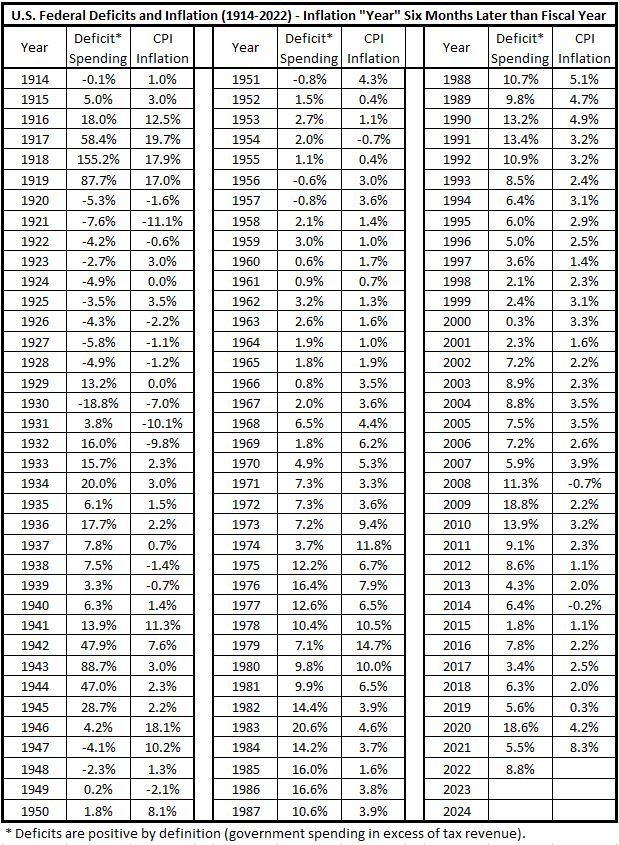
The following data is the same as shown in Part 5, Table 2.3 The only difference here is the correlation numbers shown in the previous table are not included.
Table 1. U.S. Federal Deficits and Inflation – Fiscal Years 1914-2022
(Deficits Lead Inflation by 6 Months)
Inflation Starting One Year Later than the Fiscal Year
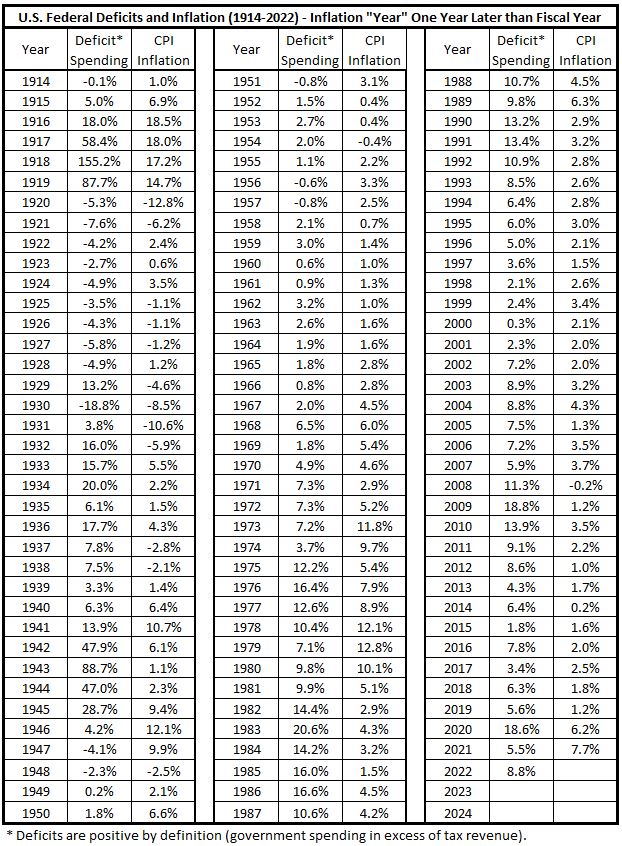
The following data is the same as shown in Part 5, Table 3,3 with correlation numbers not included.
Table 2. U.S. Federal Deficits and Inflation – Fiscal Years 1914-2022
(Deficits Lead Inflation by 12 Months)
Inflation Starting Six Months Before the Start of the Fiscal Year
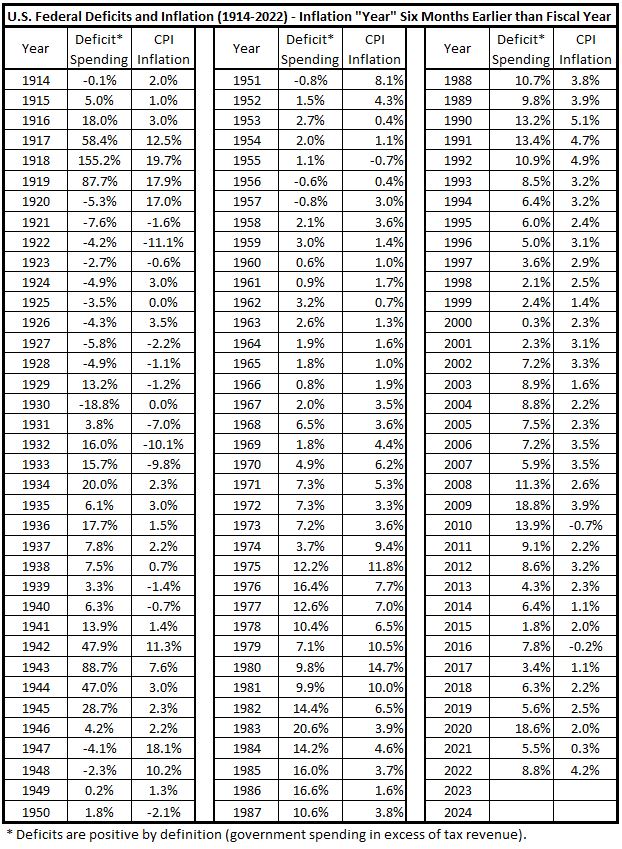
The following data is the same as shown in Part 5, Table 4,3 with correlation numbers not included.
Table 3. U.S. Federal Deficits and Inflation – Fiscal Years 1914-2022
(Deficits follow Inflation by 6 Months)
Inflation Starting One Year Before the Start of the Fiscal Year
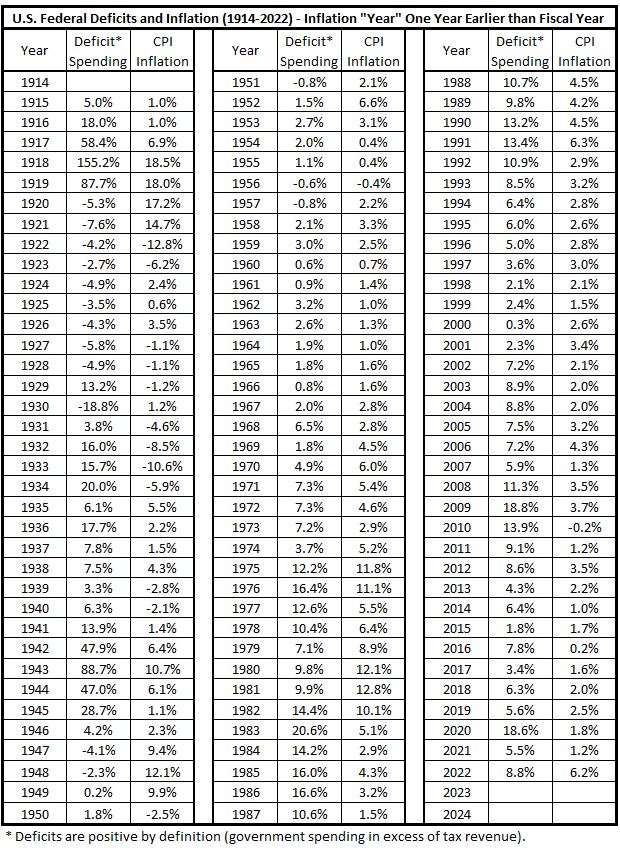
The following data is the same as shown in Part 5, Table 5,3 with correlation numbers not included.
Table 4. U.S. Federal Deficits and Inflation – Fiscal Years 1914-2022
(Deficits follow Inflation by 12 Months)
Analysis
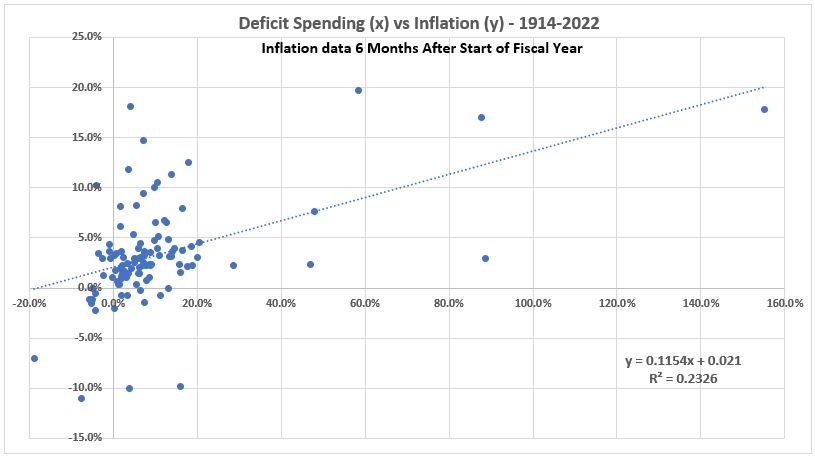
The data from Table 1 above produces the following scatter plot:
Figure 1. Deficit Spending vs. Inflation Measured Six Months after Start of Fiscal Year – 1914-2022
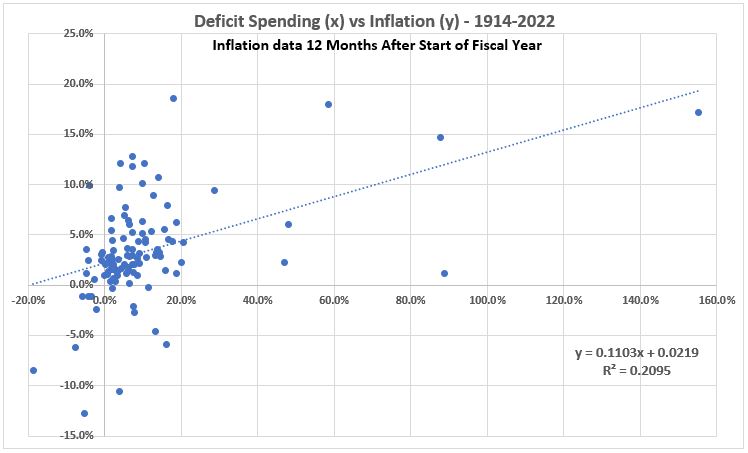
The data from Table 2 above produces the following scatter plot:
Figure 2. Deficit Spending vs. Inflation Measured 12 Months after Start of Fiscal Year – 1914-2022
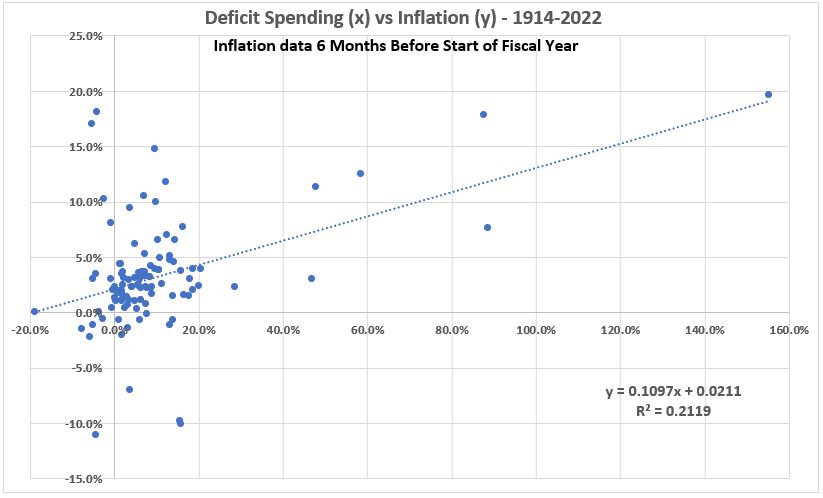
The data from Table 3 above produces the following scatter plot:
Figure 3. Deficit Spending vs. Inflation Measured 6 Months after Before Start of Fiscal Year – 1914-2022
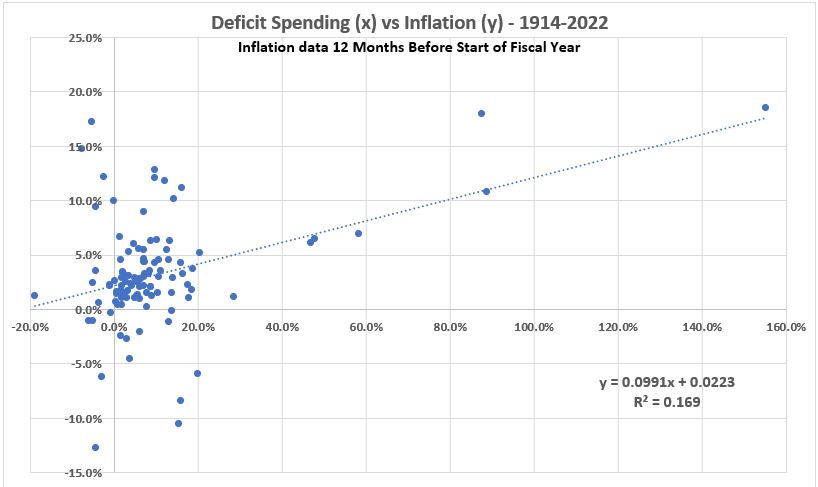
The data from Table 4 above produces the following scatter plot:
Figure 4. Deficit Spending vs. Inflation Measured 12 Months before Start of Fiscal Year – 1914-2022
The correlation data above, combined with that for coinicident deficit spending and inflation,2 is summarized in Table 5:
Table 5. Average Correlations for U.S. Federal Deficit Spending and CPI Inflation
1914-2022.
Five Timeline Alignments.
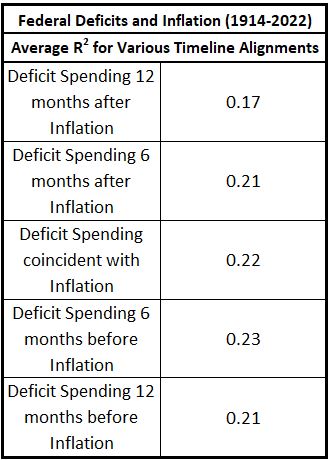
With the exception of Inflation data taken one year before spending data, these correlations are very similar. That raises the question: How much do inflation and spending correlate with larger timeline offsets?
How Rapidly Do Correlations Change as Delays between Deficit Spending and Inflation Increase?
In the previous section we determined the correlations between US federeal deficit spending and CPI inflation varied as the timeline of inflation was moved stepwise with respect to the federal fiscal year. The center of the timeline had inflation exactly aligned with the fiscal year. The correlations were determined for inflation “years” starting 6 months before and after the fiscal year, then 12 months plus and minus. The changes in correlation over this range of offsets was quite small. Do correlations change more significantly if the inflation data timeline is shifted more than one year vis a vis the federal fiscal year? In this section we look at mismatches of +/- 18, 24, and 30 months.
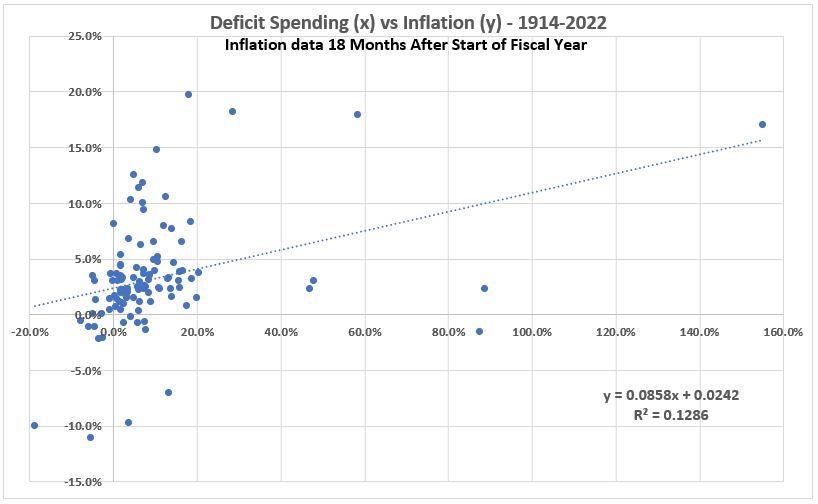
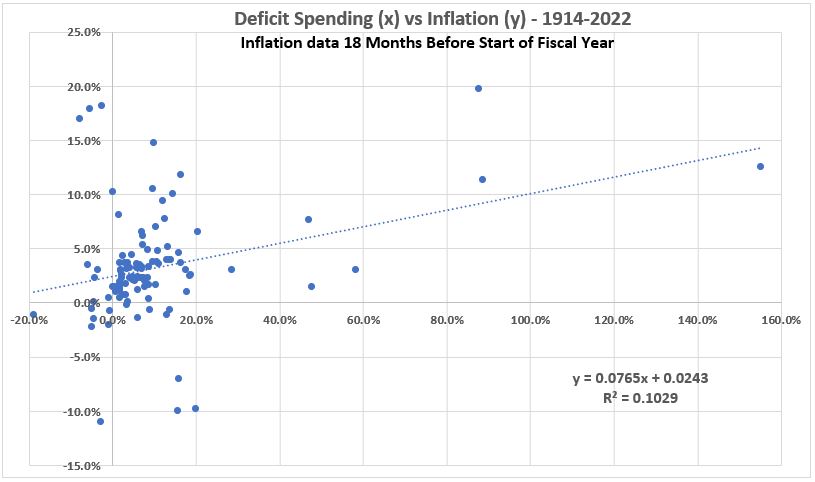
Inflation 18 Months Later than Spending
Table 6. Inflation 18 Months Later than Deficit Spending (1914-2022)
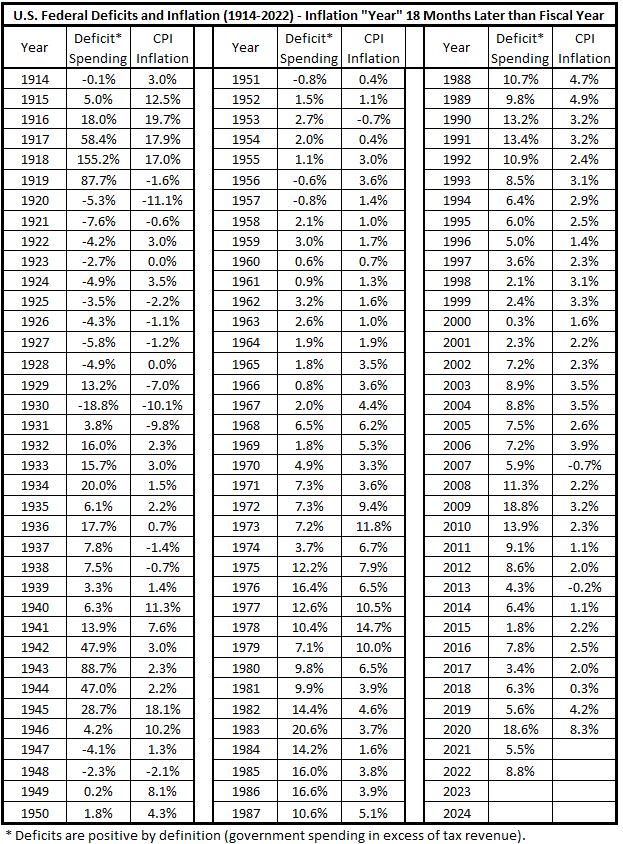
Figure 5. Inflation 18 Months Later than Deficit Spending (1914-2022)
Inflation 18 Months Earlier than Spending
Table 7. Inflation 18 Months Earlier than Deficit Spending (1914-2022)
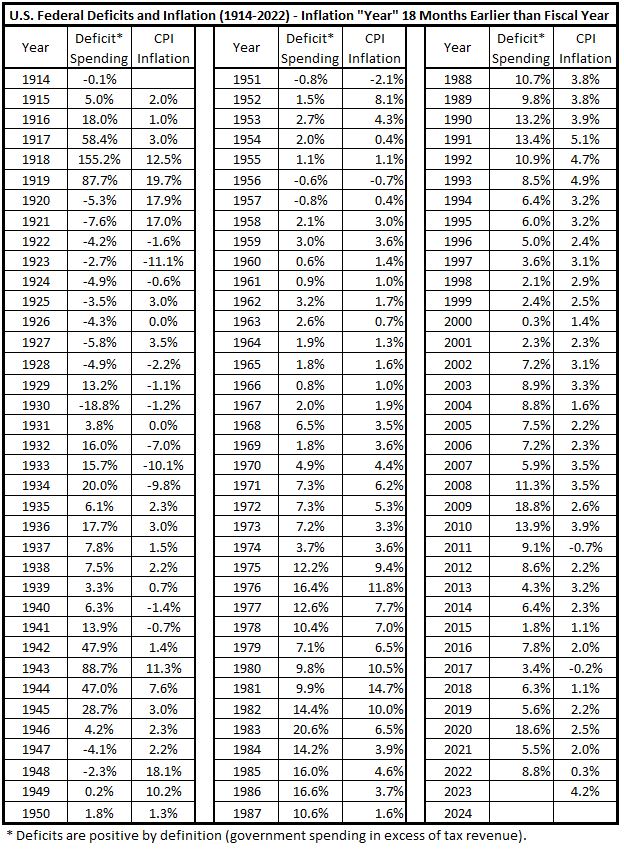
Figure 6. Inflation 18 Months Earlier than Deficit Spending (1914-2022)
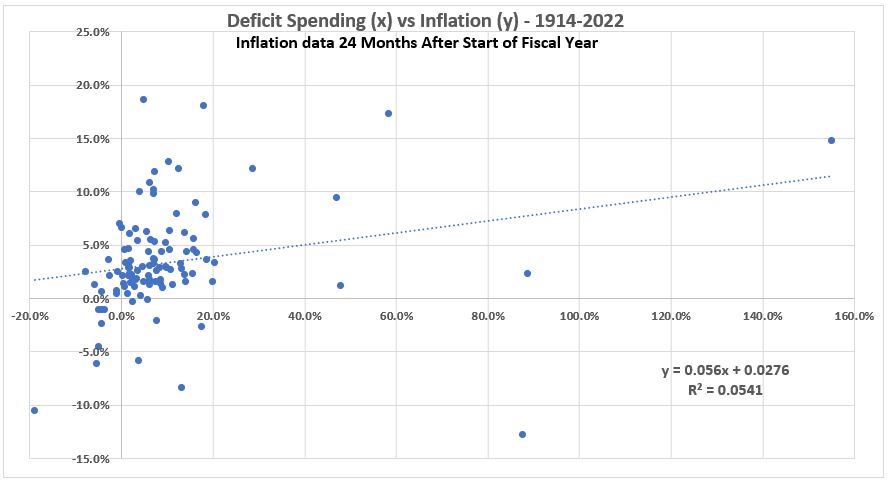
Inflation 24 Months Later than Spending
Table 8. Inflation 24 Months Later than Deficit Spending (1914-2022)
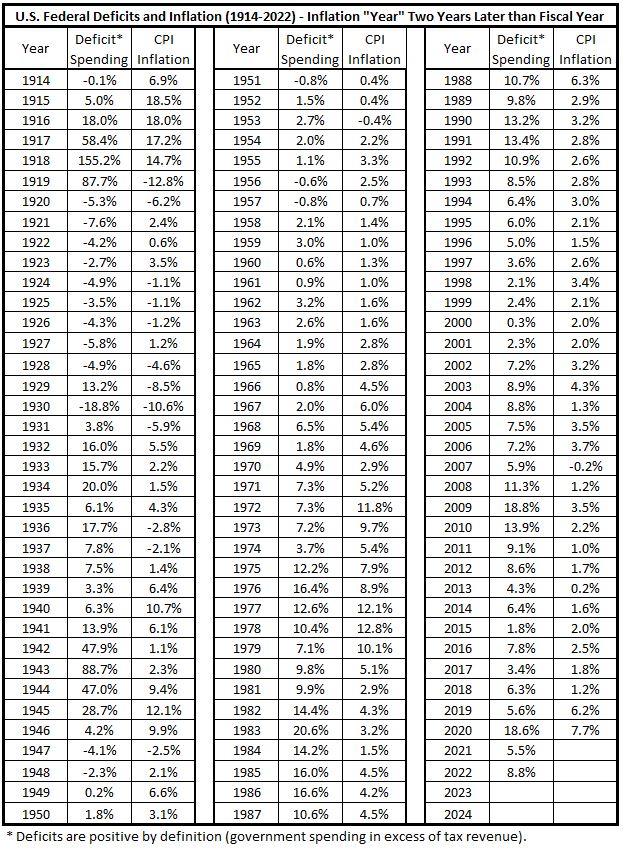
Figure 7. Inflation 24 Months Later than Deficit Spending (1914-2022)
Inflation 24 Months Earlier than Spending
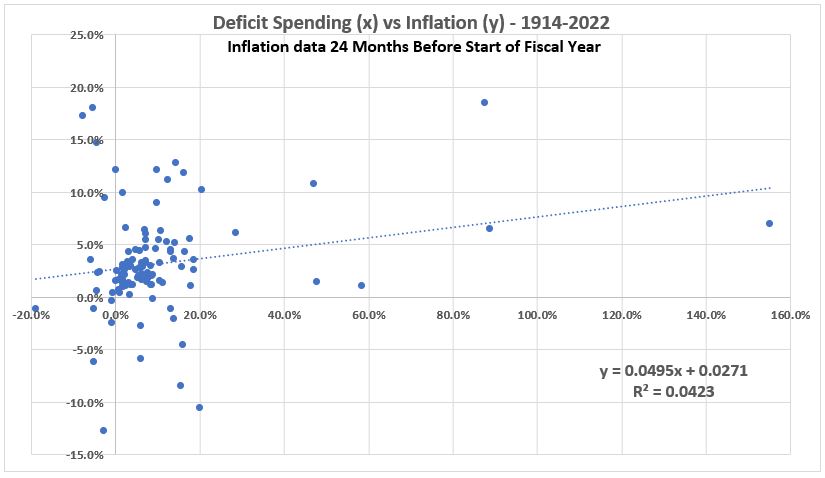
Table 9. Inflation 24 Months Earlier than Deficit Spending (1914-2022)
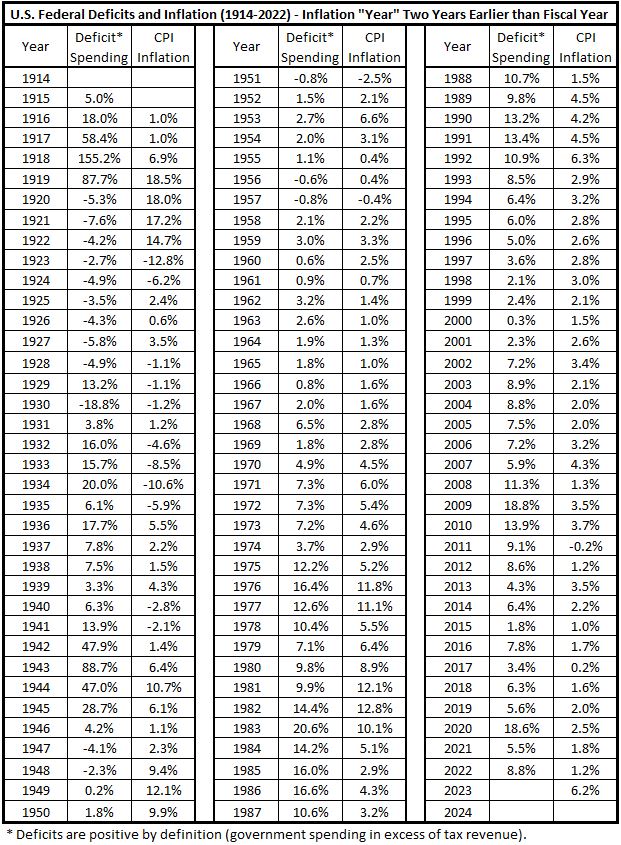
Figure 8. Inflation 24 Months Earlier than Deficit Spending (1914-2022)
Inflation 30 Months Later than Spending
Table 10. Inflation 30 Months Later than Deficit Spending (1914-2022)
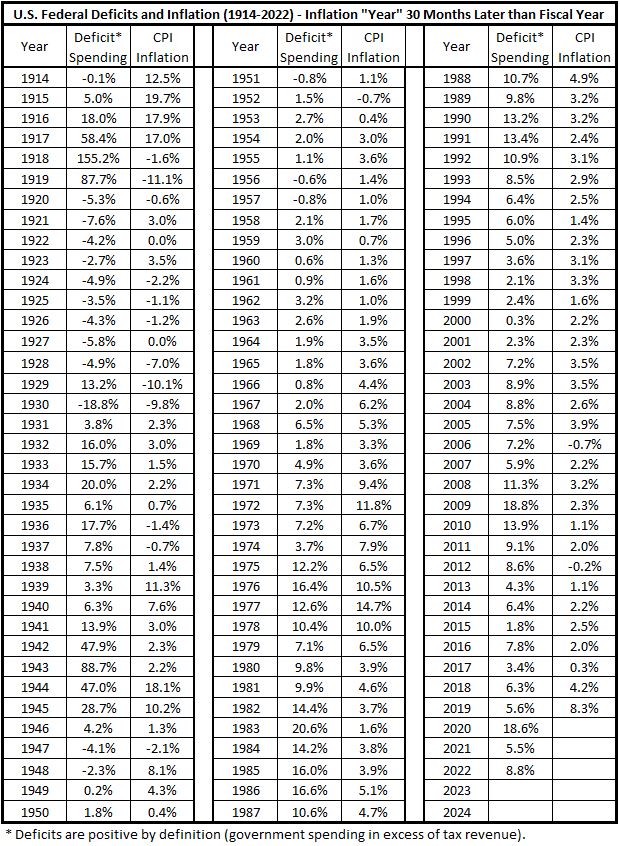
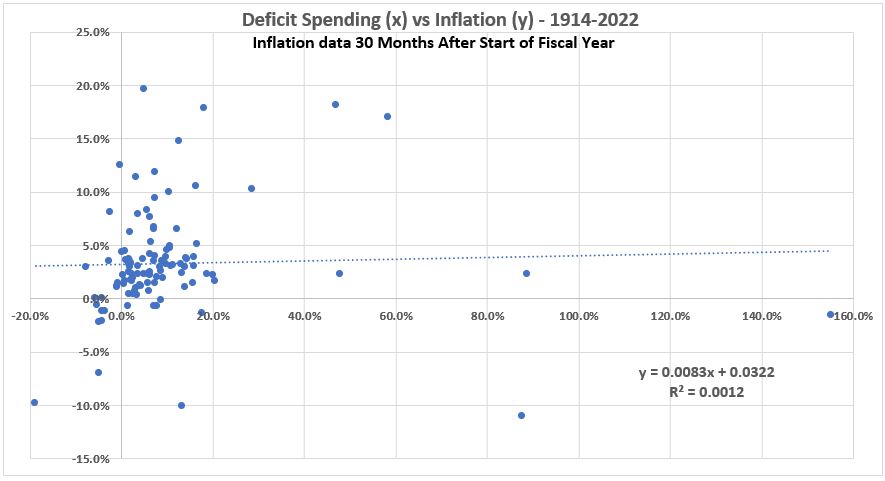
Figure 9. Inflation 30 Months Later than Deficit Spending (1914-2022)
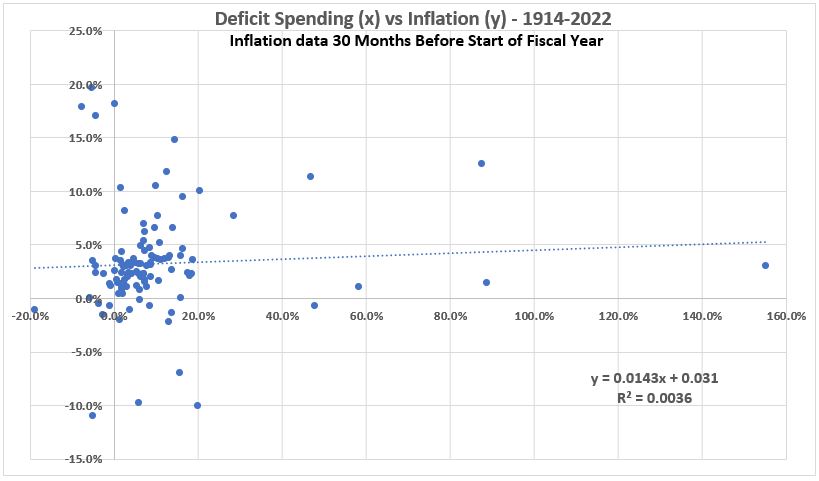
Inflation 30 Months Earlier than Spending
Table 11. Inflation 30 Months Earlier than Deficit Spending (1914-2022)
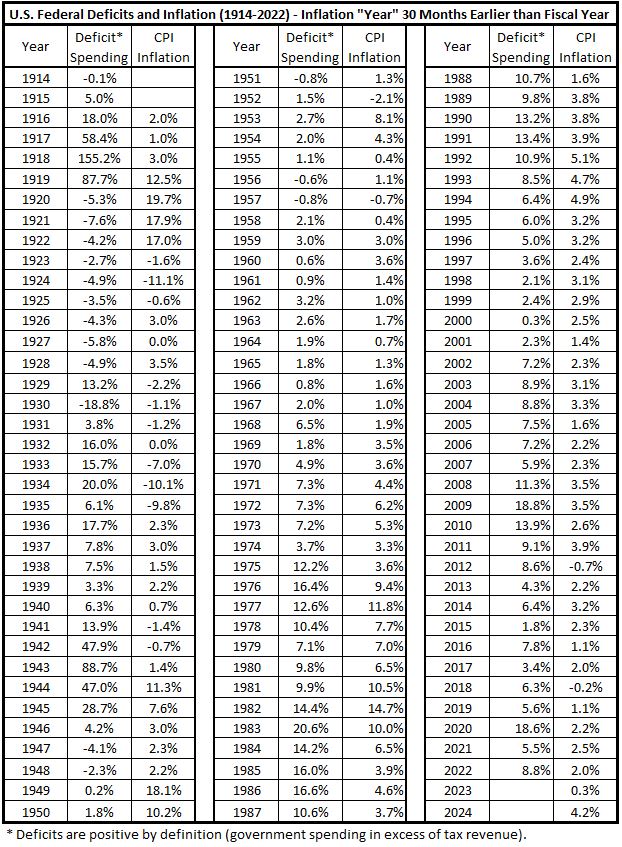
Figure 10. Inflation 30 Months Earlier than Deficit Spending (1914-2022)
Variation of Correlation as the Offsets Between Fiscal Year and Inflation “Year” Data Change
The data for correlation between US federal deficit spending and CPI inflation from the analysis above is shown in Table 12. The variation as the timeline for inflation is shifted in 6-month intervals to follow or precede the fiscal year up to +/- 30 months changes drastically once the offsets exceed 12 months in either direction.
Table 12. Average Correlations for U.S. Federal Deficit Spending and CPI Inflation
1914-2022.
Eleven Timeline Alignments.
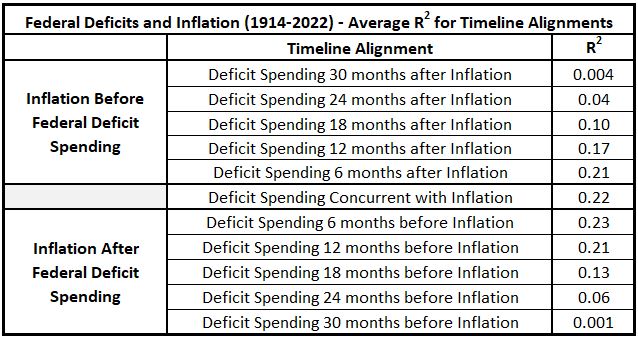
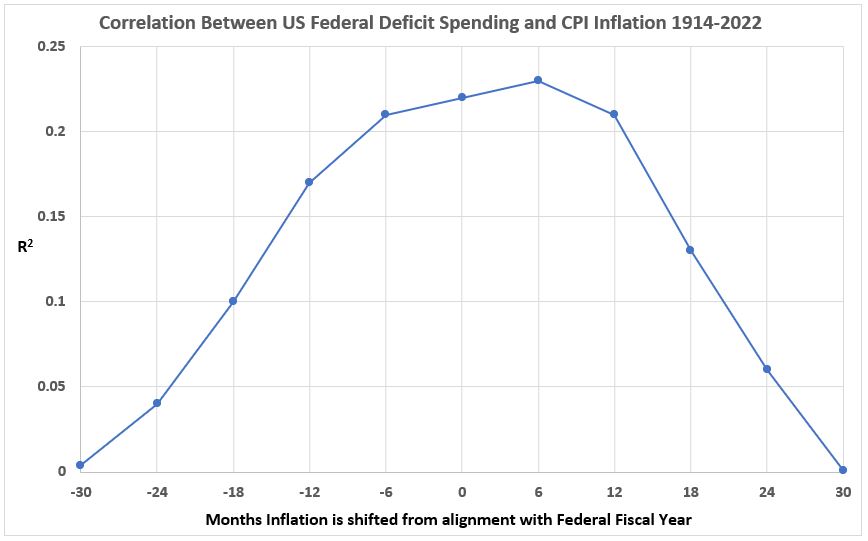
Figure 11. Variation of Corelation Between U.S. Federal Deficit Spending and CPI Inflation
with Inflation Timeline Offsets Before and After Federal Fiscal Year (1914-2022)
Conclusion
There is significant correlation between U.S. federal deficit spending and CPI inflation when the two data sets are exactly aligned or offset by a few months. The R2 values for no offset, ±6 months, and +12 months are probably not significantly different. But for offsets larger than those the correlation declines rapidly and is close to zero at ±30 months.
Summary of Results
The significant correlation found leads to a number of conclusions:
1. Deficit spending by the federal government is statistically associated with inflation experienced by consumers.
2. Statistical association by itself does not infer cause and effect. Additional information is required for that.
3. The association seen in this data shows a slightly higher level for inflation following spending than for the reverse or concurrent spending. This may or may not be significant.
4. The duration of the highest level of association is greater for inflation following spending (12 months) than for inflation preceding spending (6 months).
5. The correlation calculated above is the average over the 108 years of data. We have previously shown that the inflation-spending correlation varies frequently and wildly between ±100% over time.
Summary of Conclusions
The existence of significant correlation between inflation and spending when the inflation occurs before the spending means that if there is any cause and effect, inflation can cause increased spending as well as the other way around. The old sage of increased spending causing inflation would be modified to recognize that inflation could also increase spending.
In a debate over which came first, the chicken or the egg, this case has shown there is an potential answer: The timeline offsets show it is possible that inflation can come before spending, at least for the case of government spending.
A reasonable hypothesis at this point is that government spending and inflation collaborate in a self-reinforcing feedback loop. Once inflation is started, government spending increases which contributes to more inflation. Whether spending or something else started inflation in the first place is a separate question. And the persistance of the feedback loop appears to be quite short, dying out within 2 to 2 1/2 years. Since inflation has at times during the last 108 years persisted for longer periods of time, it suggests that other possible causes of inflation would have a longer duration. Of course, these results represent an average correlation over a long period of time. Duration of the feedback could vary from cycle to cycle.
What’s Next?
With the added insight from the latest work, I want to return to looking at the time-variation of the correlation of federal spending and inflation. That is what will occupy my attention over the next week. And I will start to look at other possible causes of inflation for investigation in the near future.
Footnotes
1. Lounsbury, John, “Government Spending and Inflation. Part 6”, EconCurrents, March 26, 2023. https://econcurrents.com/2023/03/26/government-spending-and-inflation-part-6/.
2. Lounsbury, John, “Government Spending and Inflation. Part 7”, EconCurrents, April 1, 2023. https://econcurrents.com/2023/04/02/government-spending-and-inflation-part-7/
3. Lounsbury, John, “Government Spending and Inflation. Part 5”, EconCurrents, March 12, 2023. https://econcurrents.com/2023/03/12/government-spending-and-inflation-part-5/.
It will be interesting to see whether/how much supply shortages influence inflation, since gov’t spending alone does not seem to account for inflation or is as likely to precede gov’t spending as follow it.
Scott, I intend to look at growth in credit next (household, commercial, total non-financial, and total private debt, including financial) and then move on to supply issues (especially energy and other commodities, as well as labor). I doubt this will develop a complete picture, but I hope to end up defining some of the things that are not causes of inflation. And who knows, maybe I get lucky and find more.
Pingback: Government Spending and Inflation. Part 9 - EconCurrents