At the end of every month, NOAA updates its Outlook for the following month which in this case is April of 2023. We are reporting on that tonight.
There have been some significant changes in the Outlook for April and these are addressed in the NOAA Discussion so it is well worth reading. We highlighted some of the important changes within the NOAA Discussion. We also provided the prior Mid-Month Outlook for April for comparison. From the NOAA Discussion:
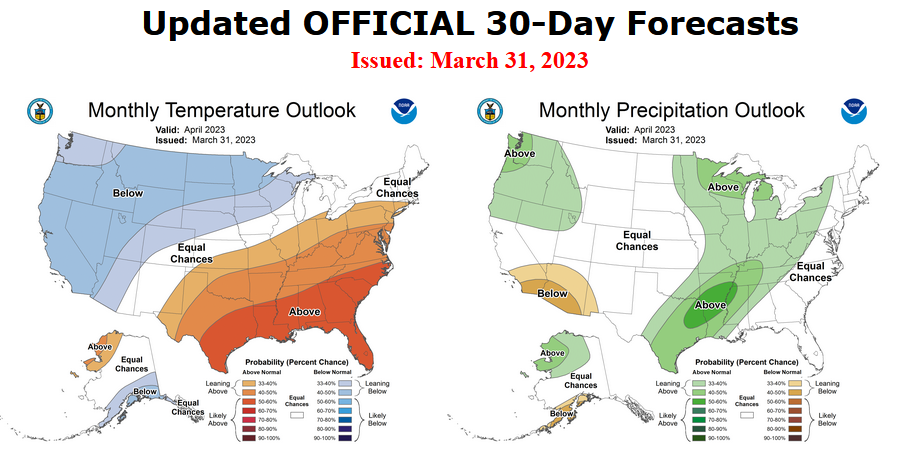
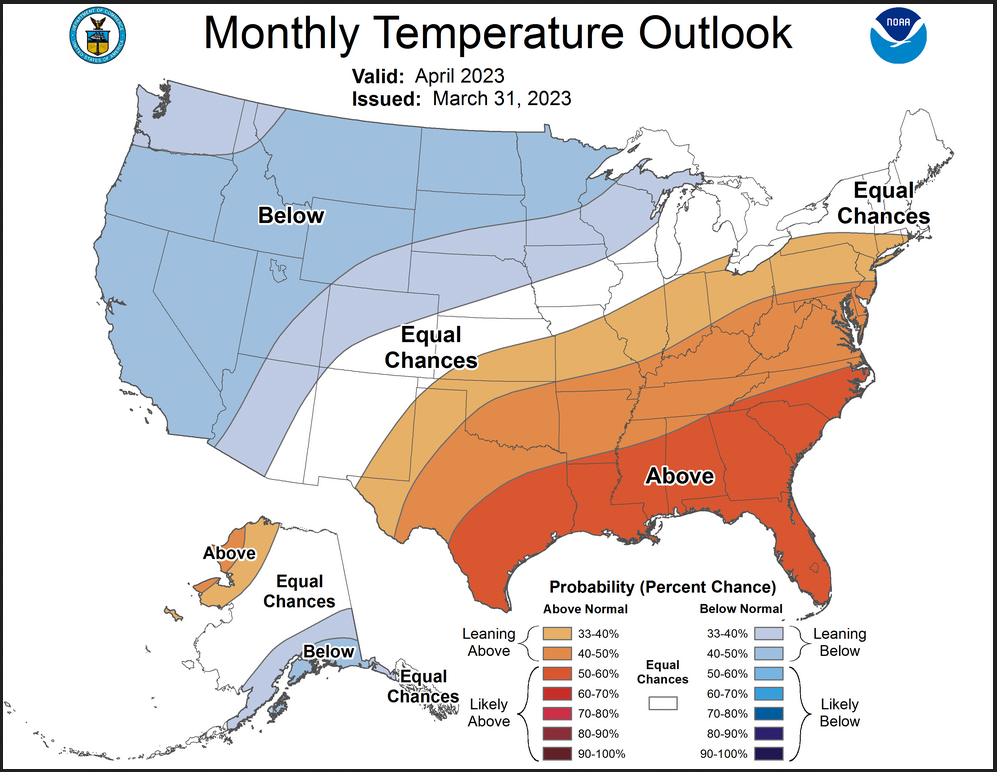
- The updated April temperature outlook indicates an expansion of enhanced probabilities for below normal temperatures for the western and north-central contiguous U.S. (CONUS)
- The updated April temperature outlook shows a reduction in the probabilities favoring above normal temperatures for parts of the Southwest, while continuing to indicate likely above normal temperatures for the Southern Plains, the Central and Lower Mississippi Valley, the Ohio Valley, the Southeast, and the Mid-Atlantic region.
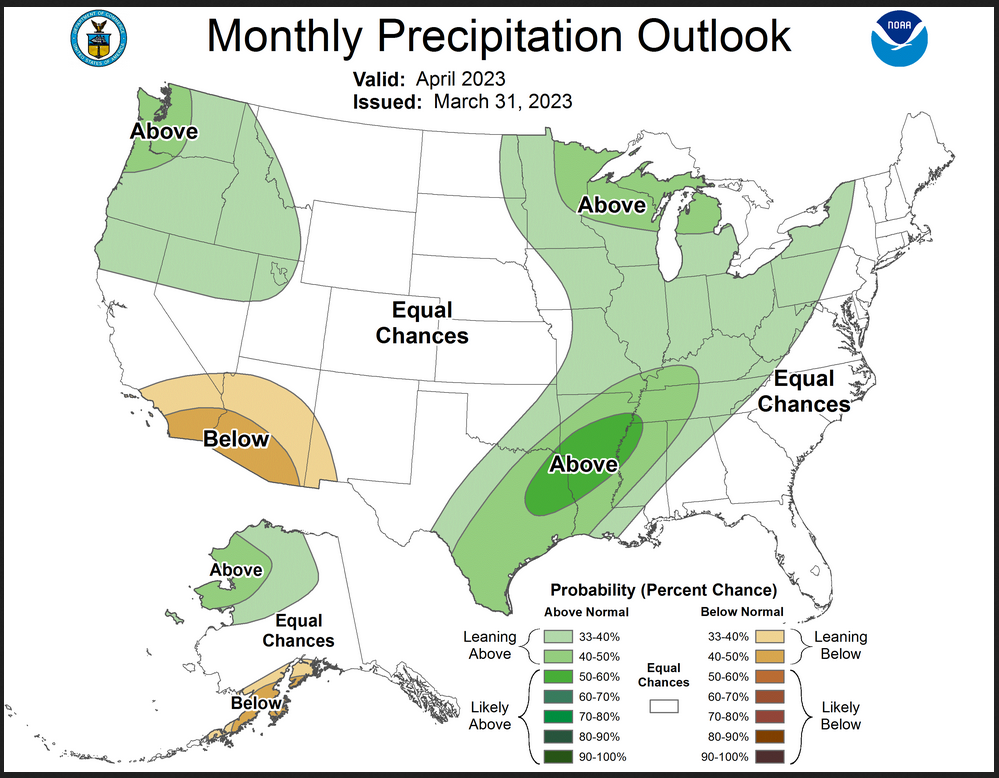
- The updated April precipitation outlook indicates an increased probability of above normal precipitation for the Pacific Northwest
- The area of enhanced probabilities of below normal precipitation over parts of the Southwest has decreased in the updated April Outlook
- The updated April precipitation outlook indicates increased probabilities of above normal precipitation from East Texas across the Lower Mississippi Valley into the Ohio and Tennessee Valleys, as well as for eastern areas of the Northern Plains, the Great Lakes region, and western New York state
- The April precipitation outlook favors above normal precipitation for northwestern Alaska into parts of the Alaska interior and below normal precipitation for the Alaska Peninsula and the southwestern coast
The article includes the Drought Outlook for April. We have also included the current fire incidents (starting to increase) and four months of Wildland Fire Potential Outlooks and also a map showing the year-to-date snowpack in the West. We also provide the Week 2/3 Tropical Outlook for the World.
| Our regular Daily Weather article can be found HERE. In addition to the short-term forecast it also provides the 6 – 10 day, 8 – 14 day and Week 3 – 4 Outlooks. That is not a full month but close to it. So it is helpful if one wants to understand how the full-month forecast is expected to vary through the month. And the maps in the Daily article update throughout the month. |
Here is the updated Outlook for April, 2023
For Comparison Purposes, Here is the Mid-Month Outlook for April
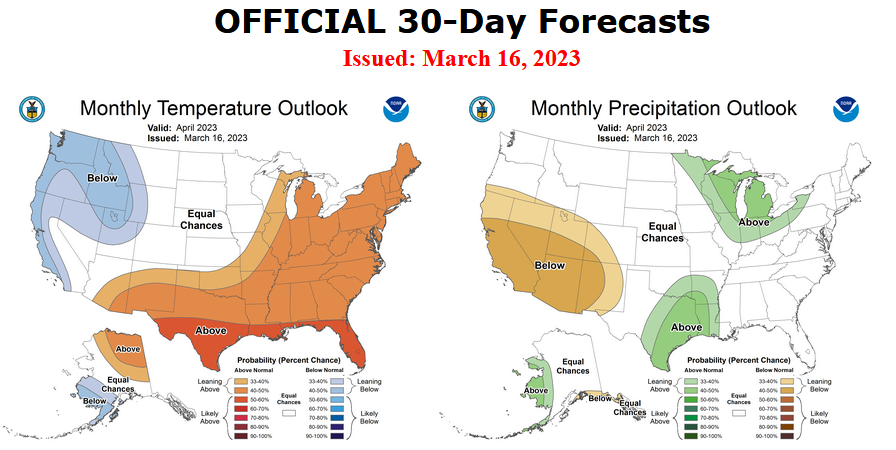
| There has been a fairly substantial change. Remember, it is the top set of maps that are the current outlook for April. |
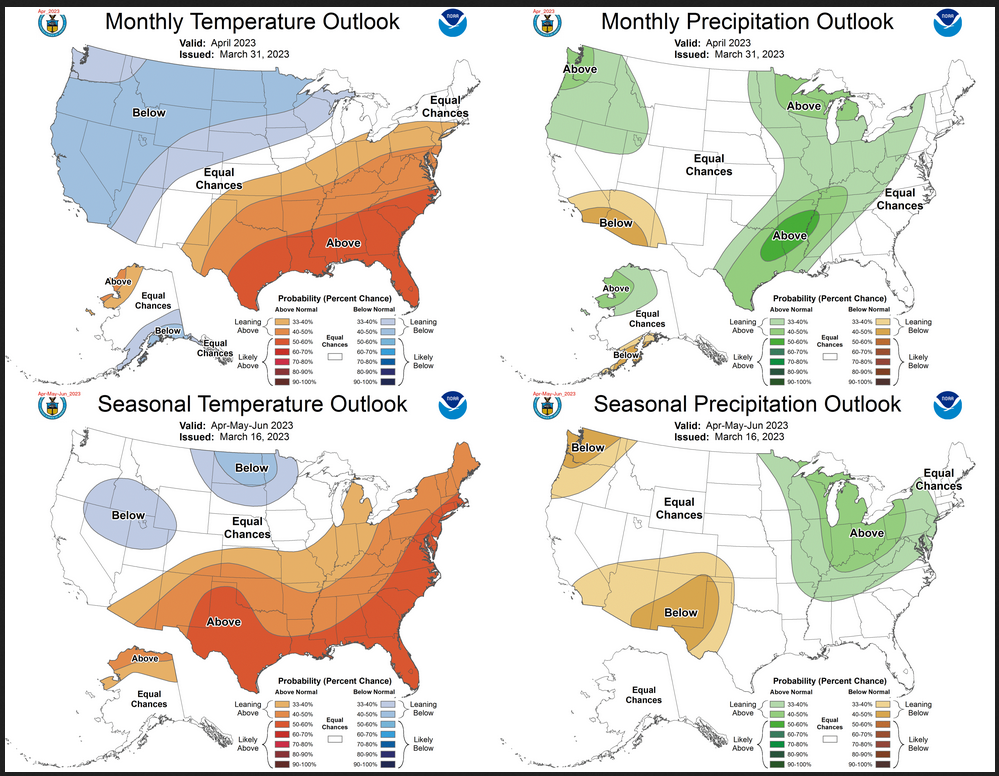
Combination of the Updated Outlook for April and the Three-Month Outlook
ANALYSIS
| For both temperature and precipitation, if you assume the colors in the maps are assigned correctly, it is a simple algebra equation to solve the month two/three anomaly probability for a given location = (3XThree-Month Probability – Month One Probability)/2*. So you can derive the month two/three outlook this way. You can do that calculation easily for where you live or for the entire map. |
It is important to remember that the Outlook for next month was updated on the last day of the current month and the three-month Outlook was issued on the third Thursday. So the period of time between the Mid-Month and End of Month Update varies from month to month from 10 days to 16 days. So there sometimes is a substantial change in the Next Month’s Outlook from the Mid-Month prediction. In such cases, we wonder if a change in the one-month outlook suggests that the three-month outlook would need to also be adjusted. I think that in this case, the answer is that it might be wise to review that but it will not happen until the third Thursday in the coming month. We will get a hint of that a week earlier when the ENSO Update is issued on the Second Thursday of this coming month which is not far from now.
Here are larger versions of the Temperature and Precipitation Outlook maps
NOAA (Really the National Weather Service Climate Prediction Division CPC) Discussion (I have shown certain important points in bold type. my comments if any are in brackets [ ])
30-DAY OUTLOOK DISCUSSION FOR APRIL 2023
The updated temperature and precipitation outlooks for April 2023 reflect recent dynamical model guidance from the GEFS and CFSv2, as well as current WPC week 1 outlooks and the CPC week 2 and week 3-4 outlooks. The Madden Julian Oscillation (MJO) was recently active with convective activity over the Maritime Continent, although the Real-time Multivariate MJO (RMM) index now indicates a reduced MJO signal, as subseasonal variability interacts with the background climate state. Dynamical models , such as the ECMWF and GEFS, forecast a possible reemergence of the MJO signal over the tropical Pacific. However, there is uncertainty in the timing and phase of a future MJO signal and potential impacts to the temperature and precipitation patterns over North America. While the recent La Niña event has ended, residual atmospheric conditions similar to La Niña continue, such as suppressed convection near the date line.
The updated April temperature outlook indicates an expansion of enhanced probabilities for below normal temperatures for the western and north-central contiguous U.S. (CONUS), due to recent dynamical model guidance and outlooks for the beginning of the month. WPC temperature outlooks for the first week of April indicate a very similar temperature pattern, as do recent CPC 6-10 day period outlooks and dynamical model consolidation tools. The updated April temperature outlook shows a reduction in the probabilities favoring above normal temperatures for parts of the Southwest, while continuing to indicate likely above normal temperatures for the Southern Plains, the Central and Lower Mississippi Valley, the Ohio Valley, the Southeast, and the Mid-Atlantic region. This pattern of below and above normal temperatures across this CONUS is supported by the CFSv2 model guidance for the month, in addition to the WPC and CPC outlooks for the beginning of the month. Above normal temperatures are favored for a small coastal area of northwestern Alaska, while below normal temperatures are favored for the south coast of the Alaska Mainland, supported primarily by the most recent CFSv2 model forecasts. A considerable increase in uncertainty leads to a forecast of equal chances (EC) of above, near and below normal temperatures for much of Alaska, with conflicting signals among various tools.
The updated April precipitation outlook indicates an increased probability of above normal precipitation for the Pacific Northwest, supported by recent WPC outlooks for the first week of the month, the CFSv2 April precipitation forecast, and the CPC Week 3-4 Outlook. The area of enhanced probabilities of below normal precipitation over parts of the Southwest has decreased in the updated April Outlook, with increased chances of precipitation in both the CPC 8-14 day outlook and the Week 3-4 Outlook over eastern areas of the Southwest, and over parts of Central California in the first week of April. The updated April precipitation outlook indicates increased probabilities of above normal precipitation from East Texas across the Lower Mississippi Valley into the Ohio and Tennessee Valleys, as well as for eastern areas of the Northern Plains, the Great Lakes region, and western New York state. Chances of above normal precipitation for the month of April are increased over these areas by precipitation forecasts for the first week of the month. Probabilities exceed 50 percent for parts of East Texas northeastward to the Mississippi, where predicted precipitation in the first week approaches April climatological precipitation amounts.
The April precipitation outlook favors above normal precipitation for northwestern Alaska into parts of the Alaska interior and below normal precipitation for the Alaska Peninsula and the southwestern coast, supported by the most recent CFSv2 model forecasts and consistent with precipitation outlooks for the start of the month. An area of enhanced probabilities for below normal precipitation over the Alaska Panhandle has been removed in the updated outlook, considering recent outlooks for week 2 and weeks 3 and 4.
Drought Outlook
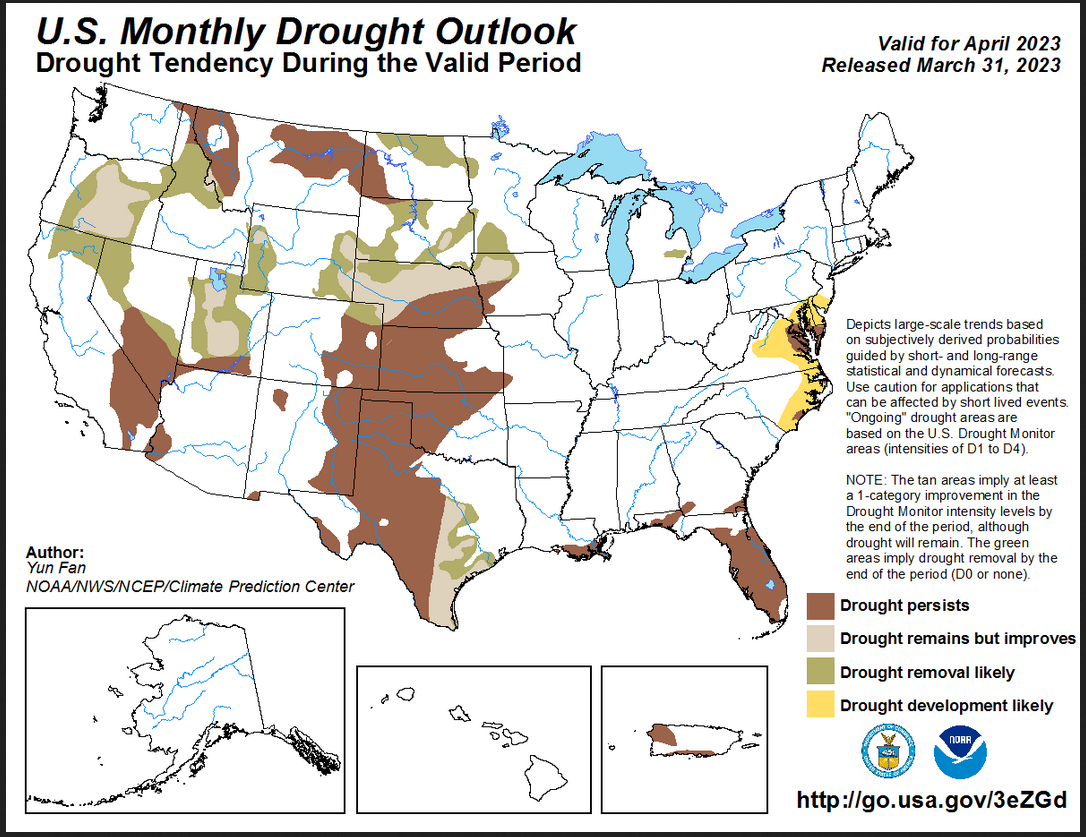
Here is the newly issued Drought Outlook for next month.
–
| You can see where drought development or reduction is likely. There is a significant reduction in the area that is forecast to be in drought. The summary and detailed discussions that accompany this graphic can be accessed HERE |
Here is the short version of the drought summary
Latest Monthly Assessment – Based on the U.S. Drought Monitor, drought coverage across the contiguous U.S. (CONUS) peaked at 62.95 percent during late October 2022. Since that time, drought coverage and intensity have steadily decreased across much of the West, northern Great Plains, Midwest, Tennessee and Ohio Valleys. The coverage of severe (D2) to exceptional (D4) drought is at its lowest since August 2020. Based on an above-average snowpack and the April outlook favoring above-normal precipitation over the northwestern CONUS and below-normal temperatures, continued drought improvement or removal is forecast for northern California, Oregan and northern Idaho. Due to lack of wet signals in the forecasts and below-normal snowpack, drought persistence is likely over western Montana. Broad-scale improvement/removal is favored for parts of the northern and central Great Plains, central High Rockies and western Midwest due to above-normal snowpack, areas trending to its wet climatology and a favorable time of year for soil moisture recharge. Broad-scale persistence is also the most likely outcome for a majority of the ongoing drought across parts of the southwestern CONUS, central and southern Great Plains, and the Southeast, due to lack of wet signals in the forecasts and also April is a relatively dry time of year. Improvement or removal is likely for parts of central-eastern Texas and southeastern Michigan with predicted above-normal precipitation for April. Below-normal precipitation in March and low streamflow were observed over the Delmarva, and persistence/development is expected over these areas, including eastern portions of North Carolina. Alaska and Hawaii are likely to remain drought-free through the end of April. Drought persistence is also likely for Puerto Rico.
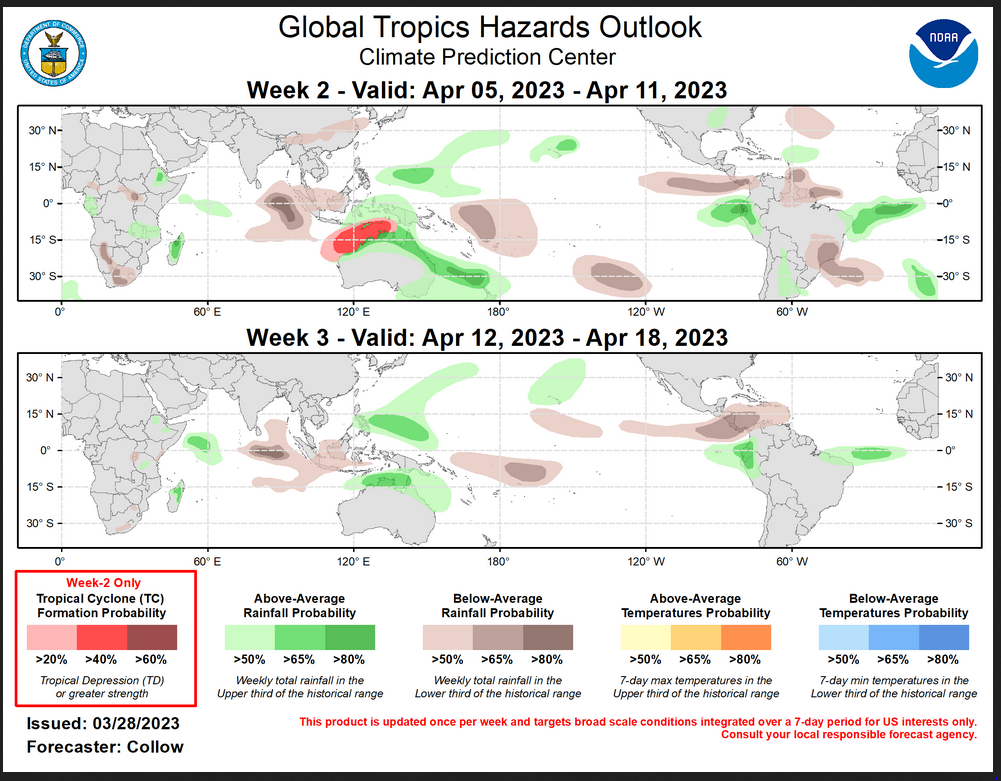
Worldwide Tropical Forecast
 –
–
| To update this forecast (which updates on Tuesdays) click HERE |
Month-to-date Temperature as the current month evolves can be found at https://hprcc.unl.edu/products/maps/acis/MonthTDeptUS.png
Month-to-date Precipitation as the current month evolves can be found at https://hprcc.unl.edu/products/maps/acis/MonthPNormUS.png
CLIMAS Podcast
Sorry: No CLIMAS Podcast this month
Water-Year to Date SWE and Precipitation
Water year-to-date SWE can be found by clicking HERE I provided a map current as of the day before this article was published.
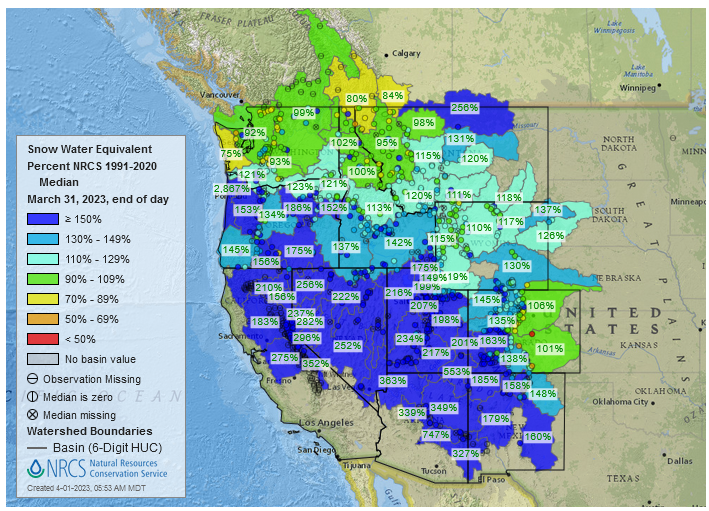
| This map shows a good situation. Most basins are way above to slightly above the median with just a few below. No long ago we published a full article on the Colorado River Basin and you can access that article HERE. |
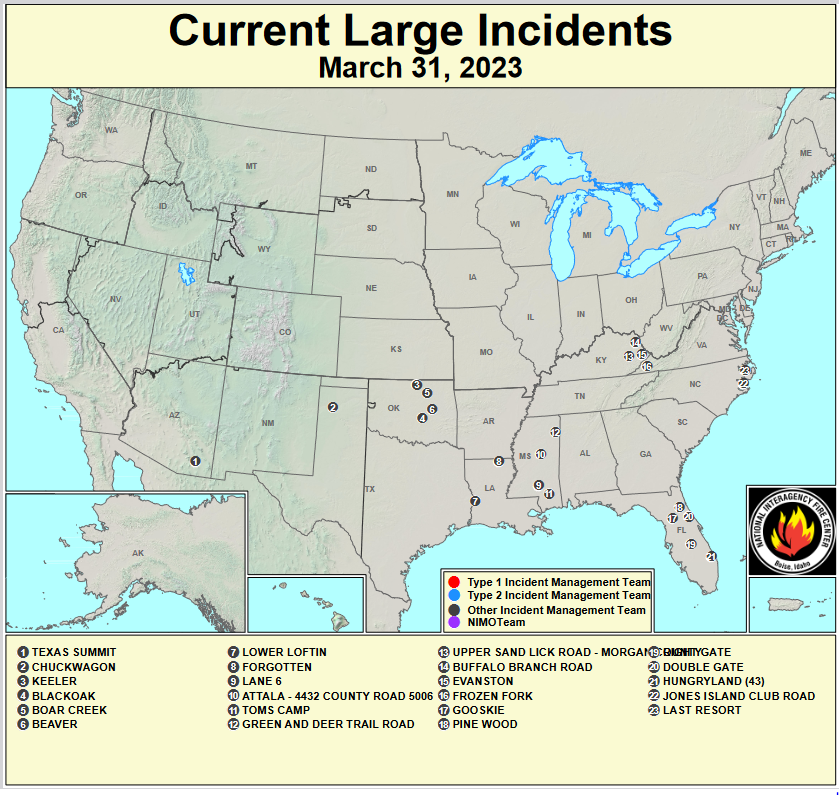
Fire Outlook: Current and Forecast
Updates to the major fire situation can be found by clicking here https://fsapps.n wcggov/afm/index.php
| The number of wildfires has started to increase. |
Now looking at the wildland fire potential Outlooks. (Normally these maps will update in the afternoon of the first day of the month – But their website is down right now perhaps due to the weekend. So it is not clear when these wildfire forecasts will show up in this article).
Since they are set to auto-update, if you look at a prior version of this article, these four maps will not be the original maps but the updated maps.
April Wildfire Risks
May Wildfire Risks
June Wildfire Risks
July Wildfire Risks
If you read this article a month from now and if the maps did not auto-update, you can update these graphics by clicking here https://www.ni fc.gov
| I hope you found this article interesting and useful |