Written by Steven Hansen
 The Federal Reserve data release (Z.1 Flow of Funds) – which provides insight into the finances of the average household – shows improvement in average household net worth. Our modeled “Joe Sixpack” – who owns a house and has a job, but essentially no other asset – is worse off than he was last quarter.

Here is the view of households based on the 2020 US Census data:
- Roughly 1/3 of households are living paycheck-to-paycheck – and do not own any financial assets except for a bank account or car. This group is financially in worsening shape as in inflationary times they are behind the eight-ball (as income increases lag expenditure increases).
- Roughly the next 1/3 are Joe Sixpack households. They are homeowners – but do not own stocks, bonds, or business ownership.
- Roughly the next 20% or so of the households are middle-man who own houses, stocks, bonds, or business ownership. Historically, these are the upper-middle class.
- The remaining +/-5% of the households are financially well off enough that they are little affected by changing economic conditions.
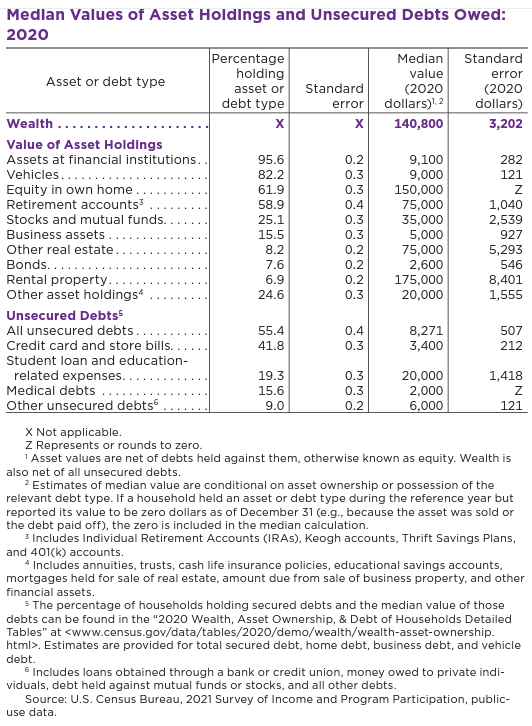
source: https://www.census.gov/content/dam/Census/library/publications/2022/demo/p70br-181.pdf
The Z.1 Flow of Funds net worth data is not inflation adjusted.
Food for thought [from the data in the Z-1 Flow of Funds]:
- It is interesting that consumer credit year-over-year growth was 7.9% according to Fed data but it is only 1.5% inflation-adjusted (this consumer credit increase is low historically).
- The average house has appreciated 12.6% but the inflation-adjusted owner’s equity is up 5.5 %. Generally, as home prices increase – so do property taxes and other homeownership costs. So whilst homeowners might think they are richer, their budgets degrade. Also, home values are relative – and it does not increase one’s ability to buy a better house.
- Real disposable Personal Income’s year-over-year rate of growth is 1.4 %.
- The rate of growth of financial assets is -6.7% and -13.8% inflation-adjusted.
- The year-over-year growth rate of the Z.1 Flow of Funds net worth data was -2.7 % and -9.8% inflation-adjusted
- Inflation is a major factor in net worth as the Consumer Price Index is up 6.3% year-over-year.
The Joe Sixpack Index
The Joe Sixpack Index is a composite index of home prices and wage income (again – Joe owns a house with a mortgage, has a job, and no other assets). This index was designed to measure how rich Joe should feel. The theory is that the richer Joe feels, the more Joe will spend.
- It is inflation and population adjusted.
- It is relative to the previous quarter – so the trend is the major influence on the index.
- Currently, Joe has a house that is increasing in value but the equity growth declined. The net effect is that the rate of growth of the index declined.
Joe Sixpack Index (blue line, left axis) shown against GDP (red line, right axis)
The Middle Man Index
The middle-class household with financial assets and real estate assets is Middle Man.
Unfortunately, retirement accounts are not separately detailed in the Z.1 reporting – but the graph below uses 25% of the change in Total Household Assets as a proxy for change in retirement accounts.
Total Household Assets (blue bars) vs Savings (red bars)
Adding the financial assets of Middle Man to the housing and compensation data used in the Joe Sixpack index, we see that Middle Man is better off than last quarter with his situation – but the rate of improvement declined. It is the growth in value of real estate and other assets that is the governing factor for Middle Man (not wages).
Middle Man Index (blue line, left axis)
Caveats on this Post:
This is a lagging view of the average American’s situation. Having said this, Joe and Middle Man’s consumption is somewhat affected by how rich they feel – and it takes some time for the wealth effect to sink in.
Most of the data in this post is from “Flow of Funds Accounts of the United States” (Z.1) data released from the Federal Reserve which is released quarterly. Although EconCurrents can validate the data, in general, using other sources, micro-movements are difficult to validate. Importantly, the Z.1 data is a treasure chest of aggregated data across all sectors of the economy – and an invaluable tool in evaluating historical relationships.
To begin, one needs to define Joe Sixpack. Urban dictionary defines Joe:
Average American moron, IQ 60, drinking beer, watching baseball and CNN, and believes everything his President says.
Too many of us think we are smarter than Joe – and are above Joe in the social order. But many of us are Joe. Per Wikipedia:
John Q. Public (and several similar names; see the Variations section below) is a generic name in the United States to denote a hypothetical member of society deemed a “common man.” He is presumed to represent the randomly selected “man on the street.” Similar terms include John Q. Citizen and John Q. Taxpayer, or Jane Q. Public, Jane Q. Citizen, and Jane Q. Taxpayer for a woman. The name John Doe is used in a similar manner. For multiple people, Tom, Dick and Harry is often used. Roughly equivalent are the names Joe Six-pack, Joe Blow, the nowadays less popular Joe Doakes and Joe Shmoe ….
Note: The Z.1 data is based on averages not medians. In other words, the rich are getting richer – and this influences the averages.