In previous posts on this topic,1,2,3 we have looked at the historical records of inflation and deficit spending by the U.S. federal government. The changing dates for the government’s fiscal year over the country’s history confounded the correlation analysis of that data. Since 1913, U.S. inflation data has been recorded monthly. In this post, we will use the data since 1913 to align the timelines of the two variables.

Credit: Foto-RaBe4 from Pixabay
Introduction
From 1842 to 1976, the U.S. government fiscal year started on July 1 of the prior year and ended on June 30 of the fiscal year. This means that inflation data for the calendar year is six months later than government spending for the same nominal year. Before 1913, inflation data was only available annually (calendar year), so coincident measurement of government spending and inflation is impossible starting in 1842 and up to 1913. For the same reasons, inflation one year following government spending cannot be calculated. Correlations can only be determined with six-month lagging inflation and then again after 18 months have passed.
Starting in 1977, the federal government switched the fiscal year to start October 1 of the previous year and end September 30 of the fiscal year. Thus calendar year inflation data covered months with a 3-month lag to the government spending.
The coincidence, leads, and lags for government spending vs. inflation can be better represented after 2013 because monthly Consumer Price Inflation Index (CPI) values enable inflation “years” to be calculated aligned with government spending. Also, lead and lag calculations for the two variables can be calculated for any desired interval in months.
Data
Inflation
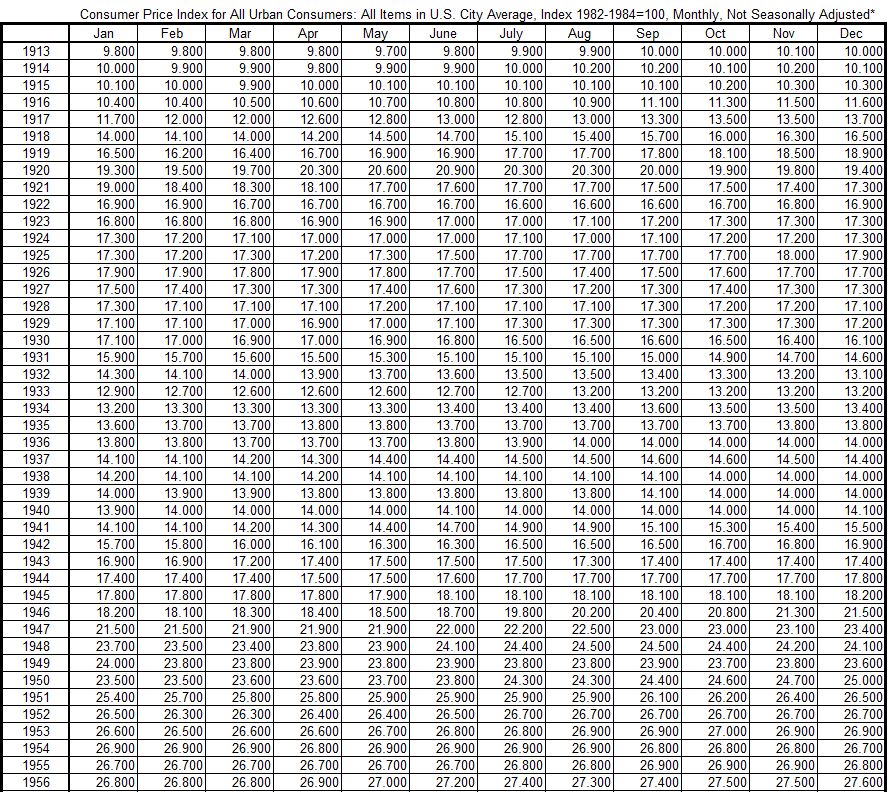
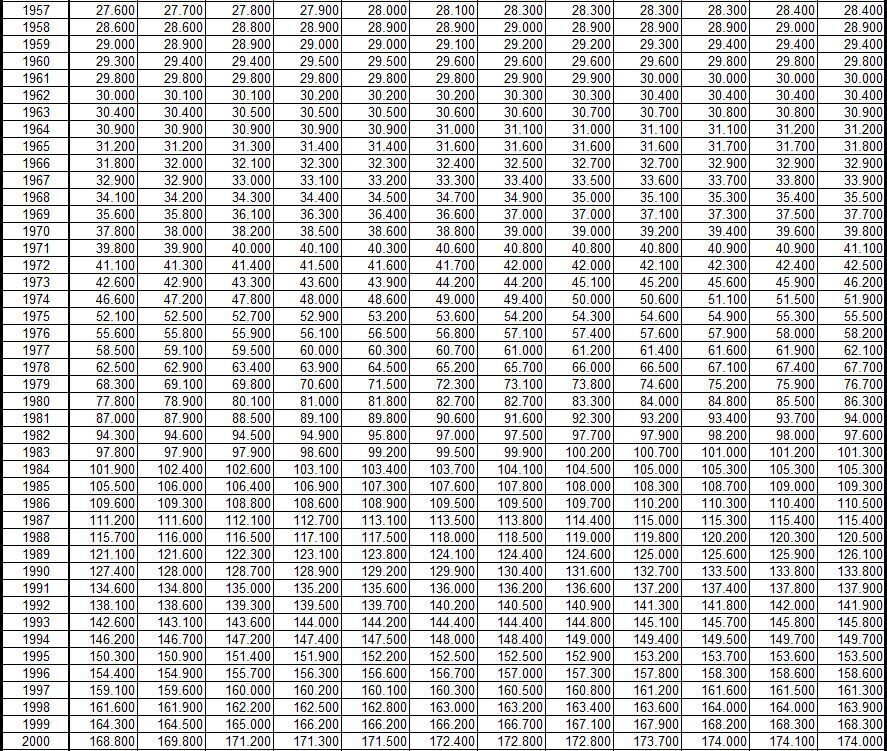
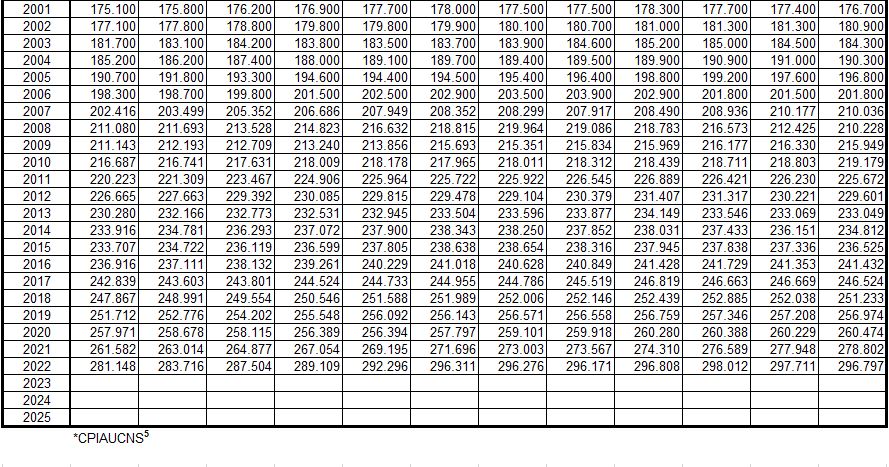
The data used to calculate inflation in this post is given in Table 1. This data is from the Fed data base CPIAUCNS5.
Table 1. Consumer Price Index (CPI) Values, Monthly 1913-2022
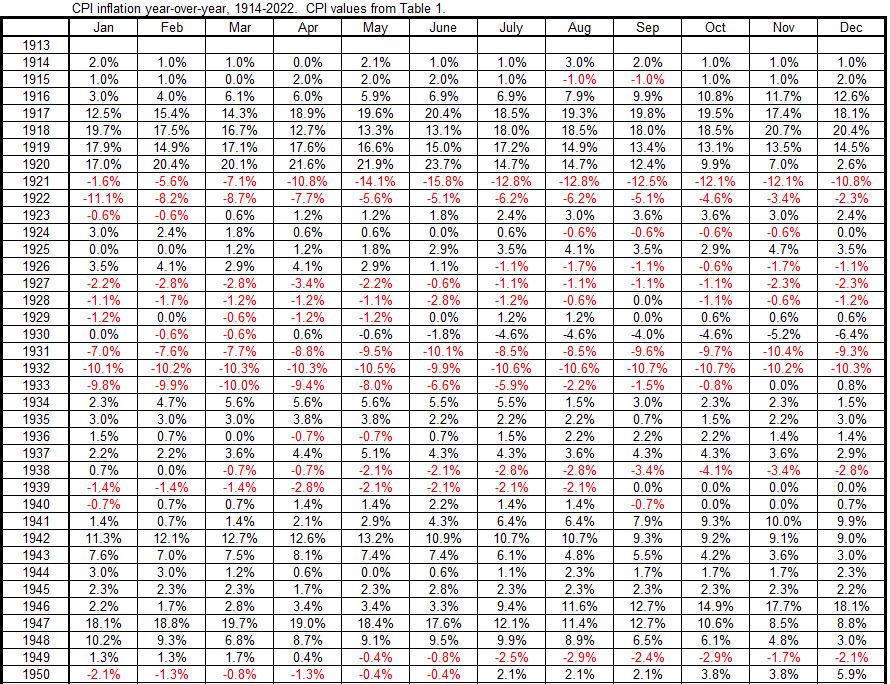
The index values are used to calculate the 12-month inflation using the formula
Inflation Rate (Month, Year) = {(Index (Month, Year) – Index (Month, Year-1)}/Index (Month, Year-1)
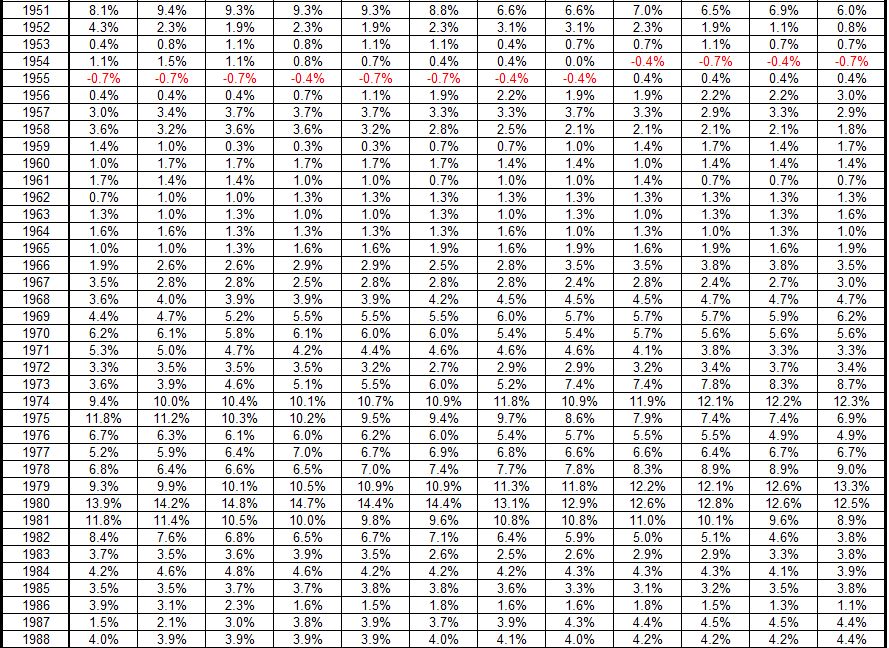
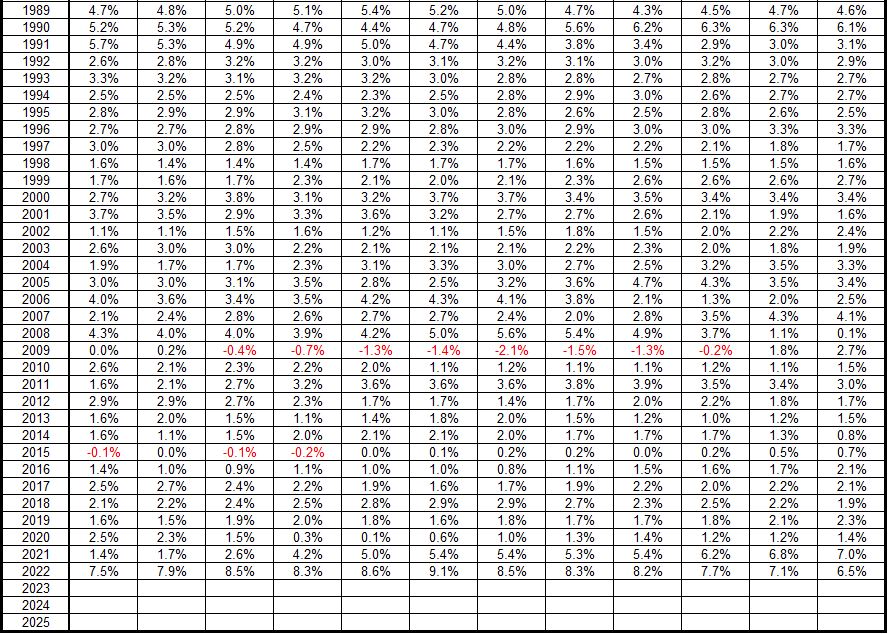
This formula is used to calculate the year-over-year inflation rate for any month in any year. These are shown in Table 2.
Table 2. Year-over-Year Inflation (CPI), Monthly 1914-2022
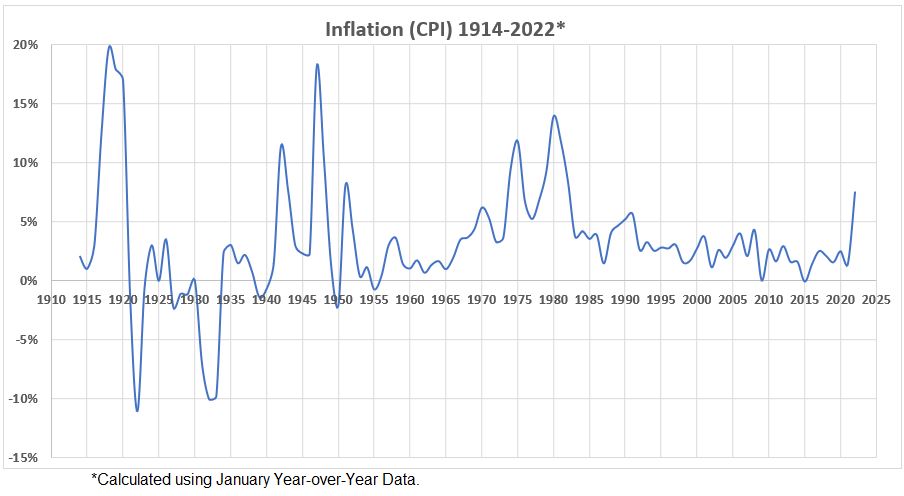
In Figure 1 the CPI inflation data from 2014 through 2022 is shown using year-over-year data for one month (January). This is the same as the calendar year inflation used previously.1,2,3
Figure 1. Annual Inflation (CPI) 1914-2022
If an inflation accounting year different from the calendar year were chosen, the graphic would be different. The differences for some months show significant differences in many years. This can be seen in Figure 2 where the 12 possible calendar year selections possible are shown.
Figure 2. Annual Inflation (CPI) 1914-2022*
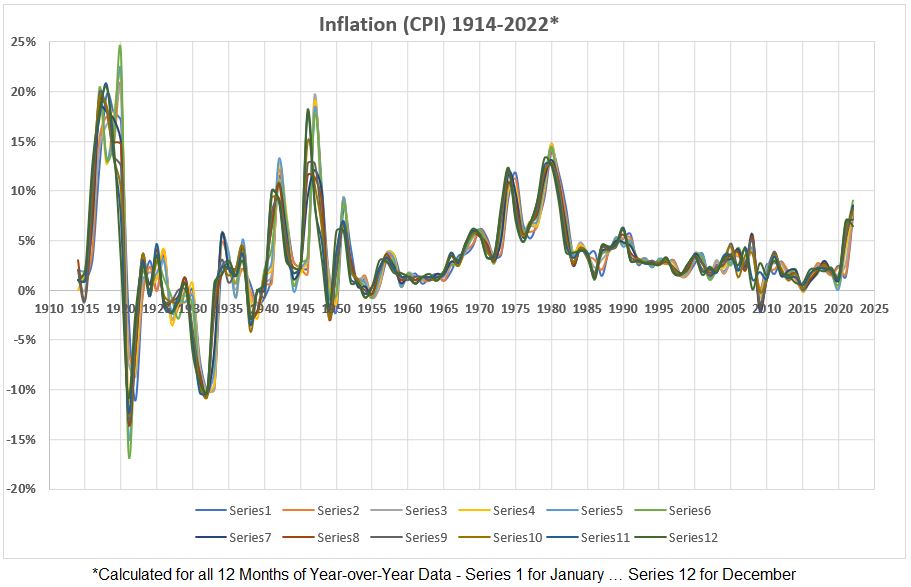
There are noticable variations in the inflation plots depending on which month of the year data is used. This is information that is not resolved when a single month is selected to measure year-over-year inflation rates.
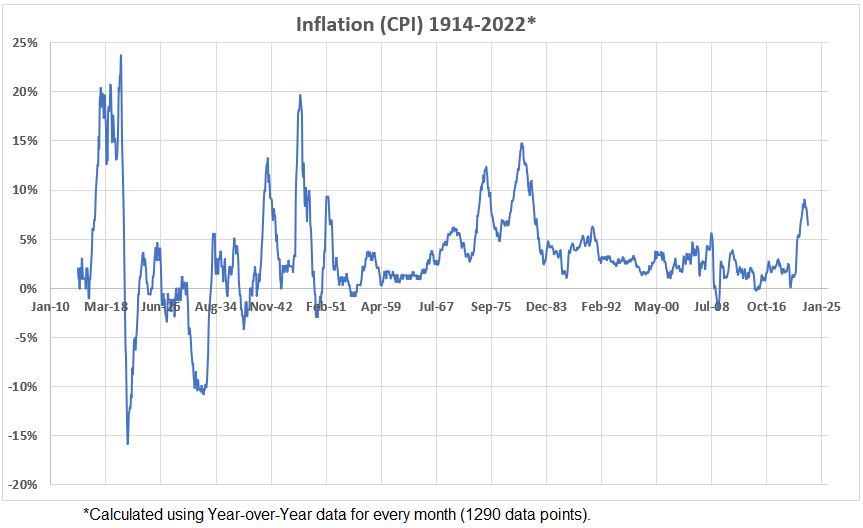
The amount of information lost when year-over-year data using annual data compared to using monthly data is perhaps more evident in Figure 3. There the 1296 data points are plotted for year-over-year data for every month in the 108 years covered. Compare Figure 3 to Figure 1 which has only the 108 data points for annual data.
Figure 3. Annual Inflation (CPI) 1914-2022*
The reason for pointing out the increased amount of information available when monthly year-over-year data is used is to explain why looking at leads and lags of only a few month between government spending and inflation may be a worthwhile effort. If there are actual changes in correlation, following the monthly variations in inflation could be informative. An even better resolution of correlations would be obtained if the spending was known month by month. But trying to determine that is not considered achievable with much accuracy.
Added note: If the three-month moving average is used for a plot like Figure 3, the graph in Figure 4 is obtained.
Figure 4. Annual Inflation (CPI) – 3-Month Moving Average 1914-2022*
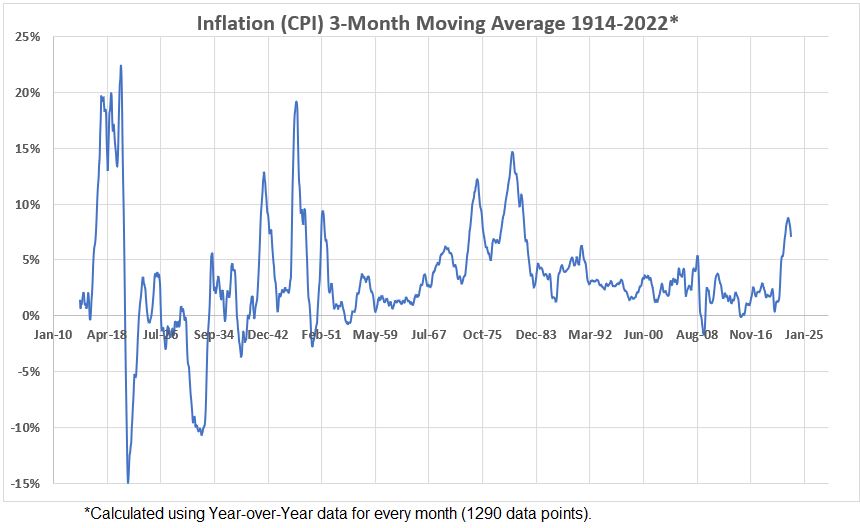
With the month-to-month jitter reduced, the form of the inflation plot is unchanged except for increased sharpness. This shows that one can use the three-month moving average data interchangably with monthly data for trend analysis.
The Transition Quarter 1976
The change of the fiscal year from July 1-June 30 to October 1-September 30 created what was called the transition quarter. July 1 to September 30, 1976. For accounting purposes, the transition quarter was added to the 1976 fiscal year.6 Therefore the data for inflation must be modified to reflect the same calendar adjustment, using the inflation data for a 15-month year in 1976. Note: this was not done previously.1,2,3
The adjustment for correlation calculations changes the 6.0% y-o-y inflation for June, 1976 in Table 2, to 7.5%. This was calculated using the data in Table 1:
Inflation Rate (June, 1976) = {(Index (Sept, 1976) – Index (June, 1975)}/Index (June, 1975)
= {57.600 – 53.000} / 53.000 = 0.0746
Federal Deficits
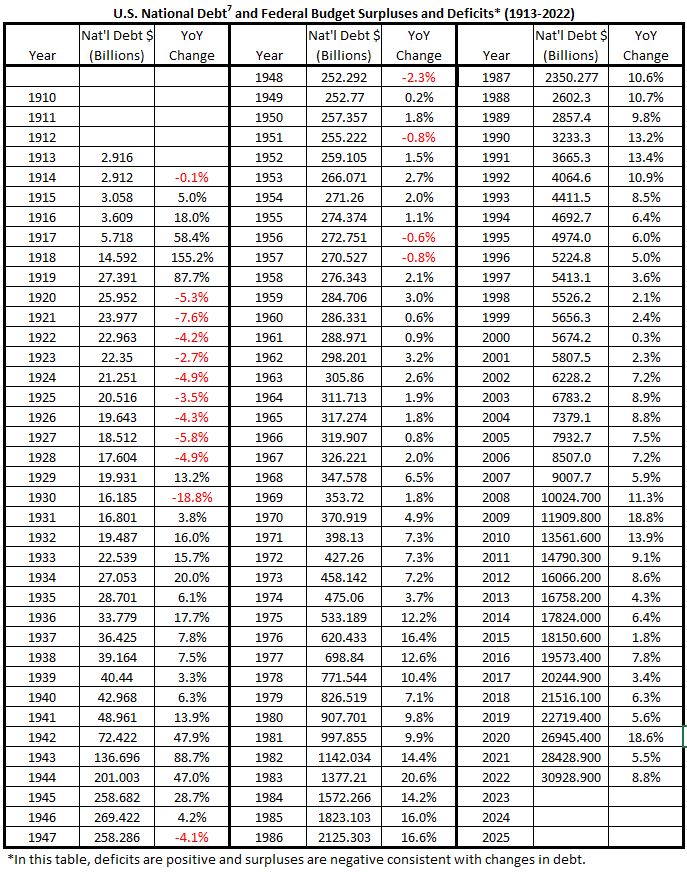
The data used for federal deficits is derived from the Historical Debt Outstanding table,7 published by the U.S. Department of the Treasury. The debt data and the derived deficits and surpluses are shown in Table 3.
Table 3. U.S. National Debt and Federal Budget Balances (1913-2022)
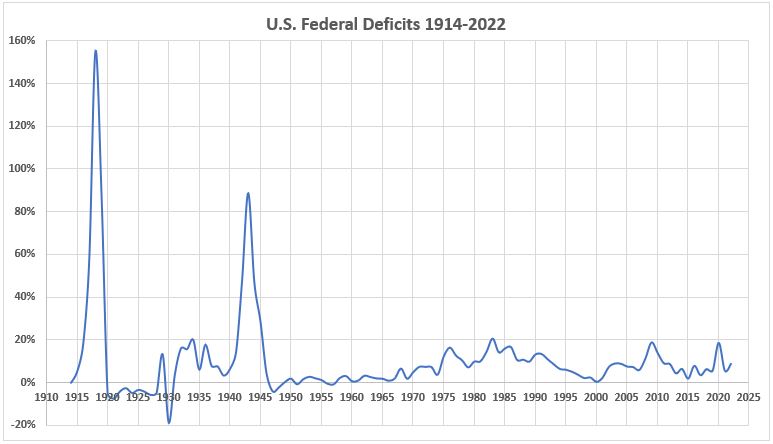
The federal deficits (and surpluses) are plotted in Figure 5.
Figure 5.
Analysis
For an overview, annual federal deficits from Figure 5 and annual inflation rates are shown together in Figure 6. The annual inflation rates are extracted from Table 2 in a manner that calculates inflation for each fiscal year. Thus, for the years 1914-1975, the annual inflation rates are taken from the June column, the final month of those fiscal years. For 1977-2022, the annual inflationrates are taken from the September column, the final month of those fiscal years. As discussed in the preceeding section (Data), the fiscal year 1976 is expanded to include the transition quarter and the “annual” inflation rate for that year is 7.5%, covering the interval July 1, 1975 to September 30, 1976.
Figure 6. Federal Spending and Inflation for the Fiscal Years 1914-2022
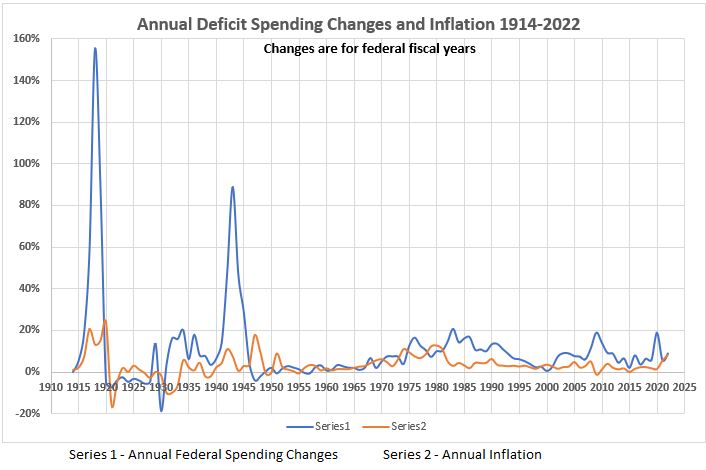
The very high deficit spending associated with the two world wars result in a compressed graphic for the years following. For that reason, another graph (Figure 7) has been prepared for the 75 years 1947-2022.
Figure 7. Federal Spending and Inflation for the Fiscal Years 1947-2022
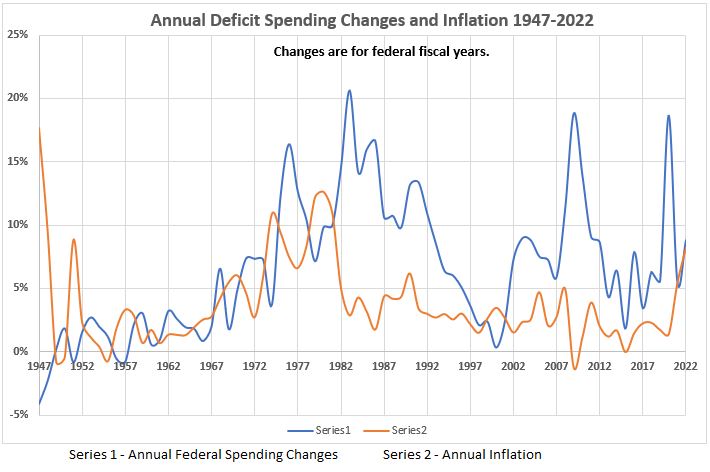
Figure 7 shows that there is no clear correlation pattern for deficit spending and inflation. There are times when both move in the same direction and times when the directions are opposed. There are times when maxima in deficit spending and minima in inflation are well aligned (eg, 1951, the 1980s, 2000, 2009, and 2020). Although there are no examples of two maxima or minima exactly aligned, there are times when they are offset but close together (eg. 1950s, 1960s, 1990, and early 2000s).
In order to see what information can be extracted from this data, we will return to analysis of the time variation process that has been explored previously.2,3 This will be reported next week.
One final note on the new timeline alignment of inflation data with the government spending fiscal year.
Table 4. Comparison of Long Period Correlations Between Inflation Data Organized by Calendar Year and by Federal Budget Fiscal Year
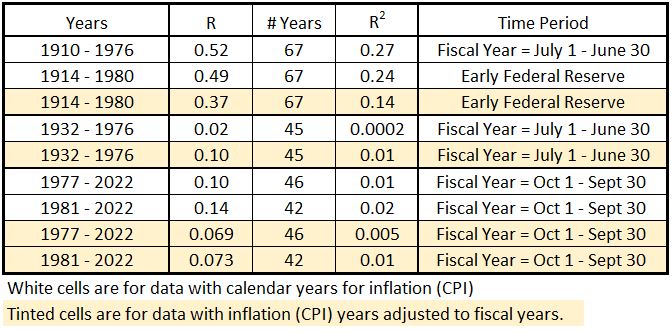
The comparison of the correlations over long periods of years shows that there are differences when the change is made to align the inflation ‘years’ to the corresponding federal fiscal years. Thus, we can anticipate seeing differences when we compare the data to be reported next week to the lead and lag results obtained previously.3
Conclusion
The organization of inflation data to align with the federal government fiscal years shows the following:
- The change from calendar years to the correct corresponding fiscal years yields changes in the long-period correlations. Some changes are relatively minor and other changes seem more significant.
- The graphs containing both annual federal spending and the concurrent inflation over the years 1914 to 2022 show a variety of positive, partial, and negative correlations.
- The implication of what we have seen thus far is that the relationship between government spending and inflation is likely to vary considerably over time.
We will dig deeper into this next week when we examine how leads and lags may occur between the two variables being studied.
Footnotes
1. Lounsbury, John, “Government Spending and Inflation. Part 1, Expanded”, EconCurrents, February 15, 2023. https://econcurrents.com/2023/02/11/government-spending-and-inflation-part-1-expanded/
2. Lounsbury, John, “Government Spending and Inflation. Part 2”, EconCurrents, February 19, 2023. https://econcurrents.com/2023/02/19/government-spending-and-inflation-part-2/
3. Lounsbury, John, “Government Spending and Inflation. Part 3”, EconCurrents, February 26, 2023. https://econcurrents.com/2023/02/26/government-spending-and-inflation-part-3/
4. Berns, R, Foto-Rabe, Kevelaer, North Rhine-Westphalia, Deutschland. https://pixabay.com/users/foto-rabe-715168/. Caption image via Pixabay. https://pixabay.com/photos/money-burn-dollar-waste-finance-4418858/.
5. Federal Reserve Economic Data, Consumer Price Index for All Urban Consumers: All Items in U.S. City Average, Index 1982-1984=100, Monthly, Not Seasonally Adjusted, https://fred.stlouisfed.org/graph/?id=CPIAUCNS,.
6. The Department of the Treasury, Document No. 3269, COMBINED STATEMENT OF RECEIPTS, EXPENDITURES AND BALANCES OF THE UNITED STATES GOVERNMENT FOR THE FISCAL YEAR ENDED JUNE 30, 1976 AND THE TRANSITION QUARTER ENDED SEPTEMBER 30, 1976, Stock Number 048 — 008 — 00011 — 9, Catalog Number T63. 113;975, https://www.govinfo.gov/content/pkg/GOVPUB-T63-aa06fae6dd8e856a4126668c7662a25d/pdf/GOVPUB-T63-aa06fae6dd8e856a4126668c7662a25d.pdf.
7. U.S. Department of the Treasury, Historical Debt Outstanding, Last update October 4, 2022.
https://fiscaldata.treasury.gov/datasets/historical-debt-outstanding/historical-debt-outstanding
Pingback: Government Spending and Inflation. Part 5 - EconCurrents
Pingback: Government Spending and Inflation. Part 6 - EconCurrents
Pingback: Government Spending and Inflation. Part 10 - EconCurrents
Pingback: Government Spending and Inflation. Part 11 - EconCurrents