This post will address how data sampling affects the analysis results for correlations between U.S. deficit spending and inflation. In Part 11of this series, it was seen that there is significant variability in this correlation over time. It is essential to know whether that variability is affected by changing the data sampling structure. If changes are connected to data treatment, care must be taken to ensure conclusions are fundamental to the overall data and not an artifact of how it is organized.

Image credit: Gerd Altmann from Pixabay2
Introduction
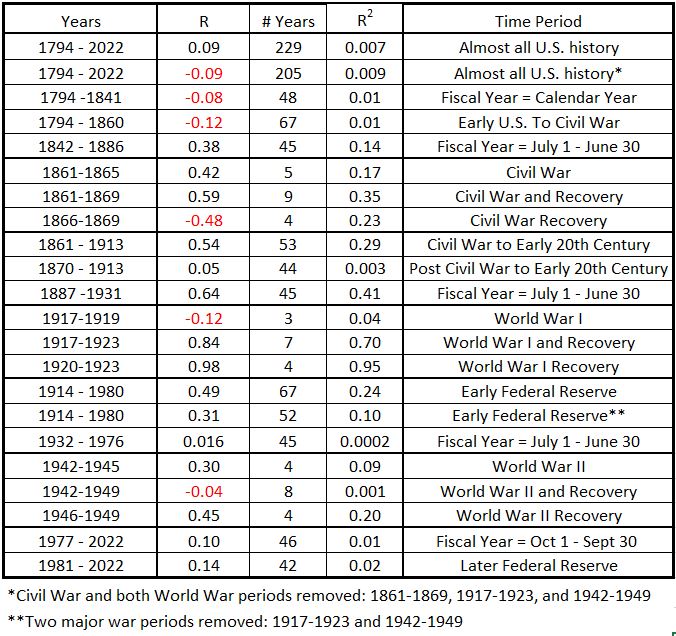
Previously1 we showed that the correlation between deficit spending and inflation varied over selected time periods. Those results are displayed in Table 1. This array of results shows no overall conclusion about the correlation between deficits and inflation.
Table 1. Correlation between U.S. Federal Deficits and Inflation, various selected time periods1
In Part 11, we used a 10-year rolling average (also called a moving average) to show an example of how the correlation between federal deficits and inflation varied systematically over time. That graphic (see Figure 4 below) showed a dramatic series of swings between negative correlation and positive correlation over time. But just how suitable was the 10-year averaging choice?
A rolling average is used to dampen “noise” and make trends more apparent. But the question must always be asked: What is noise and what is useful data? We will return to that question after examining how the data we have behaves under various rolling average regimes.
Change Number of Years in Rolling Average
The use of rolling avaerages has been applied for eight regimes, ranging from a 20-year rolling average down to a 3-year rolling average. The results are shown in Figure 1 through Figure 8.
Figure 1. U.S. Federal Deficits and Inflation – 20-year Rolling Correlations
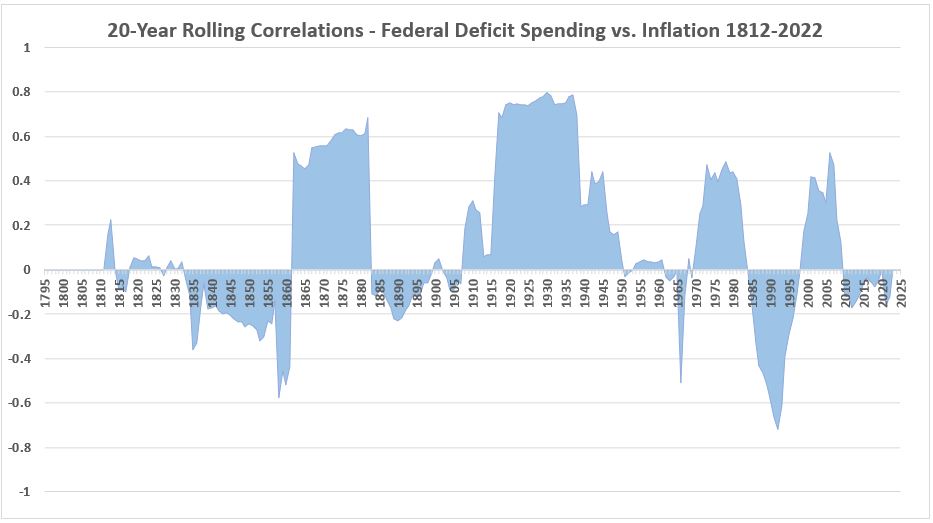
Figure 2. U.S. Federal Deficits and Inflation – 15-year Rolling Correlations
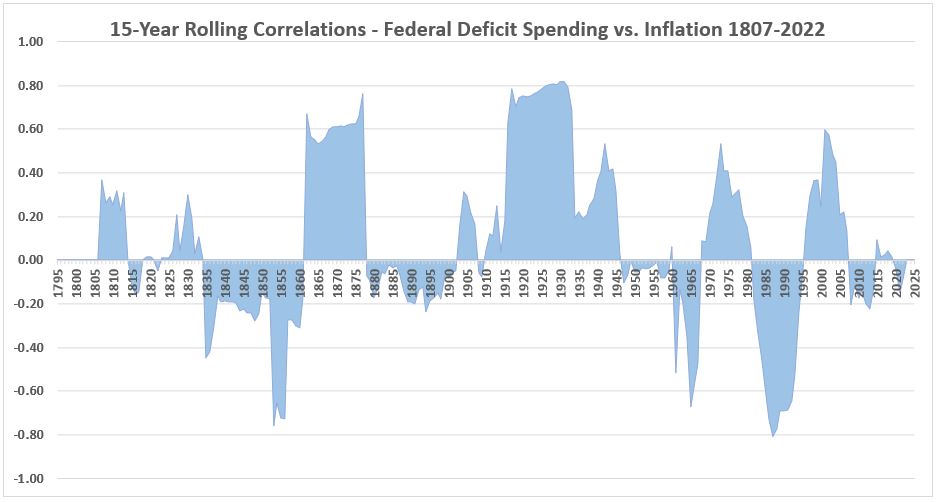
Figure 3. U.S. Federal Deficits and Inflation – 12-year Rolling Correlations
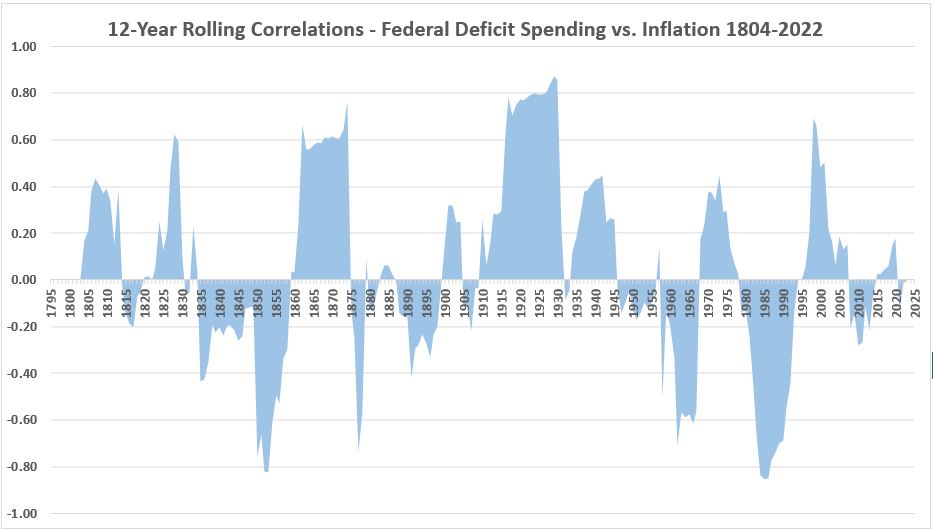
Figure 4. U.S. Federal Deficits and Inflation – 10-year Rolling Correlations*
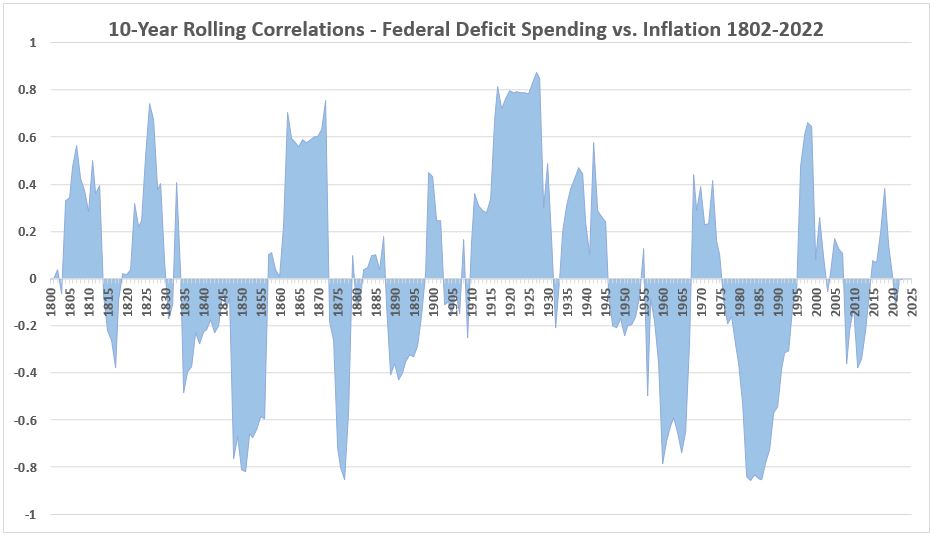 *This chart was Figure 2 in Part 11.
Figure 5. U.S. Federal Deficits and Inflation – 8-year Rolling Correlations
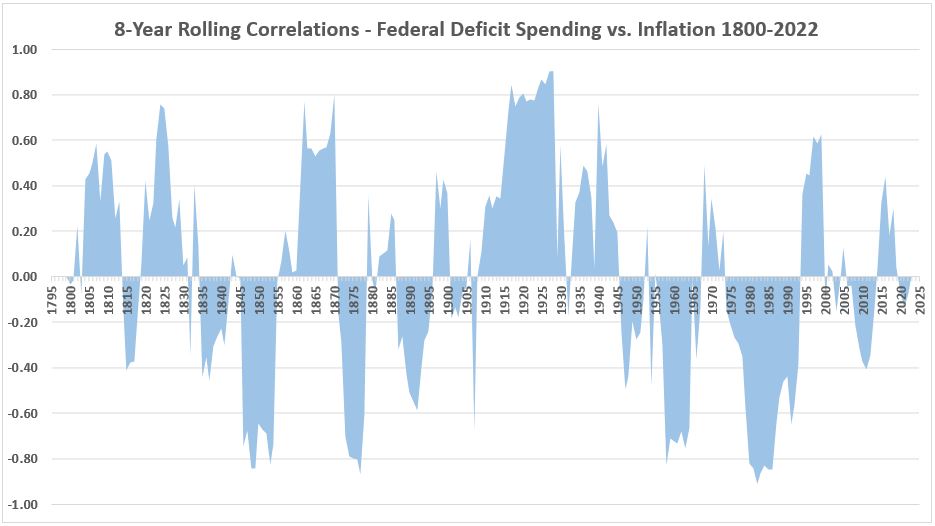
Figure 6. U.S. Federal Deficits and Inflation – 7-year Rolling Correlations
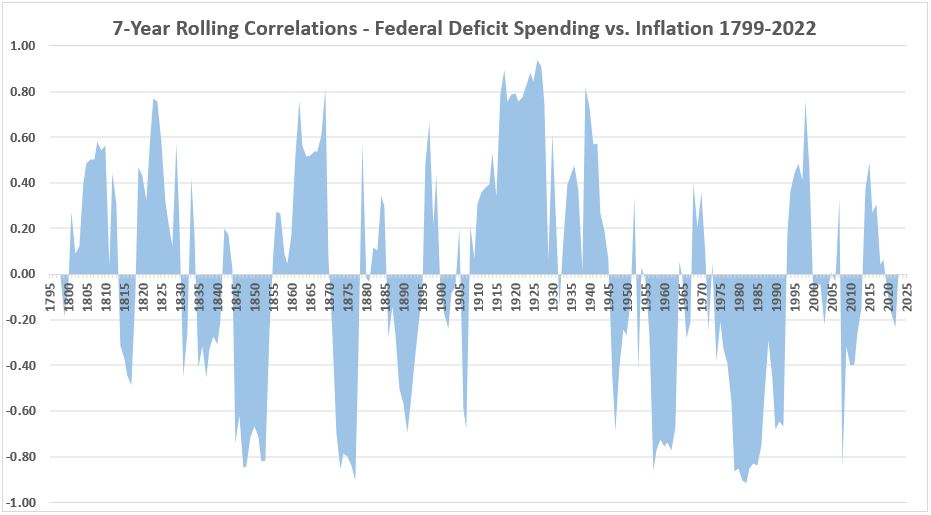
Figure 7. U.S. Federal Deficits and Inflation – 5-year Rolling Correlations
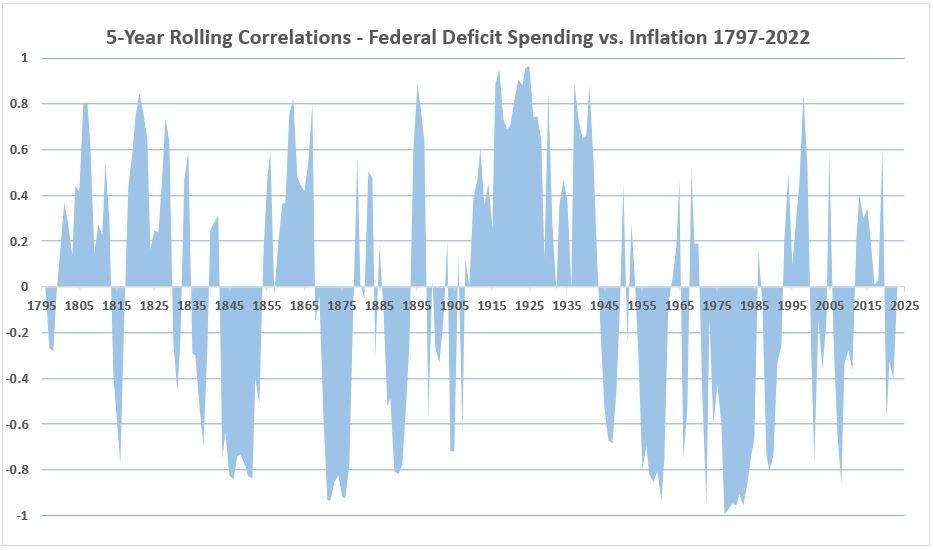
Figure 8. U.S. Federal Deficits and Inflation – 3-year Rolling Correlations
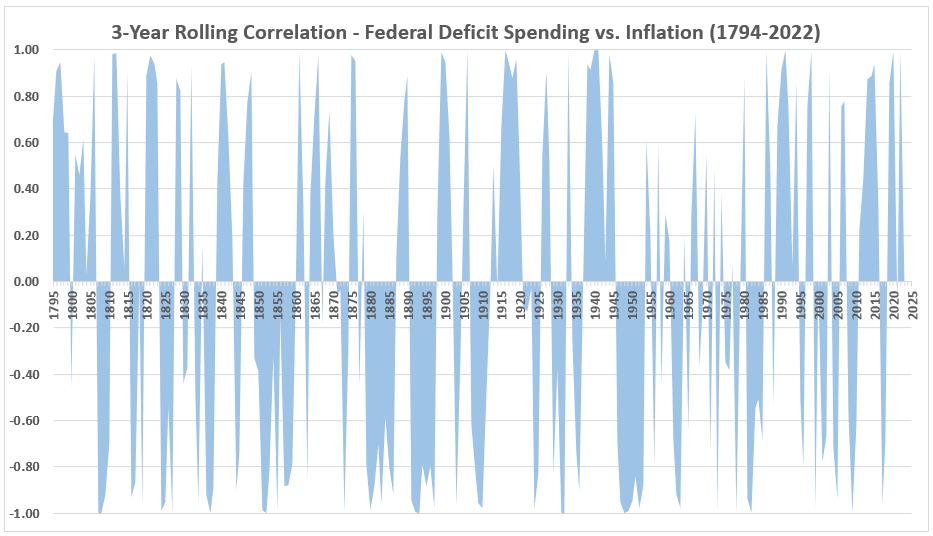
The amount of structure in the graphs clearly increases as the rolling average period becomes shorter. There is not a good case to be made at this point that this “smoothing” process is removing only noise. It remains to be seen if further analysis can establish how meaningful these fluctuations are.
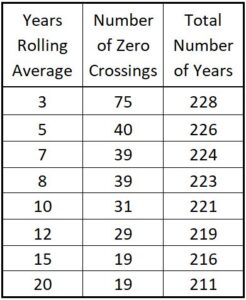
As a point of interest, Table 2 shows the number of zero-line crossings for the rolling avaerages.
Table 2. Number of Zero-line Crossings for Rolling Averages for Deficit – Inflation Correlations
Hypothesis: There is a high probability that meaningful data may be “smoothed out” by the rolling average process. The data that may be hidden in the averaging process could be some of the most interesting for the purposes of understanding the possible interactions between government deficit spending and inflation.
Conclusion
The correlations between U.S. government deficit spending and inflation that we have seen so far are puzzling in the following ways:
-
- There are time periods when there are significant positive correlations and others with significant negative correlations.
- There are at least 157 years where the correlation may be less significant (inferred from Figure 8, years where |R|<0.5).
- The interesting correlation relationships for immediate possible effects (within 1-2 years) cannot be seen in what we have done so far.
Further work on this project will look at what factors might be affecting each of these different correlation periods. That will come after we follow some other leads.
The next activity will look at how we might examine the correlations between deficit spending and inflation over time frames of months and one to two years. I hope to have a report on that next week.
Footnotes
1. Lounsbury, John, “Government Spending and Inflation. Part 1, Expanded”, EconCurrents, February 15, 2023. https://econcurrents.com/2023/02/11/government-spending-and-inflation-part-1-expanded/
2. Altman, Gerd, Geralt, Freiberg, Duetschland. https://pixabay.com/users/geralt-9301/. Caption image via Pixabay. https://pixabay.com/illustrations/network-data-storage-4478146/.
Pingback: Government Spending and Inflation. Part 3 - EconCurrents
Pingback: Government Spending and Inflation. Part 5 - EconCurrents