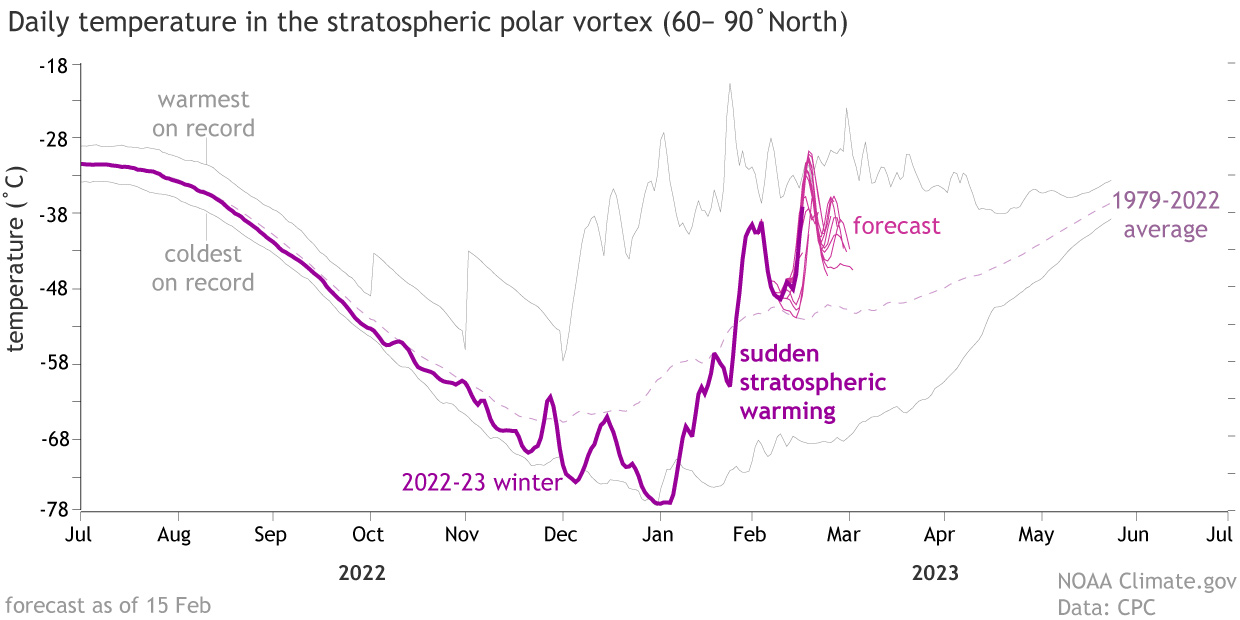
Updated at 3:05 p.m. EST February 17, 2023 to incorporate information on the latest Sudden Stratospheric Warming (SSW) event
On the third Thursday of the month right on schedule NOAA issued what I describe as their Four-Season Outlook. The information released also included the MId-Month Outlook for the single month of March plus the weather and drought outlook for the next three months. I present the information issued and try to add context to it. It is quite a challenge for NOAA to address the subsequent month, the subsequent three-month period as well as successive three-month periods for a year or a bit more.
It is very useful to read the excellent discussion that NOAA issues with this Seasonal Outlook. The CPC/IRI analysis suggests that ENSO will very soon return to Neutral with a La Nino bias and gradually transition to true Neutral, Neutral with an El Nino bias, and then solidly El Nino. Confidence in the first part of that sequence of transitions is higher than in the latter part of the sequence.

| The current weather report is always available at econcurrents.com To return to this article, hit the return arrow in the upper left-hand corner of your screen. |
| It is mentioned in the NOAA Discussion but there were not very definitive about the impact of yet another Sudden Stratospheric Warming (SSW) event probably because it is hard to forecast the impact of these events on the ground but HERE is a link to an article on this evolving event. It may be more of a February event than a March event but worth noting. |
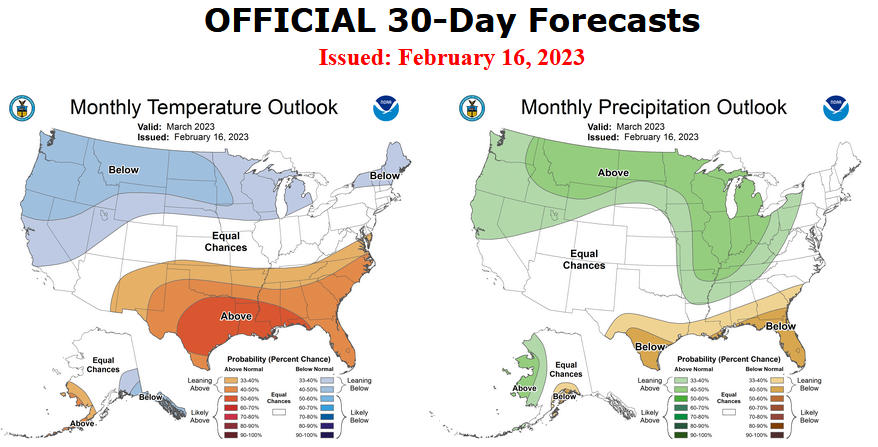
Now, Let’s Take a Look at the Mid-Month Outlook for March.
Combination Mid-Month Outlook for February and the Three-Month Outlook
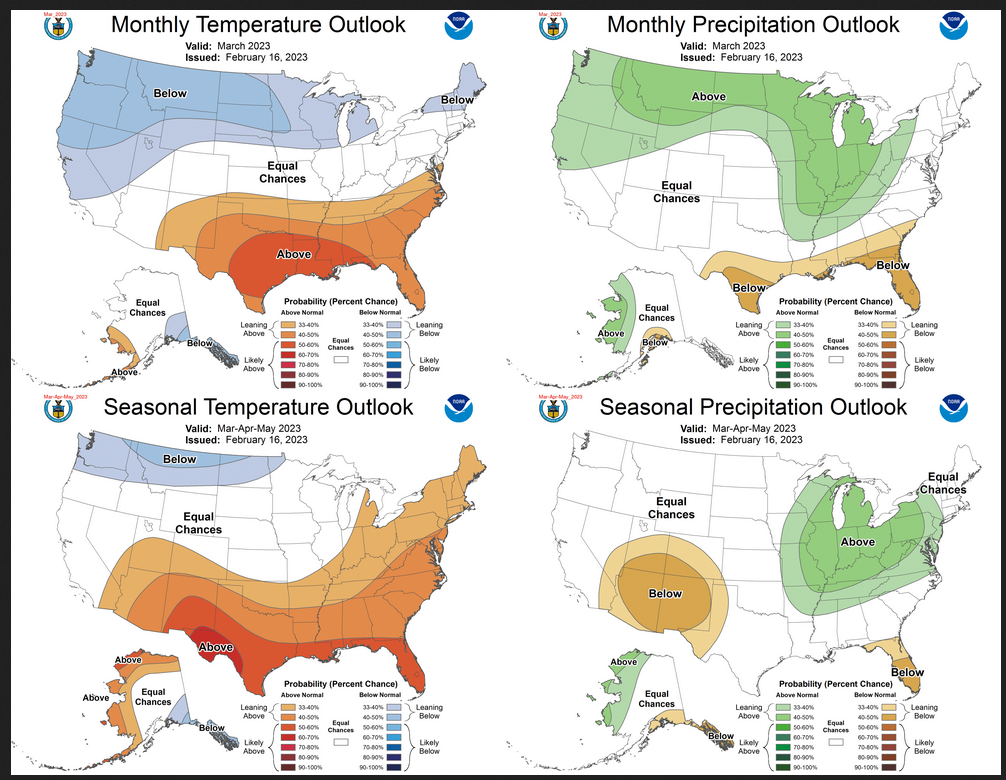
The top row is what is now so-called the Mid-Month Outlook for March which will be updated at the end of February. There is a temperature map and a precipitation map. The second row is a three-month outlook that includes March. I think the outlook maps are self-explanatory. What is important to remember is that they show deviations from the current definition of normal which is the period 1991 through 2020. So this is not a forecast of the absolute value of temperature or precipitation but the change from what is defined as normal or to use the technical term “climatology”.
| Notice that for precipitation, the March and three-month outlooks are quite similar. That is not the case for temperature. |
| For both temperature and precipitation, if you assume the colors in the maps are assigned correctly, it is a simple algebra equation to solve the month two/three anomaly probability for a given location = (3XThree-Month Probability – Month One Probability)/2*. So you can derive the month two/three outlook this way. You can do that calculation easily for where you live or for the entire map. |
Here are larger versions of the Temperature and Precipitation outlook maps for the single month of March.
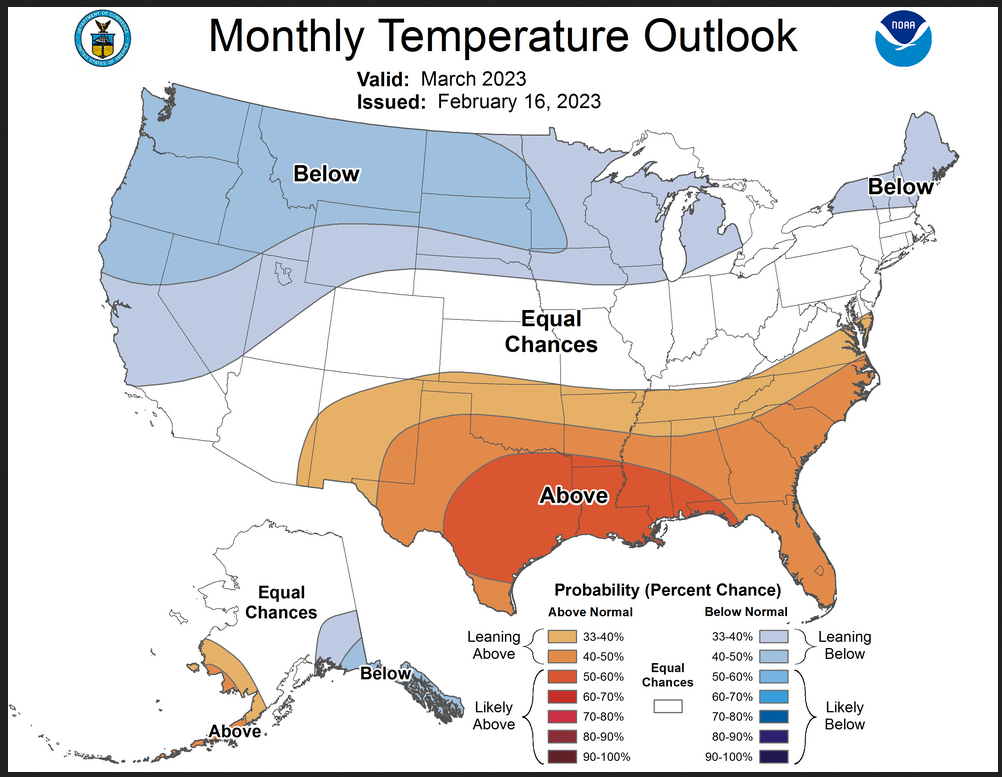
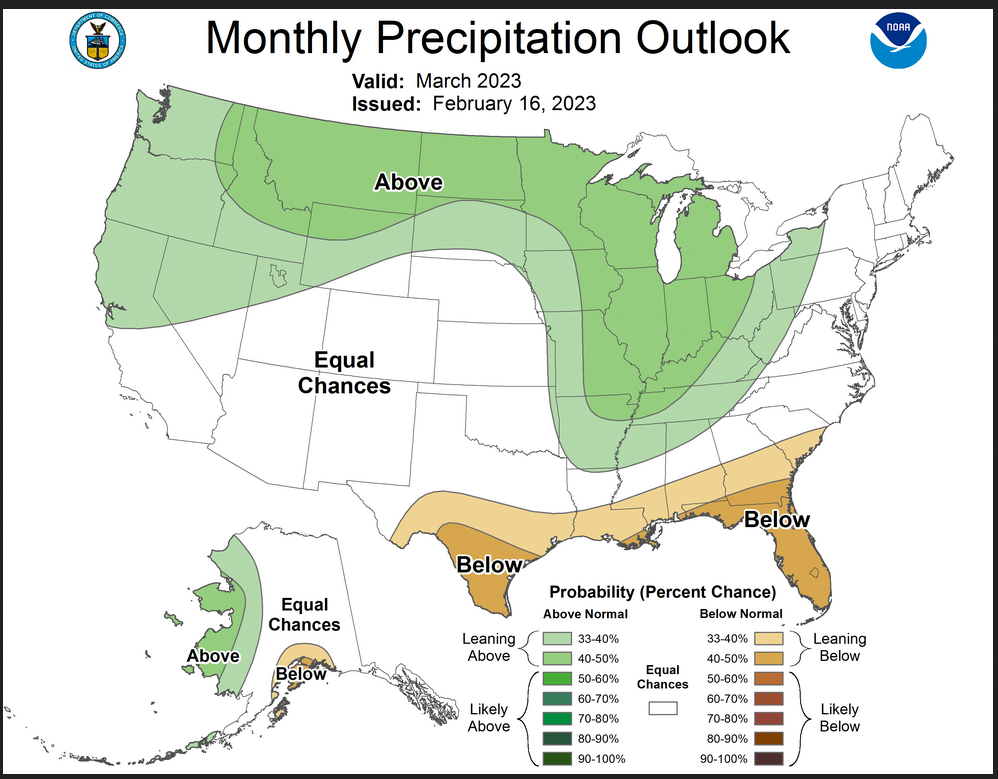
The maps are pretty clear in terms of the outlook.
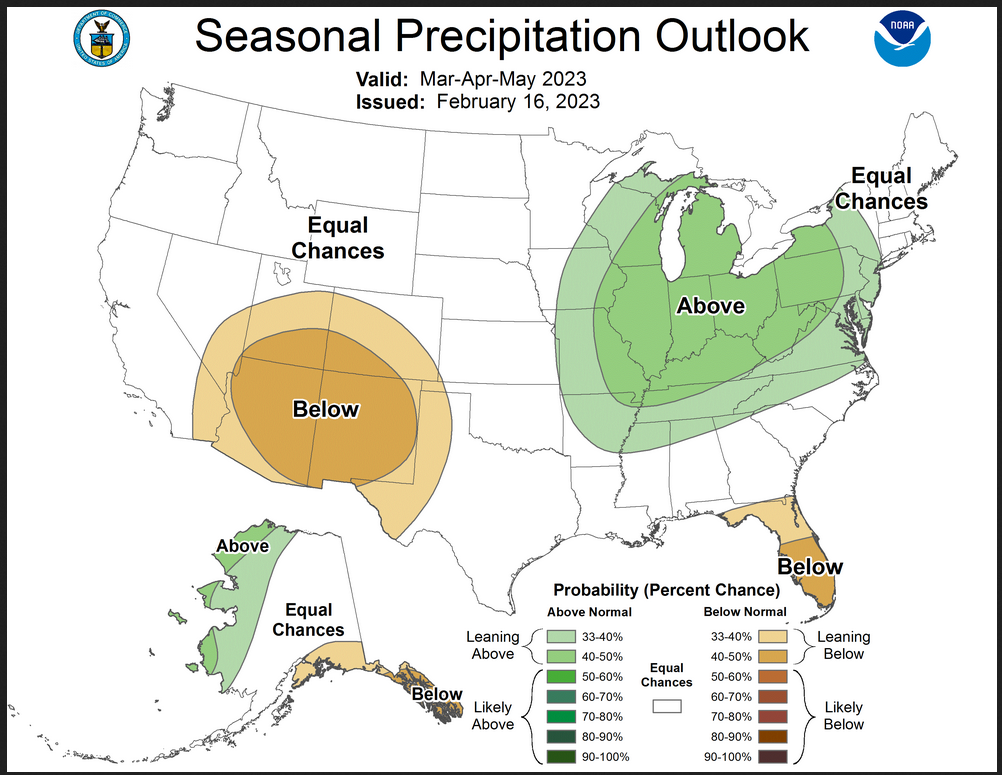
And here are large versions of the three-month MAM 2023 Outlook
First temperature followed by precipitation.
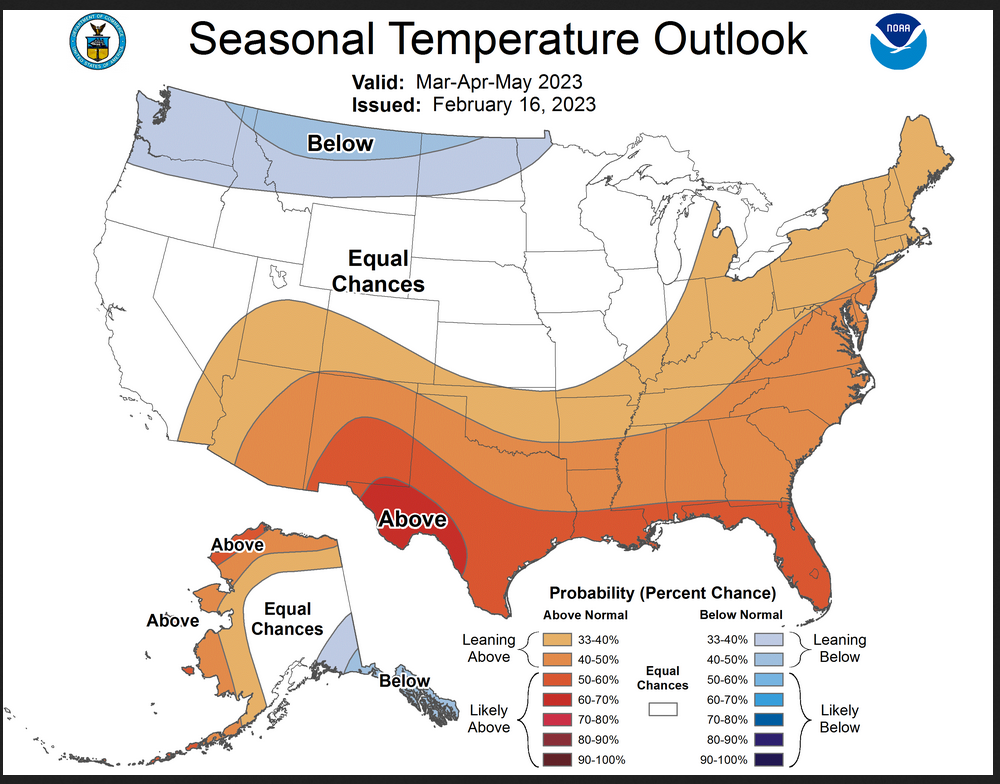
The maps are larger versions of what was shown in the first graphic that had smaller versions of all four of these maps.
Drought Outlook
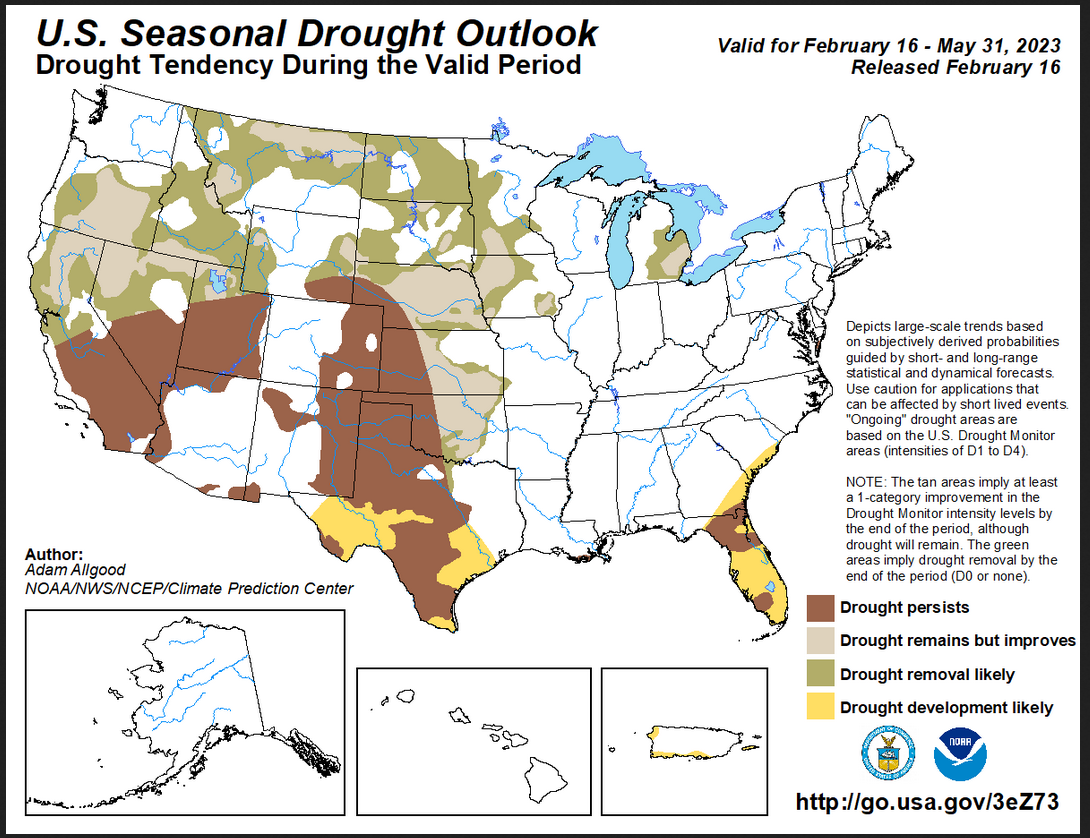
| The yellow is the bad news. And there is some of that. But the area with drought improvement is much larger. |
Short CPC Drought Discussion
Latest Seasonal Assessment – Since mid-January, a pattern change brought drier conditions to the West following a prolonged series of Pacific storms and atmospheric river events. Despite the drier conditions, snowmelt into streams, soils and reservoirs continued to improve drought conditions across portions of California, the Great Basin and central Rockies. Precipitation was more hit and miss across the northern Rockies and Northwest, resulting in a few areas of degradation. Further east, an active pattern promoted some drought relief to the central Corn Belt, the Florida Peninsula, and the South Atlantic, while dry and warm conditions prevailed across southern Texas and the Florida Peninsula, where drought conditions slowly expanded.
The Spring months are a transitional period for climatological precipitation, as the wet season across the West winds down and Gulf moisture begins penetrating further north and west across the lower Mississippi Valley and Great Plains. Spring storm systems can bring heavy precipitation to the Plains due to increased moisture availability, while melting snowpacks provide a source for soil moisture recharge ahead of the growing season. A drier climatology extends across the Southwest ahead of the summer monsoon, as well as Florida ahead of the seabreeze-driven wet season. During March – May 2023, La Niña conditions are favored to erode across the equatorial Pacific, which increases overall forecast uncertainty. Much above-normal snowpack conditions, coupled with wet short and medium range forecasts favor continued drought reductions across northern California and the Northwest, while drier conditions should promote drought persistence for the Southwest. Melting snows and increased climatological precipitation should provide opportunities for drought improvements across the Northern and Great Plains regions, with improvement chances more limited across the High Plains. The CPC seasonal outlook favors above-median precipitation for the Midwest and Great Lakes region, which should allow lingering drought areas to continue shrinking. While portions of the Northeast and Mid-Atlantic may be vulnerable to spring drought development due to below-average snow cover and recent dryness, short and medium range forecasts favor increased moisture. Additional drought development is likely across the Florida Peninsula, as a dry spring climatology will exacerbate drying soils and vegetation. Drought expansion is also favored across Texas as moisture deficits continue to increase.
No drought is indicated or forecasted to develop across Hawaii through May. Alaska is also drought free, and while the seasonal outlook indicates increased chances for below-average precipitation for the Panhandle region, current conditions are not dry enough to favor drought development ahead of the summer months. Increasingly dry conditions have prevailed across Puerto Rico, and an anticipated dry start to the spring favors slow drought development in areas already experiencing some impacts.
Looking out Four Seasons.
Twelve Temperature Maps. These are overlapping three-month maps (larger versions of these and other maps can be accessed HERE)
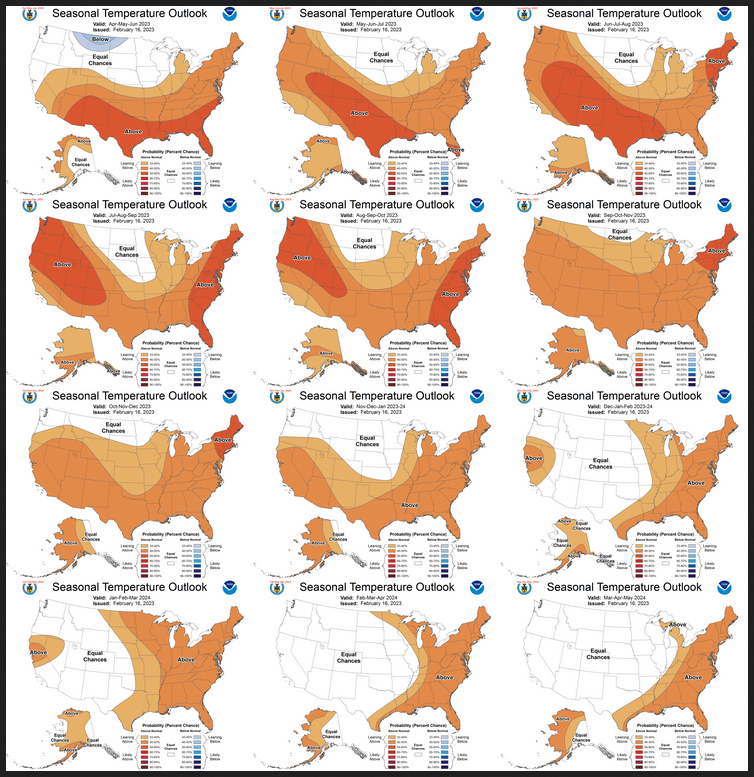
Notice that this presentation starts with April/May/June 2023 (AMJ since MAM is considered the near-term and is covered earlier in the presentation. The changes over time are generally discussed in the discussion but you can see the changes easier in the maps.
| You can see the major change in DJF 2023/2024 which starts a bit earlier but which is the same as in the seasonal outlook issued last month. It may not be described as such in the NOAA discussion below but it seems to be related to the evolution of the ENSO state to an El Nino winter. |
Comparing the new outlook with the prior Outlook,
The 12 temperature maps that were issued last month.
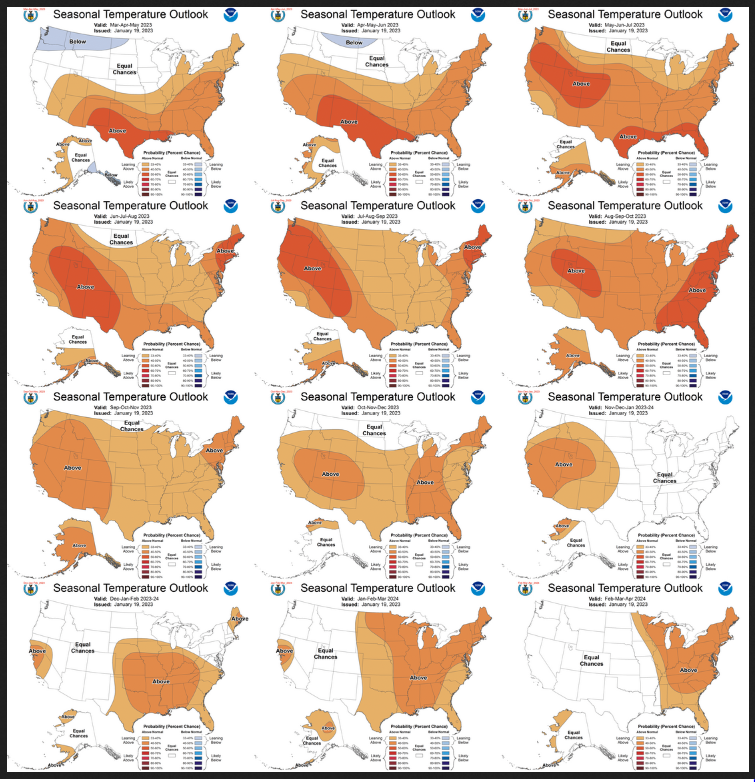
I have been showing the current set of outlooks with the prior set side by side. But I think the images are too small for most to be able to work with. I do the analysis so you do not need to but if you choose to do so the best way is to print out both maps. If you have a color printer that is great but not needed. What I do is number the images from last month 1 – 12 starting with “1” and going left to right and then dropping down one row. Then for the new set of images, I number them 2 – 13. That is because one image from last month in the upper left is now discarded and a new image on the lower right is added. Once you get used to it, it is not difficult. In theory, the changes are discussed in the NOAA discussion but I usually find more changes. It is not necessarily important. I try to identify the changes but believe it would make this article overly long to enumerate them. The information is here for anyone who wishes to examine the changes. I comment on some of the changes from the prior report by NOAA and general changes in the pattern.
| From MJJ through ASO the North Central is now shown to be EC rather than warmer than climatology. |
Now the Twelve New Precipitation Maps
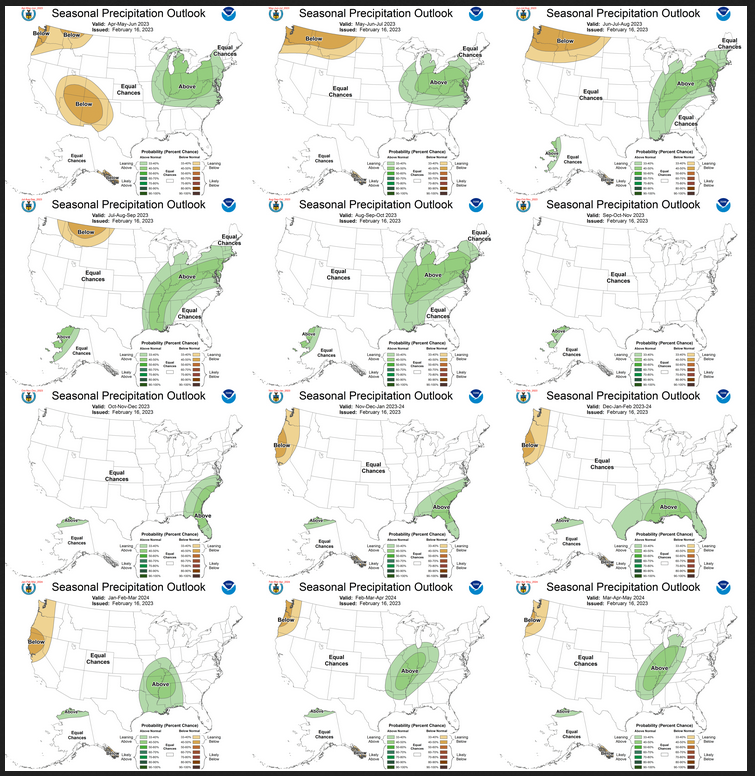
Similar to Temperature in terms of the organization of the twelve overlapping three-month outlooks.
| The change in the pattern is gradual so it is difficult to conclude how it meshes with the projected change in the ENSO state. It is a bit surprising that the Southwest is not shown as wetter if next winter is projected to be an El Nino winter. I believe that NOAA is hedging its bets because we are not yet beyond the Spring Prediction Barrier (SBP). Thus the confidence in the El Nino forecast is still low but I do not believe that this is addressed in the NOAA discussion. |
Comparing the new outlook with the prior Outlook,
The maps that were released last month.
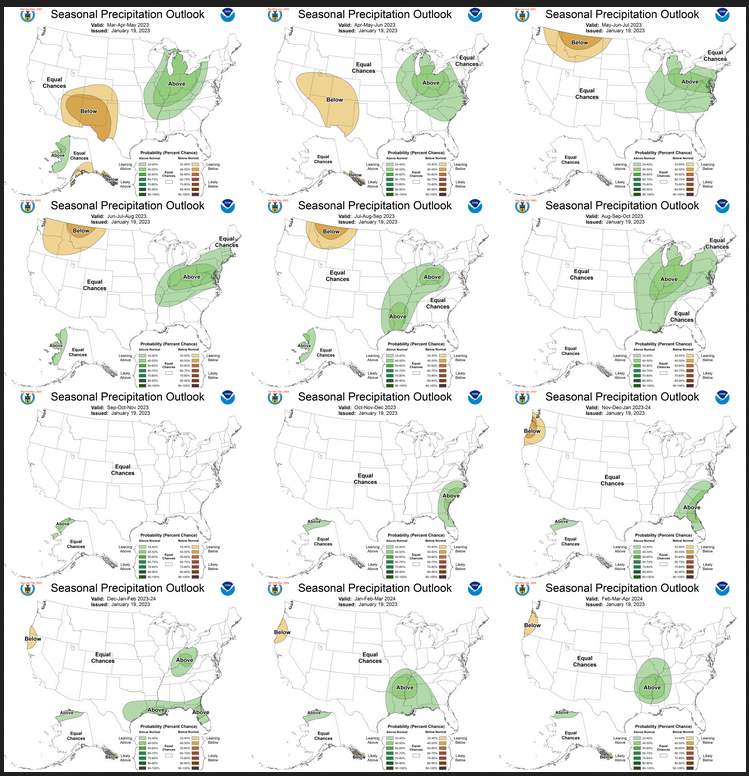
A good approach for doing this comparison is provided with the temperature discussion. In terms of comparisons, the downgrading of the Southwest Monsoon from stronger than normal to normal is significant.
| I do not see a lot of changes from last month. The downgrading of the Southwest Monsoon occurred with the Seasonal Outlook issued last month. |
NOAA Discussion
Maps tell a story but to really understand what is going you need to read the discussion. I combine the 30-day discussion with the long-term discussion and rearrange it a bit and add a few additional titles (where they are not all caps the titles are my additions). Readers may also wish to take a look at the article we published last week on the NOAA ENSO forecast. That can be accessed here.
I will use bold type to highlight some things that are especially important. My comments, if any, are enclosed in brackets [ ].
CURRENT ATMOSPHERIC AND OCEANIC CONDITIONS
Negative sea surface temperature (SST) anomalies continue but have weakened across the central and east-central Pacific Ocean. The most recent weekly Niño 3.4 region SST anomaly has weakened to -0.5 Celsius, approaching the canonical threshold for ENSO-neutral conditions. Subsurface ocean temperatures show the expansion of positive anomalies across the western and central Pacific Ocean at depth, with weaker negative anomalies near the surface. The integrated subsurface heat content anomaly of the equatorial Pacific Ocean, which has been strongly negative for six months, is now slightly positive.
Positive Outgoing Longwave Radiation (OLR) anomalies (suppressed convection and precipitation) continue over the equatorial west-central Pacific with negative OLR anomalies (enhanced convection and precipitation) over the Maritime Continent. Easterly wind anomalies near the surface persist over the western and central equatorial Pacific. Westerly wind anomalies persist aloft over the central and east-central Pacific. In summary, tropical ocean and atmosphere conditions show continued but weakening La Niña conditions.
SST anomalies are positive over the North Pacific and near the Aleutians. Positive SST anomalies, present earlier in the fall along the West Coast, have moderated to near average. Positive SST anomalies persist along the Gulf Coast and along the East Coast with the largest anomalies offshore of the Mid-Atlantic and New England.
PROGNOSTIC DISCUSSION OF SST FORECASTS
The CPC SST consolidation forecast for Niño 3.4 indicates decreasing negative anomalies through spring 2023 and into early summer, as a transition to ENSO-neutral conditions is predicted. The spread of statistical and dynamical model forecast inputs to the consolidation is narrow, with good agreement on a rapid decrease of negative SST anomalies in the next few months and emerging positive anomalies from summer into autumn. Bias-correction and skill-damping of anomalies by the consolidation reduces the median anomaly nearer to zero while slightly favoring El Niño (greater than +0.5 Celsius) over ENSO-neutral (between -0.5 C and +0.5C) in late autumn and next winter. The CPC official ENSO outlook indicates greater than a 90 percent chance of ENSO-neutral conditions in MAM, most likely ENSO-neutral conditions through MJJ, near equally likely ENSO-neutral and El Niño conditions in JJA, and more likely El Niño conditions in JJA and thereafter. [Editors note: it is not clear to me that the maps fully reflect a transition to El Nino. I would expect to see more changes in future months if confidence in the El Nino forecast increases as we pass through the Spring Prediction Barrier].
30-DAY OUTLOOK DISCUSSION FOR MARCH 2023
The March 2023 temperature and precipitation outlook is particularly challenging this year as an active, robust MJO and a nearly certain SSW [Editors Note: Sudden Stratospheric Warming] need to be considered when making the forecast, both of which to occur within a continued solid La Nina atmospheric base state. In addition to considering these physical drivers, current anomalous snow depth and both dynamical and statistical model forecast guidance is utilized in preparing the outlook.
Temperature
The March temperature outlook favors below-normal monthly mean temperatures for South Alaska including the Alaska Panhandle, much of the western CONUS eastward to the northern Plains, western Great Lakes and New England. Areas forecast for Alaska, much of the western U.S. and the northern Plains are supported by background La Nina conditions that continue to remain in place in the atmospheric circulation in the north Pacific Ocean and much of the North America. Even though equatorial Pacific negative SST anomalies continue to become less negative, the atmospheric response is likely to remain during much of the month of March.
Also, the MJO enhanced convective phase is currently located in the western Pacific as depicted by the RMM index and slightly further east with respect to anomalous velocity potential. Lagged MJO composites anchored to the current RMM phases 6-7 favor a pattern change to more consistent, phased troughing over the West coast and far western CONUS prior to and during early March. Odds for negative 500-hPa height anomalies and below-normal temperatures extended eastward across the remainder of the northern half of the CONUS are also elevated as a result of this evolution. Extended range and subseasonal range dynamical model guidance is generally consistent with this outcome.
Monthly model guidance from the NMME initialized at the start of February or earlier favor the canonical La Nina anomalous temperature pattern. If the MJO remains active, the second half of the month of March may see a return to constructively interfering ridging for the Southeast and areas just to the north and west (forced by La Nina and the MJO). Consequently above-normal monthly mean temperatures are favored in the outlook for the Southeast, Gulf coast and southern Plains. Highest odds are forecast from eastern Texas to the Florida Panhandle.
The eventual impact of the SSW for the U.S. is considerably uncertain. The fact that short term forecasts are in very good agreement that a SSW will occur in the next few days is enough to a slight degree further elevate chances for below-normal temperatures on its own most likely later in the month. The SSW and so weakening of the stratospheric polar vortex and more variable/meridional jet stream makes the potential for arctic air outbreaks in the northern hemisphere more likely in March. However, there is high uncertainty with SSW events whether impacts will significantly affect the troposphere (i.e. AO index) to a sufficient degree to impact the eventual observed anomalous temperature. Currently the GFS and ECMWF guidance does not have the warming impacting the surface through the start of March, but this could happen later in March. Moreover, even if so, it is not a certainty that any arctic air outbreaks primary center of action will be in the western hemisphere, rather it is possible to more strongly impact Asia or Europe.
Above-normal snow depth in some areas of the northern Plains also aid support for favored below-normal temperatures in this region. Above-normal temperatures are also favored for parts of southwest Alaska and the Aleutian Islands in part related to above-normal SSTs.
Precipitation
The March precipitation outlook favors above-normal monthly total precipitation amounts for northern California and the Pacific Northwest eastward across the northern Rockies, northern Plains, upper Midwest and southward to include the Ohio Valley and parts of the Mississippi and Tennessee Valley’s. Continuation of the potential influence by ongoing La Nina conditions and both statistical and dynamical model forecast guidance support the outlook in these areas. Also, the evolution of the MJO described above, should it occur, would tend, to first order, become additive to these forecast positive precipitation anomalies at times during March. Below-normal precipitation is most likely for the extreme Southeast and Gulf Coast as well as southern Texas.
For Alaska, La Nina conditions and to some degree forecast model guidance favors above-normal precipitation for the west coast of Alaska and below-normal precipitation for the south-central Alaska coast.
SUMMARY OF THE OUTLOOK FOR NON-TECHNICAL USERS (Focus on March through May)
Temperature
The March-April-May (MAM) 2023 temperature outlook favors below-normal temperatures from Washington and northern Oregon along the northern tier of the contiguous U.S. (CONUS) into the Northern Plains. Below-normal temperatures are also favored for southeastern Alaska. Above-normal temperatures are more likely for the southern and eastern CONUS along with western and northern Alaska.
Precipitation
The MAM 2023 precipitation outlook predicts elevated probabilities for above-normal precipitation for parts of western and northwestern Alaska, as well as for a large area of the Midwest and Mid-Atlantic, spanning from the Central Mississippi Valley to the Atlantic coast and from the central and eastern Great Lakes region to the Tennessee Valley. Below-normal precipitation is favored for the Southwest, eastern areas of the Great Basin, as well as parts of the central and southern Rockies. Below-normal precipitation is also favored for the southeastern coast of mainland Alaska and for the Alaska Panhandle.
Areas depicted in white are regions where climate signals are weak and uncertainty is high, such that there are equal chances (EC) for above-, near-or below-normal seasonal mean temperatures or total accumulated precipitation.
PROGNOSTIC TOOLS USED FOR U.S. TEMPERATURE AND PRECIPITATION OUTLOOKS
The temperature and precipitation outlooks for MAM 2023 were based on dynamical model guidance from the North American Multi-Model Ensemble (NMME), statistical tools, including the global SST-based Constructed Analog (CA) and Canonical Correlation Analysis (CCA), the experimental NMME Calibration, Bridging, and Merging (CBaM), climate impacts of ENSO, and decadal climate trends. The objective, historical skill-weighted consolidation was a major tool used in the outlooks, which includes the ENSO/OCN tool to predict the impacts of ENSO and decadal trends , probability anomaly correlation (PAC) calibrated NMME, the CCA, and the CA. Although a transition to ENSO-neutral is expected by the first seasonal leads, La Niña impacts contribute to the temperature and precipitation patterns during MAM as the atmospheric response to La Niña is expected to continue into the start of the period. Land surface conditions, including persistent dry soil moisture heading into the spring for the central to southern Great Plains and positive anomalies in snowpack across the western CONUS played a role in the temperature outlooks through spring. Decadal climate trends were considered for all leads, but are the primary factor in the outlooks from the summer 2023 through the final lead (MAM 2024). Consistency between the precipitation outlooks and potential [Editor’s Note: Notice the use of the word “potential”] El Niño impacts were considered in the outlooks for autumn 2023 and next winter.
PROGNOSTIC DISCUSSION OF OUTLOOKS – MAM 2023 TO MAM 2024
TEMPERATURE
Elevated probabilities of above-normal temperatures during MAM and AMJ 2023 are forecast across the southern and eastern CONUS, supported by the PAC-calibrated NMME, CBaM, and the consolidation tool. Probabilities for above-normal temperatures exceed 60 percent for parts of the Rio Grande Valley in MAM where the consolidation has the strongest warm signal and decadal trends are strongly positive. The probabilities of above-normal temperatures are reduced across the central CONUS and Northeast by the possibility of negative temperature anomalies in March related to potential impacts of the intrusion of arctic air. Probabilities for above-normal temperatures are reduced for parts of the Great Basin and central Rockies, due to impacts from above-average snowpack in these regions. Probabilities for below-normal temperatures are elevated for the Pacific Northwest through the Northern Plains in MAM and confined to parts of the Northern Plains in AMJ, supported by the PAC-calibrated NMME, CBaM, and lingering La Niña impacts. Dynamical and statistical tools support increased probabilities of below-normal temperatures for southeastern Alaska in MAM with above-normal temperatures favored for western and northern mainland Alaska and the Aleutians. Increased probabilities for above-normal temperatures continue for western and northern Alaska for AMJ before expanding across most of the state in later leads, due primarily to decadal temperature trends and supported by statistical tools. Enhanced probabilities for above-normal temperatures continue for much of the West, the southern CONUS, and the East for MJJ through autumn, supported by the consolidation of temperature tools and decadal temperature trends . The coverage of enhanced probabilities for above-normal temperatures is reduced over parts of the north-central CONUS through autumn, where the CBaM indicates a potential for below-normal temperatures and decadal trends are weak. For longer leads corresponding to next winter into next spring, confident signals for above-normal temperatures become confined to western and northern areas of Alaska and eastern areas of the CONUS, supported by statistical tools and decadal temperature trends .
PRECIPITATION
Below-normal precipitation is favored for much of the Southwest in the MAM and AMJ seasons, supported by dynamical model guidance from the NMME and the consolidation of dynamical and statistical tools, including the influence of decadal trends . Above-normal precipitation is more likely for much of the Midwest and the Mid-Atlantic for MAM through MJJ, expanding to the central Gulf Coast in JJA through ASO, supported by the consolidation of precipitation tools and decadal climate trends . Probabilities for above-normal precipitation are enhanced for western Alaska in MAM, consistent with dynamical model guidance, as are enhanced probabilities for below normal precipitation for parts of southeastern Alaska in MAM and for parts of the Alaska Panhandle in MAM through JJA. An area of enhanced probabilities for below-normal precipitation over parts of the northwestern CONUS in AMJ through JAS was expanded relative to the outlooks from January, supported by the consolidation of precipitation tools. Enhanced probabilities for above-normal precipitation that continue for parts of the eastern CONUS through most of the remaining seasonal forecast leads into next spring are related to signals from decadal trends . Signals for below-normal precipitation for parts of the Pacific Northwest and the Alaska Panhandle in winter and next spring and for above-normal precipitation for parts of northern Alaska for autumn through next spring are also supported by the consolidation and consistent with decadal trends.
Review of the ENSO Assumptions utilized by NOAA (CPC) in Preparing this Four-Season Outlook
It is useful to review the ENSO forecasts used by NOAA to produce this Four-Season Outlook. We reported on that last week and you can read that article by clicking HERE
The key information used by NOAA follows.
IRI CPC ENSO STATE Probability Distribution (IRI stands for the International Research Institute for Climate and Society)
Here are the new forecast probabilities. This information is released twice a month and the first release is based on a survey of Meteorologists, the second is based on model results. The probabilities are for three-month periods e.g. JFM stands for January/February/March. I am just showing the first release which is what we have and presumably what NOAA (actually their CPC Division) worked from.

| Notice for FMA, the probability for ENSO Neutral greatly exceeds that for La Nina. So maybe March (the midpoint of the FMA three-month period) is when the ocean conditions will be consistent with ENSO Neutral but the impact on our weather may lag a month or so. So we really seem to be looking at La Nina into Spring.
It is early but the probabilities shown for JJA 2023 and beyond are very interesting. Are we headed for El Nino? It would be unusual to transition so quickly. |
Tropical Subsurface Temperature Anomalies
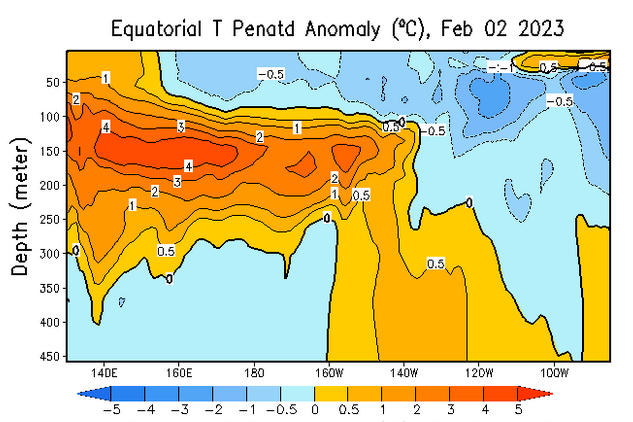
| You can update this graphic by clicking HERE and scrolling down to “Mean and anomalous equatorial temperatures“. You can see the anomalously warm water at depth undercutting the anomalously cool water. Also, notice the warm tongue extending on the surface from the east. It is subtle. We are leaving La Nina but there will remain a La Nina bias for a little while. |

| The image will update if you click HERE. https://www.cpc.ncep.noaa.gov/products/people/wwang/cfsv2fcst/images3/nino34SeaadjPDFSPRDC.gif
NOAA used to rely more on the IRI Forecast but now that CPC seems to have taken more control over IRI it is not totally clear how they determine their ENSO forecast. But it is pretty much evident in the NOAA Discussion and the set of 12 three-month maps they provide and which are shown in this article. I assume it takes them a couple of days to produce their Seasonal Outlook so it is always difficult to know the exact date of the data they utilized. |
Resources
The link for the drought outlook map and some discussions that come with the map can be found by clicking HERE.
| I hope you found this article useful and interesting. |