re “Inflation is always and everywhere a monetary phenomenon.”
. – – Milton Friedman1
Note: An updated, expanded, and further edited version has been published here.
Nobel laureate Milton Friedman is considered to be the father of monetarism. This macroeconomic theory enjoyed popularity in the late 20th century but has come under increased criticism in the 21st century. Monetary theory is deeply linked to arguments about the causes of inflation. As shown here, there is little data to support Friedman’s theory that government spending generally causes inflation. The issue is not as simple as he made it seem.

Milton Friedman, 1989. Credit: Encyclopedia Britannica.
What is Monetarism?
The essential thesis of monetarism is that economic activity is controlled (or at least influenced) by money supply. Friedman maintained that money supply changes have immediate and long-term effects on both production and price levels. According to Friedman, the effect of reducing the money supply is that short-term production is curtailed followed by lower prices. A summary from Wikipedia2:
Monetarism is a school of thought in monetary economics that emphasizes the role of governments in controlling the amount of money in circulation. Monetarist theory asserts that variations in the money supply have major influences on national output in the short run and on price levels over longer periods. Monetarists assert that the objectives of monetary policy are best met by targeting the growth rate of the money supply rather than by engaging in discretionary monetary policy.[1] Monetarism is commonly associated with neoliberalism.[2]
Monetarism today is mainly associated with the work of Milton Friedman, who was among the generation of economists to reject Keynesian economics and criticise Keynes’s theory of fighting economic downturns using fiscal policy (government spending). Friedman and Anna Schwartz wrote an influential book, A Monetary History of the United States, 1867–1960, and argued “inflation is always and everywhere a monetary phenomenon”.[3]
A primary reference for the excerpt above is a 1987 book containing a chapter by Phillip Cagan.3 Note: I have this book on order and have not yet read it.
The high inflation of the 1970s and 1980s has been a successful laboratory experiment4 for Monetarism. Sarwat and Papageorgiou5 discuss the success of monetarism at the height of its ascendancy in the 1970s and 80s:
Monetarists believe that the objectives of monetary policy are best met by targeting the growth rate of the money supply. Monetarism gained prominence in the 1970s—bringing down inflation in the United States and United Kingdom—and greatly influenced the U.S. central bank’s decision to stimulate the economy during the global recession of 2007–09.
The “Roaring Twenties” and the Great Depression
Friedman described the cause of the Great Depression to rest fundamentally on the Federal Reserve (the Fed) continued reduction of the money supply throughout the 1920s. Thus his generalization of the 1920s and 30s led to his conclusion that reducing money supply led first to lower production (GDP fell from 1929 through 1933), followed by lower prices (CPI fell from 1930 through 1933).
However, falling prices also preceded the 1929 crash (except for some .assets, most notably stocks) with CPI declining in 1921, 1922, 1924, 1926, 1927, and 1928. After 1920, consumer prices rose only three years of the “Roaring Twenties” – 1923, 1925, and 1929. And the CPI declines (-12.8%, -6.2%, -0.6%, -1.1%, -1.1%, and -1.2% – total 24.7%) far outweighed the CPI increases (3.6%, 3.5%, 1.2% – total 8.5%). Put differently, the compounded CPI inflation for the years 1921-29 was -14.6%.
Even though there was significant deflation in the 1920s, production of goods and services boomed. GDP rose by more than 190%, from ~$70 billion to $204 billion (1958 dollars).6
In this paper and succeeding ones, the inflation numbers for the U.S. will be reviewed and analyzed for the 21st century and the 20th century, as well as all the way back to 1793.
Does the Government Cause Inflation by Spending Too Much Money?
The goal of this paper and its successors is to determine how inflation varies with respect to government spending. We will be looking at correlations, so there will be no proofs of causation. But, unlike the popular expression “correlation is no proof of causation”, no correlation (or negative correlation) is strong evidence of the absence of direct causation.
Milton Friedman
We will find in this work that correlations are widely fluctuating over time. Thus, the ability to make time invariant generalizations about inflation is quite compromised. That being said, Milton Friedman had no such constraints. He was quite outspoken about how his theoretical extrapolations of his conclusions from selected past history could be generally applied. Here is a short YouTube video7 of an answer to a lecture question:
I expect that Friedman would put the onus for the current inflation on the U.S. federal deficits for much of the 21st century and the high stimulus spending during the COVID pandemic.
The Anti-Friedmans
But others might not agree with the hypothetical Friedman of the preceding paragraph. Robert Hertzel8 wrote the following in 1917:
… there is no self-evident experimental design to the forces that cause recessions. As a
result, economists will never form a consensus over the cause of a particular recession. Various
approaches toward the identification of the shocks that cause recessions exist. All offer some insight
but there is no econometric technique that does not incorporate significant judgment.
To put it bluntly, Hertzel says that discussing the cause of any particular recession is highly subjective. (Beauty is in the eye of the beholder.)
One such beholder is my friend Rodger M. Mitchell who blogs frequently on the economy and money in particular. He offers graphics such as the one below to make the point that there is no strong correlation evident between CPI and federal government deficit spending.9
Figure 1. Inflation and Federal Debt Held by the Public (1972-2021) Mitchell9
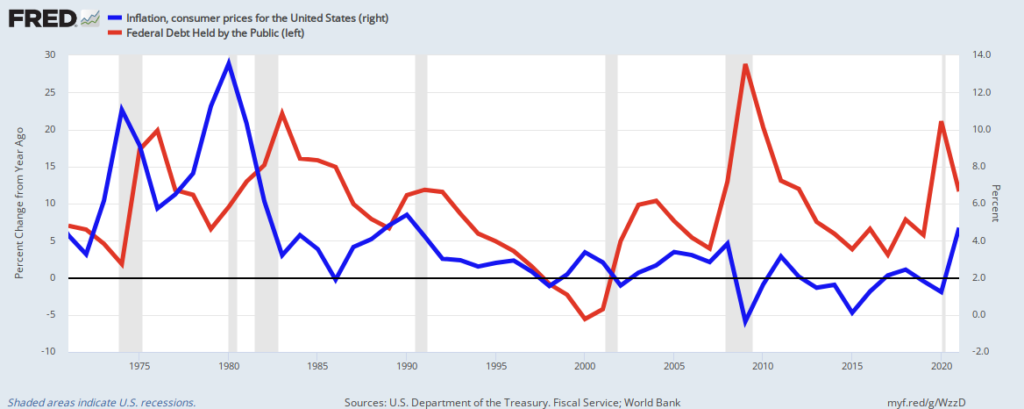
The absence of strong correlation seems obvious upon inspection. But the graph raises two questions:
- Precisely what are the correlation numbers for this data.
- How does this data compare to previous history of inflation an changes in federal government debt (deficits and surpluses).
This is the objective of this and follow-on papers.
Data
Inflation Data
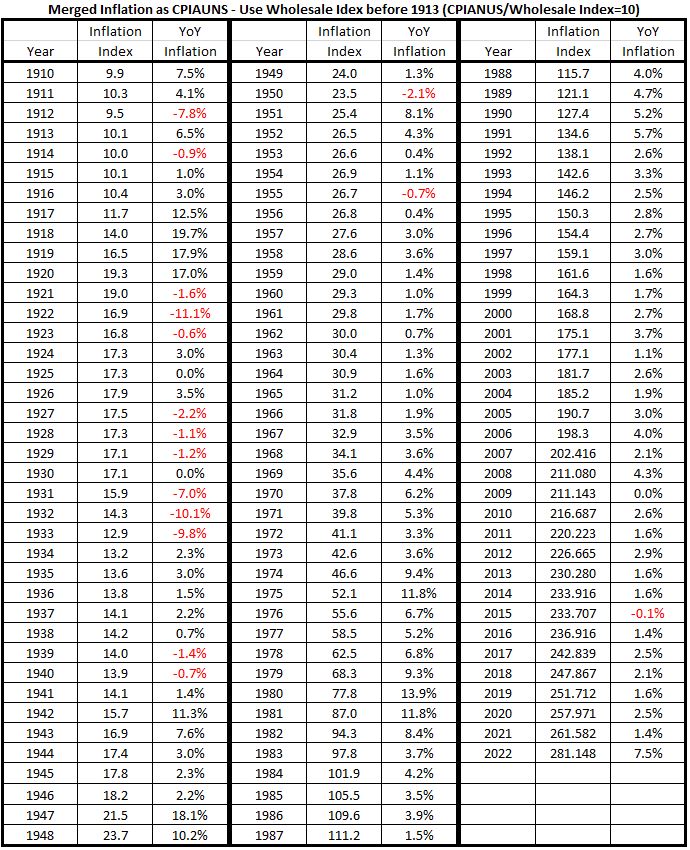
We have obtained inflation data from two sources. The first is CPI (Consumer Price Index) for which data is available back to 1913 (CPIAUNS).10 The second is the Wholesale Price Index,11 which covers the years 1749 to 1951. Some years are missing before 1792 so that data was not used. The Wholesale Price Index (WPI) covers a wide range of commodities, including food and energy. In the overlapping years (1913-1951) have a ratio for WPI/CPI = 9.3 (σ = 1.7). For the first three years (1913-1915), the ratio is WPI/CPI = 10.1. Since the difference between the two ratios is small compared to σ for the entire 38 years, we have elected to use the number 10 to normalize the two indexes to a common scale.
Note: Since the use of inflation data here will be in determining correlation to government spending, the direction of change from year to year is far more important than precise magnitude. In addition, the magitudes are only affected for change between 2012 and 2013 for correlation of individual year data and only 19 out of 169 correlations for the rolling 10-year moving averages that we examine.
Government Spending Data
We are interested in federal government deficits and surpluses. When there is a deficit, the government spends more than it receives in revenues. Conversely, government spending is negative when there is a surplus; ie, the government gets more money than it spends. We have calculated government sending from Historical Debt Outstanding (1791-2022).12 The calculation is simply
Deficit or Surplus for Year n = National Debt for Year n – National Debt for Year (n-1)
Data Tables
The first two tables show the merged price index data and the derived inflation numbers for each year from 1794 to 2022.
Table 1. U.S. Inflation (1793-1909)
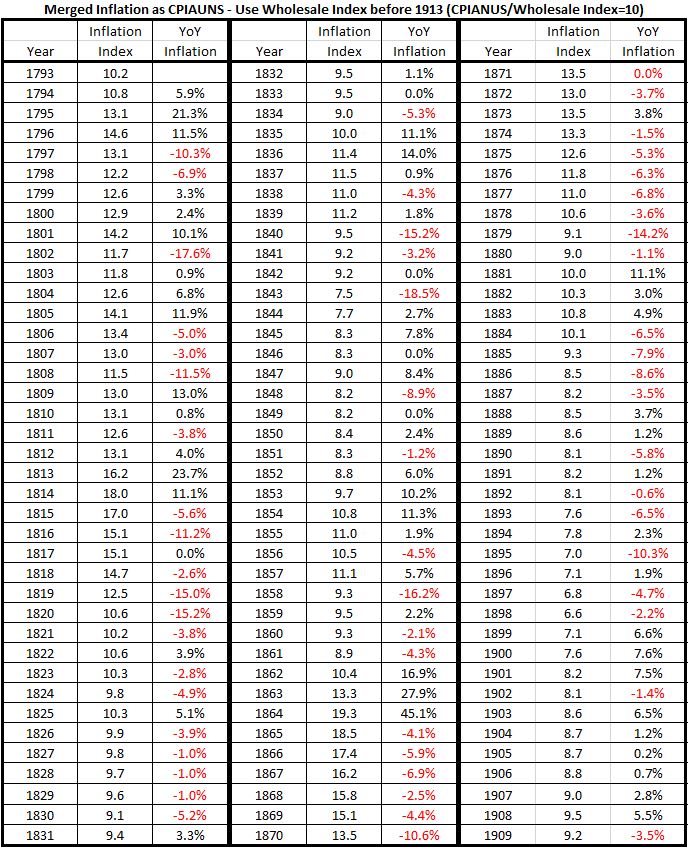
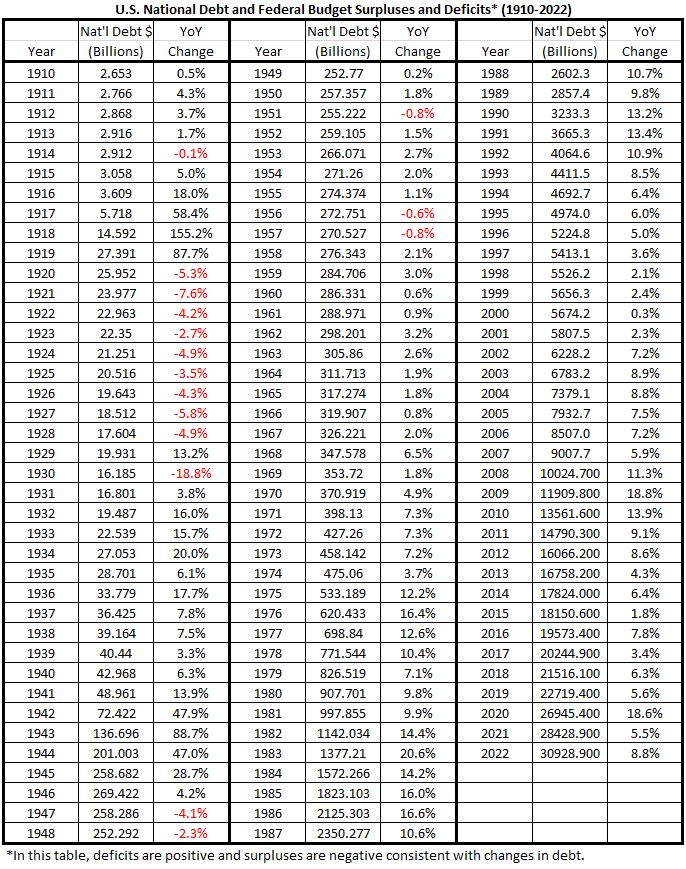
Table 2. U.S. Inflation (1910 – 2022)
The next two tables show the U.S. National Debt and the derived budget supluses or deficits from 1793 to 2022.
Table 3. U.S. National Debt with Annual Budget Deficits and Surpluses* (1793-1909)
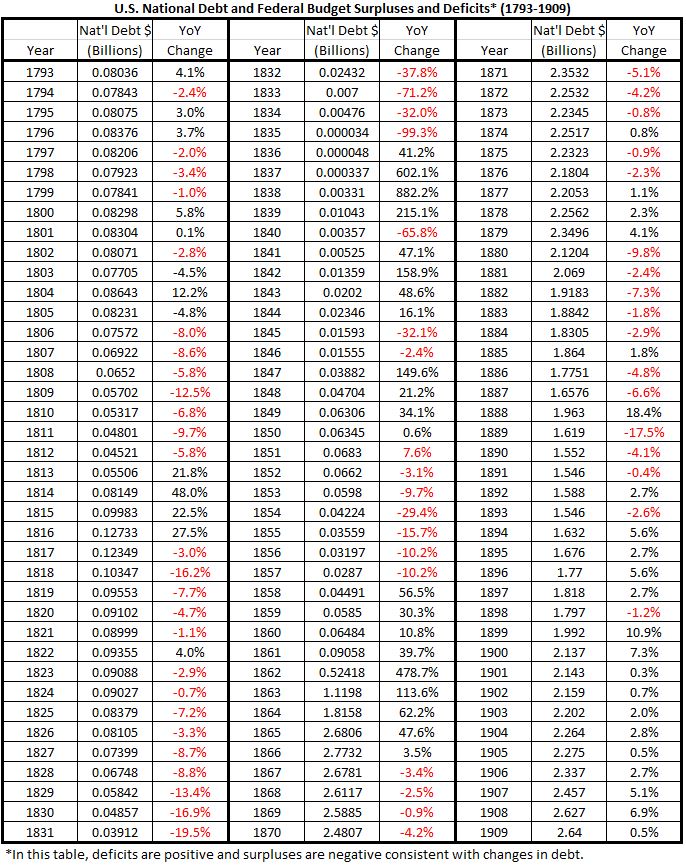
Table 4. U.S. National Debt with Annual Budget Deficits and Surpluses* (1910-2022)
Analysis
We want to examine how the federal budgets (deficits and surpluses) correlate with inflation. The first look at this invoives examing the correlation of the two data vectors over the entire data base from 1794 to 2022. It is found that the two data sets corrrelation coefficient R over the 229 years is equal to 0.09 (R2 = 0.007). This is not significantly different from zero correlation.
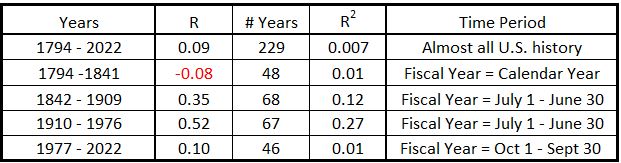
We next determined the correlations when the 229 years are divided into four different groups as shown in Table 5.
Table 5. Correlation of U.S. Federal Debt with Inflation
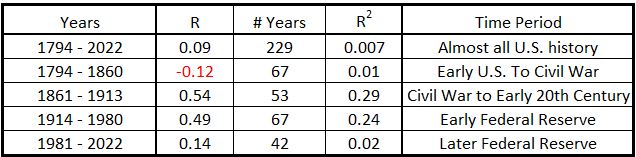
We assert that for two factors to have major correlation that R > 0.5. This is an arbitrary assignment and the boundary between minor and major correlation could be moved to either a higher or lower value of R. This question will be revisited as this study continues.
Looking at the results in Table 5 we conclude that the correlation between federal debt and inflation in the pre-Civil War United States was not different from zero. In the rest of the pre-Fed period (1861-1913), there is the possibility that government spending could have a significant direct impact on inflation. In the early Federal Reserve period (1914-1980), the correlation is very close to our threshhold level. Thus the possibility of federal government spending having a direct impact on inflation exists. But in the later Federal Reserve period (1981-2022), the possible significance of government spending direct affecting inflation declined substantially. The implication is that the possibility of federal deficits having a direct impact on inflation is negligible since 1980.
It is important to emphasize that the absence of meaningful correlation strongly suggests that there is no direct cause and effect between two variables. But other information is required to prove cause and effect when correlation correlation increase to allow for the possibility of cause and effect.
Effects of War
Major wars are very stressful on a nation’s economy. Both the all-out mobilization efforts to wage the war, and the adjustment period after the war ends, make those years different from the other years in a nation’s economy. Therefore, we have looked at the 205 years of U.S. history that remain when the years associated with the three major wars in our history. Those results are shown in Table 6.
Table 6. Correlation of U.S. Federal Debt with Inflation, Periods with Major Wars Omitted
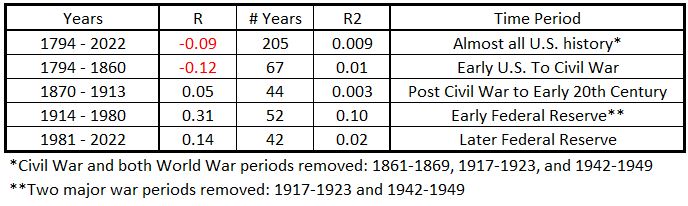
The 24 years associated with major wars and recovery therefrom have had a large effect on the correlations between government spending and inflation. All correlations are zero or negligible, except possibly for the period from 1914 to 1980. For that period there is a slight possibility of significant imapct from government spending on inflation, but far less than the possibility discussed in the preceding section with Table 5.
Since removal of the 24 years associated with major wars had such an impact of the correlations over the 205 remaining years compared to the original 229, we have looked at correlations for those years by themselves.
Table 7. Correlation of U.S. Federal Debt with Inflation During Years with Major Wars
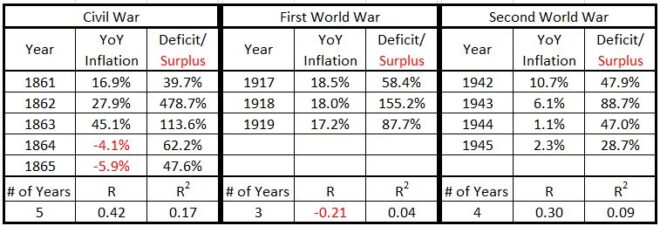
Table 8. Correlation of U.S. Federal Debt with Inflation During Recoveries from Major Wars
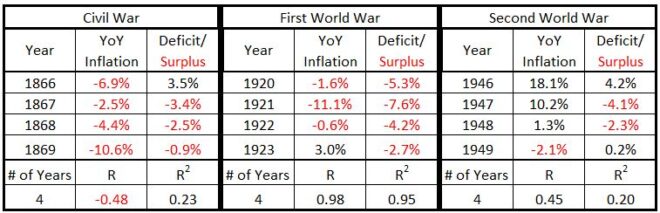
The correlations during the actual war years seem quite unremarkable. But for the four recovery years for each of the wars, two recoveries show remarkable results: recovery from the Civil War (nearly significant negative correlation) and almost perfect correlation during the recovery from WW I.
When we look at the data for the collection of 24 years of wars and recoveries, we get the data in Table 9.
Table 9. Correlation of U.S. Federal Debt with Inflation
Composite for Major Wars and Recoveries
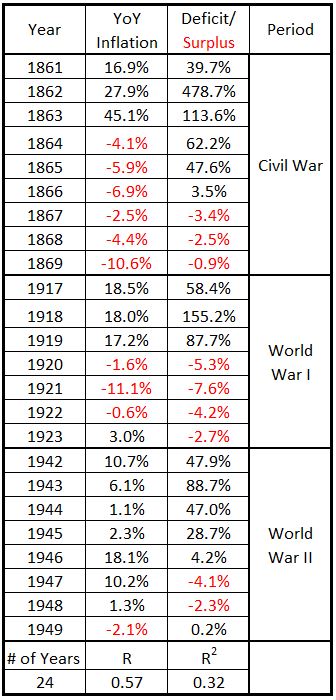
The result of analyzing this composite shows that overall the correlation indicates it is possible for government spending to have a significant impact on inflation during wars and recoveries from wars. But there is a lot of room left for other signifacant factors since the correlation is only 0.57. In addition, there are years of war and recovery where the impact of government spending must low, negligible, or negative. Plus the nearly 100% correlation for the WW I recovery stands out (Table 8).
It appears that the causes of inflation associated with major wars are probably variable and possibly many.
Variation of Correlations over Time
In the preceding section, we found that there has been no consistent pattern for inflation and correlation with government spending during major wars and war recovery periods. In this section we consider what the variations are in that regard over other time periods.
Below we show the rolling 10-year correlations for the entire data set. The first 10-year correlation covers 1793-1802, the second 1794-1803, etc., up to the latest for 2003-2022.
Figure 2. U.S. Federal Debt and Inflation – 10-year Rolling Correlations
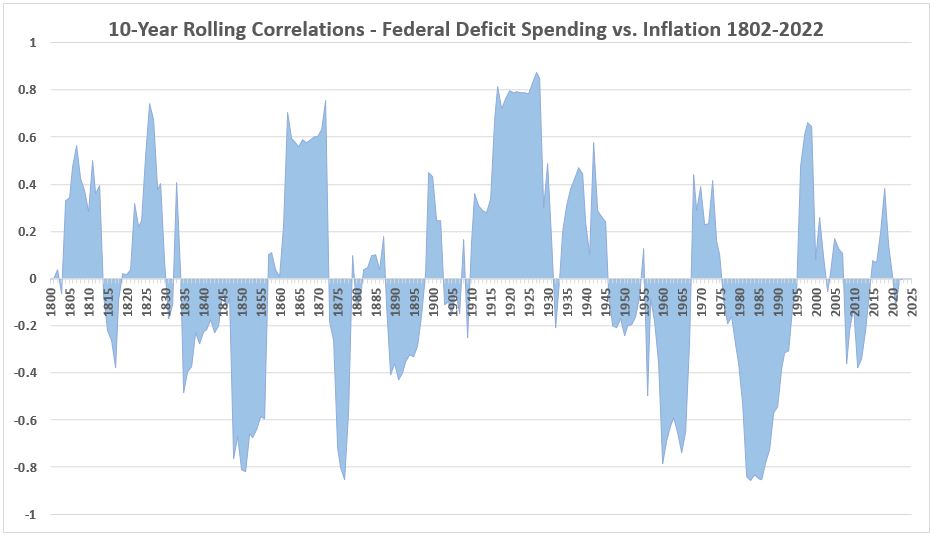
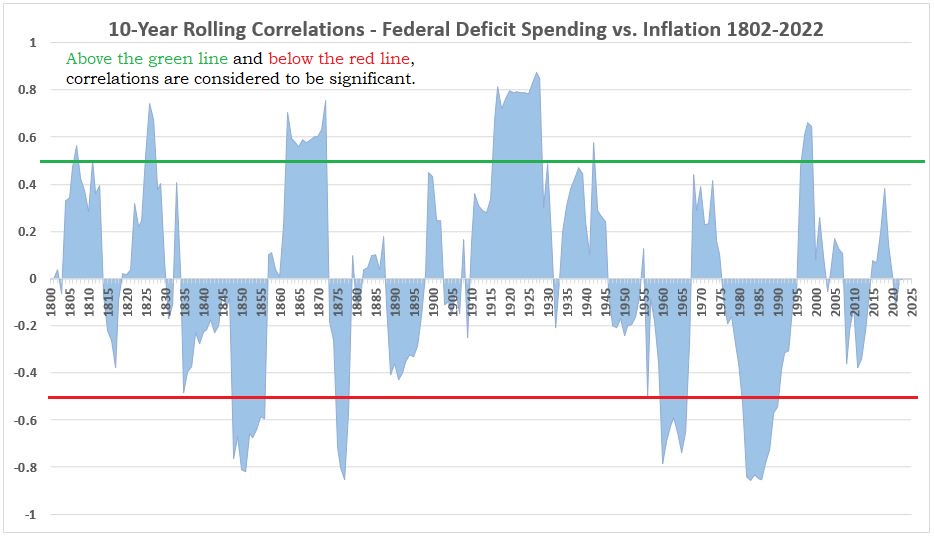
Figure 3 is the same as Figure 2 with lines added to show what we consider to be significant correlations. The two figures are presented because (as mentioned previously) the designation of significant levels of correlation is considered arbitrary at this point. With more research, those levels may be revised higher or lower.
Figure 3. U.S. Federal Debt and Inflation – 10-year Rolling Correlations (Annotated)
There is not much more to be said at this point except for the following:
- The correlation of inflation with government spending fluctuates wildy over more than 220 years of data history.
- It is clear that it is inaccurate to say that inflation is caused by government spending. It may be at times, but possible only perhaps 20-25% of the time.
- At times inflation has significant negative correlation with government spending. At times inflation goes up with decreasing government spending and/or vice versa.
- Note that the word possible has been carefully chosen: corelation does not prove causation.
This area will be examined carefully in our ongoing research.
Fiscal Year Concerns
Previously we divided the history of the United States into four time periods. See Table 5. There is a better basis for division than the one chosen previously. The fiscal year for the United States has changed over time. Before 1841 the fiscal year was the calendar year. From 1842-1976 the fiscal year was July 1 to June 30 (of the fiscal year). From 1977 to date, the fiscal year has been October 1 to September 30 (of the fiscal year). The correlations have been calculated with the time periods covering only identical fiscal years. The 135 years,1842-1976, has been divided in to two groups: 1842-1909 and 1910-1976.
Table 10. Correlation of U.S. Federal Debt with Inflation in Different Fiscal Year Scenarios (4 Groups)
After the correlations were calculated for Table 19 we noted that the 135 years for the July-June fiscal calendar divided into three groups of 45. These were similar in size to the other two groups (46 aand 48). So, for no other reason than symmetry, we calculated the correlations for five groups.
Table 11. Correlation of U.S. Federal Debt with Inflation in Different Fiscal Year Scenarios (5 Groups)
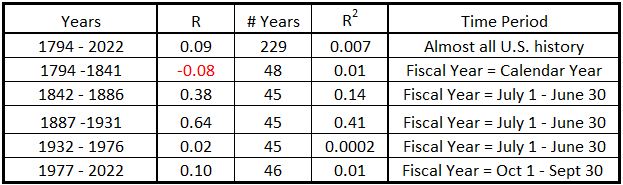
his additional exersize was fortuitous because it made clear how sensitive the results could be to sample selection.
These results leave us with two observations:
- The variations of correlations for these data series over time make sample selections for analysis difficult.
- To do meaningful research, more information will be needed than just the historical numbers for national debt and inflation.
Conclusion
There is little data to support the theory of Milton Friedman that states government spending causes inflation. But the data examined here is also not sufficient to indicate that the government has not impacted inflation significantly during some periods of time. It seems that, even at this early stage, we have demonstrated that a theory which has government spending at the core of describing all inflation is discredited. It remains to be seen how often the government is a primary contributor, when it is a secondary contributor, and when it may not make any positive contributions at all to inflation.
The idea that money supply (government produced or otherwise) has anything to do with inflation has been challenged. It has even been proposed that inflation produces increased money supply, not the other way around. An example of such work comes from a study of inflation in Turkey in 2017. From the abstract of a paper by Incekara and Amanov:13
In this study, it was questioned whether the monetary base is an optimal instrument for monetary policy applications. The endogeneity of the money supply and the relationship between money supply and inflation in the Turkish economy for a sample period of 1990-2016 has been examined. The Johansen cointegration test and the Granger causality test were applied as an appropriate econometric approach to carry out this study. According to findings CBRT cannot control the money supply and monetary base, although it can determine the interest rate in the short-run. CBRT implements accommodative monetary policy in the short-run. In the long-run money supply doesn`t have predictable effect on inflation, thus CBRT cannot use monetary aggregates in the conduct of monetary policy. Fluctuations of money supply is not reason of inflation, but on the contrary result of inflation. According to these results, monetary base may not be the optimal policy instruments to ensure price stability. Both short-run and long-run results suggest that the CBRT has very limited control over the money supply.
A related conclusion has been drawn by Blair Fix studying inflation, interest rates, and money supply in 132 countries with data in the World bank database:14
According to canon, higher interest rates slow the growth of the money supply, and thus reduce inflation. And yet, when we look at the evidence, there is no sign of this pattern. Instead, higher interest rates are associated with both a faster expansion of the money supply, and higher rates of inflation.
Why have such correlations not been studied by others? Perhaps they have and I have not yet been exposed to them. But if such studies exist, they have not been integrated into central bank policies. My future work continue to look into what the available data may say about inflation and keep posting my results. I have not finished looking at government spending and inflation. There should be more within the next two weeks.
Footnotes
1. Mark J. Perry, Mark J., “My Favorite Milton Friedman Quotes”, American Enterprise Institute, November 17, 2006
https://www.aei.org/carpe-diem/my-favorite-milton-friedman-quotes/
2. Wikipedia, https://en.wikipedia.org/wiki/Monetarism.
3. Cagan, Phillip, “Monetarism”, The New Palgrave: A Dictionary of Economics, 1987, v. 3, Reprinted in John Eatwell et al. (1989), Money: The New Palgrave, pp. 195–205.
4. I chose the term “laboratory experiment” for the crushing effects of very high interest rates in the late 1970s and early 80s with a wry sense of humor: The people of the UK and the US were the lab rats.
5. Jahan, Sarwat and Papageorgiou, Chris, “What Is Monetarism?”, Finance and Development, International Monetary Fund, Vol. 51, No. 1, March 2014. https://www.imf.org/external/pubs/ft/fandd/2014/03/basics.htm.
6. United Sates Bureau of the Census (Introduction by Wattenberg, Ben J.), The Statistical History of the United States, Basiic Books, New York (1976) p. 204.
7. Friedman, Milton, “Only Government Creates Inflation”, YouTube, https://youtu.be/F94jGTWNWsA.
8. Hetzel, Robert L., “What Remains of Milton Friedman’s Monetarism?”, Working Paper No. 17-09, Federal Reserve Bank of Richmond, July 13, 2017 https://www.richmondfed.org/-/media/RichmondFedOrg/publications/research/working_papers/2017/pdf/wp17-09.pdf.
9. Mitchell, Rodger M., “Many economists want poverty never to be cured. Here’s why.“, Monetary Sovereignty Blog, January 3, 2023.
10. Federal Reserve Economic Data, Consumer Price Index for All Urban Consumers: All Items in U.S. City Average, Index 1982-1984=100, Monthly, Not Seasonally Adjusted, https://fred.stlouisfed.org/graph/?id=CPIAUCNS,.
11. United Sates Bureau of the Census (Introduction by Wattenberg, Ben J.), The Statistical History of the United States, Basiic Books, New York (1976) pp. 200-202.
12. U.S. Department of the Treasury, Historical Debt Outstanding, Last update October 4, 2022.
https://fiscaldata.treasury.gov/datasets/historical-debt-outstanding/historical-debt-outstanding
13. Incekara, Ahmet and Amanov, Akmyrat, “Optimal Policy Instrument Selection in Monetary Policy: Endogeneity of Money Supply”, Journal of Business, Economicsand Finance – (JBEF), ISSN: 2146 – 7943, Volume: 6 Issue: 2, 2017, p. 61-69. https://www.pressacademia.org/archives/jbef/v6/i2/full-issue.pdf
14. Fix, Blair, “Do High Interest Rates Reduce Inflation? A Test of Monetary Faith”, Economics from the Top Down, Feb. 4, 2023