Updated at 11 a.m. Monday, January 9, 2023. Our weekend article is updated all weekend into Monday and usually Tuesday also.
Here is what we are paying attention to in the next 48 to 72 hours from Monday Morning’s NWS forecast. This article also includes World weather forecasts. We have more images displayed rather than simply providing the links to make it easier for readers to look ahead 28 days. We are also going to discuss the latest Western Water Forecast.
We start with the U.S. Information.
Short Range Forecast Discussion
NWS Weather Prediction Center College Park MD
300 AM EST Mon Jan 09 2023

Valid 12Z Mon Jan 09 2023 - 12Z Wed Jan 11 2023

...Two major episodes of heavy precipitation expected to impact California
today and Tuesday...

...Periods of mountain snow spread across the Intermountain West and into
the northern and central Rockies...

...Well above average temperatures build into the southern Plains...
Just Out, the Spring Western water supply forecast (I am showing key excerpts from the report. The full report can be accessed here.
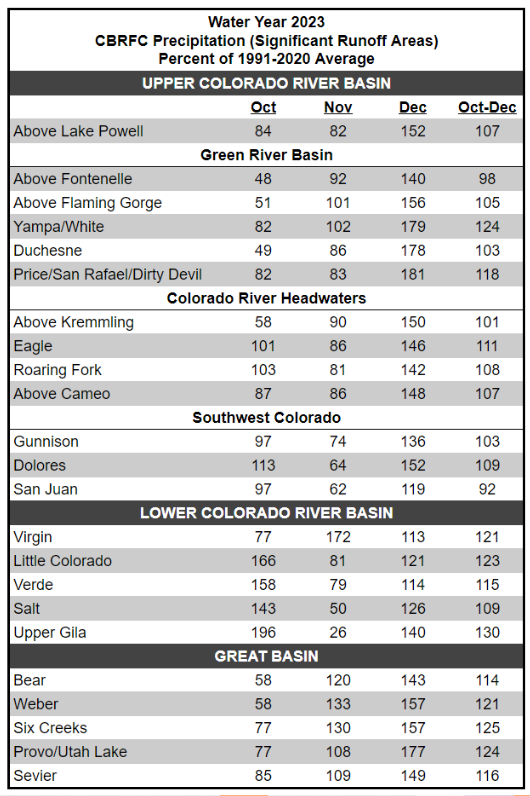
Here is the Water Year (Begins October 1) actuals and near-term forecasts.
Here is the forecast for Spring and Summer
–
| It is a forecast. I am not sure how to interpret the forecast range. |
–
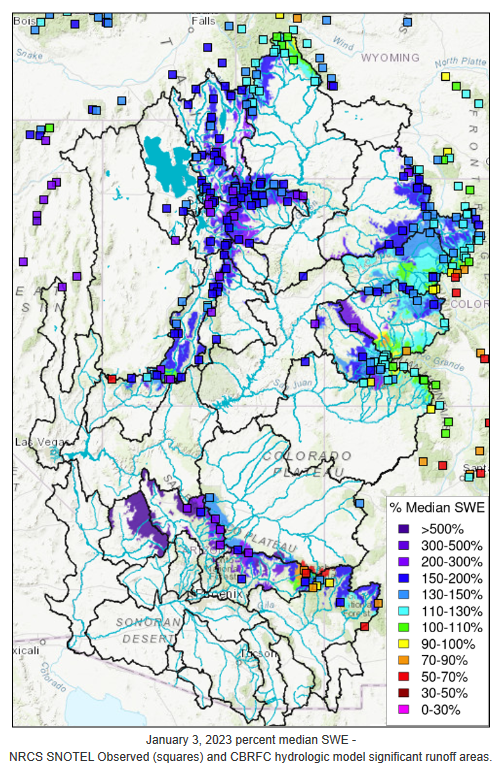
| This is a key basis for the forecast. There is a lot of snow in the mountains. SWE means the water content of the snow since some snow is fluffy and some is dense. [Author’s Note: Some of those mountain ranges have cloud-seeding projects. IMO all of them should.] |
Back to what we usually present, first, the 48-Hour Forecast (It is a 48 to 72 Hour Forecast actually)
Daily weather maps
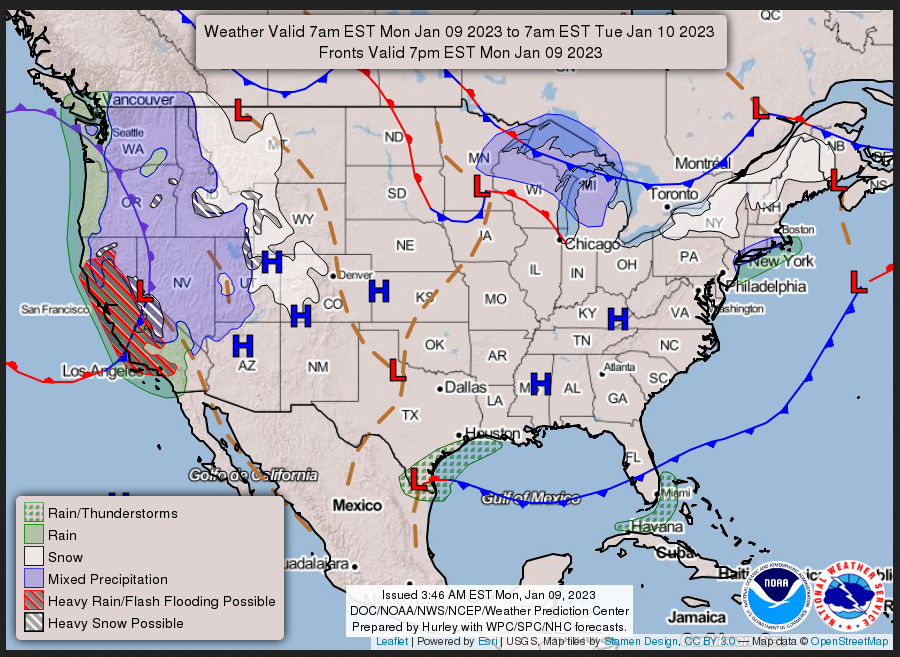
MONDAY
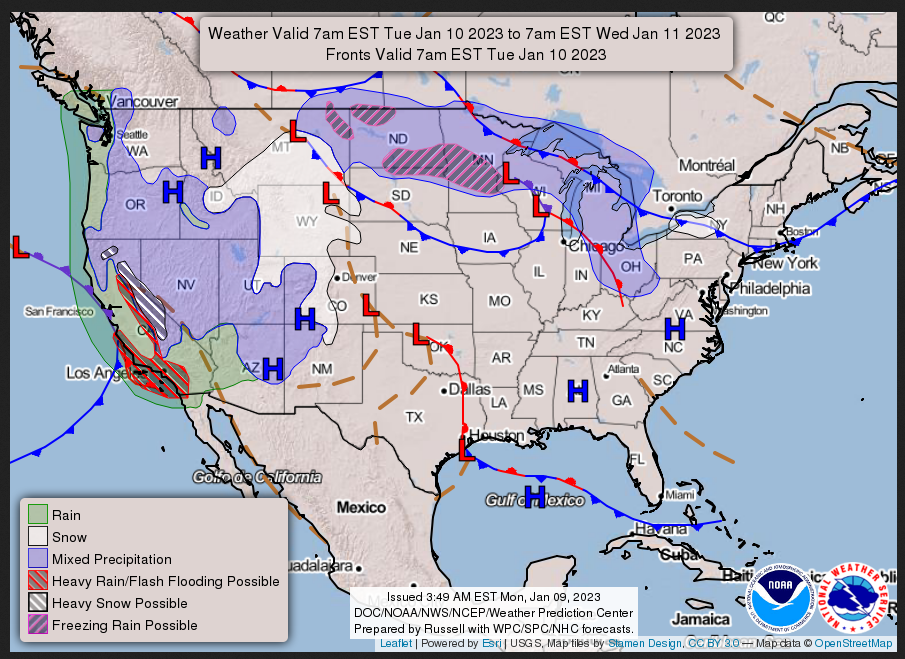
TUESDAY
WEDNESDAY
I try to keep the above maps updated. They only update twice a day and in some cases once a day.
I will be doing the updating during the period described in the title of the article but if you happen to read this article later you can get updates by clicking HERE.
This animation shows how things may play out over the next 60 hours. To update click here.
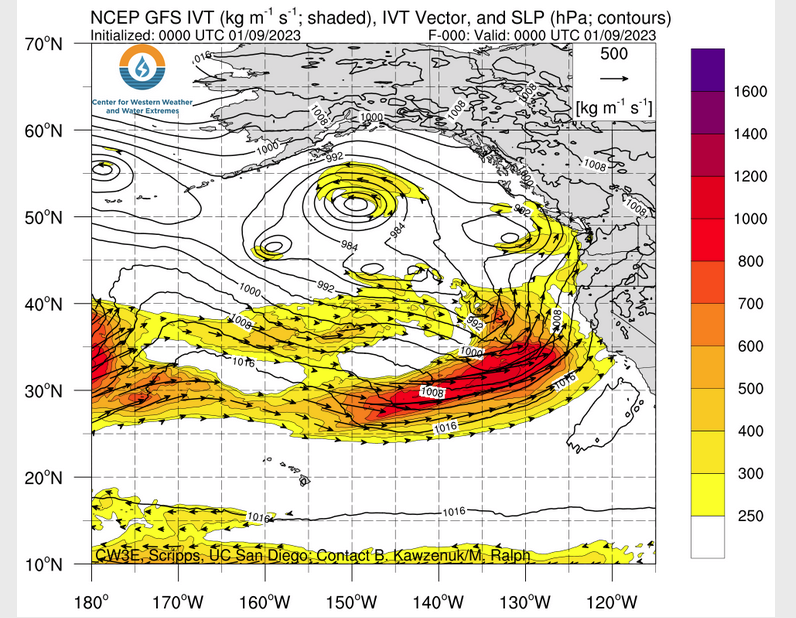
ATMOSPHERIC RIVERS
Continuation of the NWS Short Range Forecast (It is updated by NWS twice a day and these updates can be found here. We post at least one of those updates daily, sometimes both. The Highlights are shown in the lede paragraph of this article.
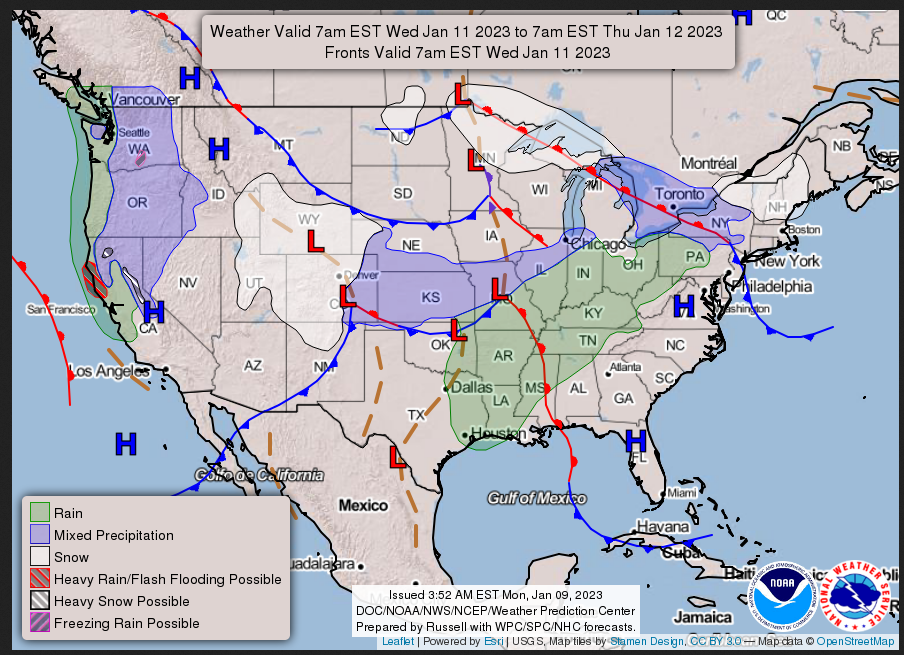
Two major episodes of heavy rain and heavy mountain snow are expected to
impact California in quick succession during the next couple of days in
association with two of the more energetic and moisture-laden parade of
cyclones that are aiming directly for California.  The heavy precipitation
episode currently streaming into central California is expected to be the
more robust of the two, resulting in heavy rainfall totals of 3-5 inches
near the coast.  The second episode will quickly arrive on Tuesday with
amounts slightly less heavy, but impacting locations farther south into
southern California.  The Sierra Nevada will likely see heavy snow
exceeding 6 feet across the higher elevations before the snow tapers off
Wednesday morning.  The cumulative effect of successive heavy rainfall
events will lead to additional instances of flooding. This includes rapid
water rises, mudslides, and the potential for major river flooding.
Susceptible terrain and areas near recent burn scars will be most at risk
for debris flows and rapid runoff. For the higher terrain of the Sierra
Nevada, extremely heavy snow and intense snowfall rates are anticipated to
make travel very dangerous to impossible at times, including the potential
for road closures. The amount of additional accumulating snow on top of an
already well built snowpack is likely to increase the threat of avalanches
and strain infrastructure. Gusty winds are also expected to spread onshore
with the approaching system and could lead to the threat of downed trees
and power outrages. The combination of saturated soil and gusty winds
could exacerbate the tree damage threat. Residents and visitors across
this region are advised to check their local forecast, never drive across
flooded roadways (Turn Around Don't Drown!), and have both an emergency
kit and evacuation plan in place.

Elsewhere, excess moisture associated with the two heavy precipitation
episodes is forecast to reach well inland across the Intermountain West
and central Rockies. Widespread mountain snow, locally heavy, can be
expected to reach the northern Great Basin later today, before more
mountain snow expands farther south across the Great Basin toward the
central Rockies on Tuesday into early Wednesday. For the eastern U.S., a
weak system with a light wintry mix across the northern Mid-Atlantic and
showers near the Eastern Seaboard this morning will quickly exit into the
Atlantic.  Tranquil weather is anticipated for the remainder of the
country today, as much above average temperatures begin to establish
across the southern Plains on Tuesday, where high temperatures into the
60s and 70s are forecast from the southern Plains to the Deep South, upper
70s and 80s across Texas.  By early on Wednesday, a low pressure wave
could deliver a period of snow across the northern Plains into the upper
Midwest.
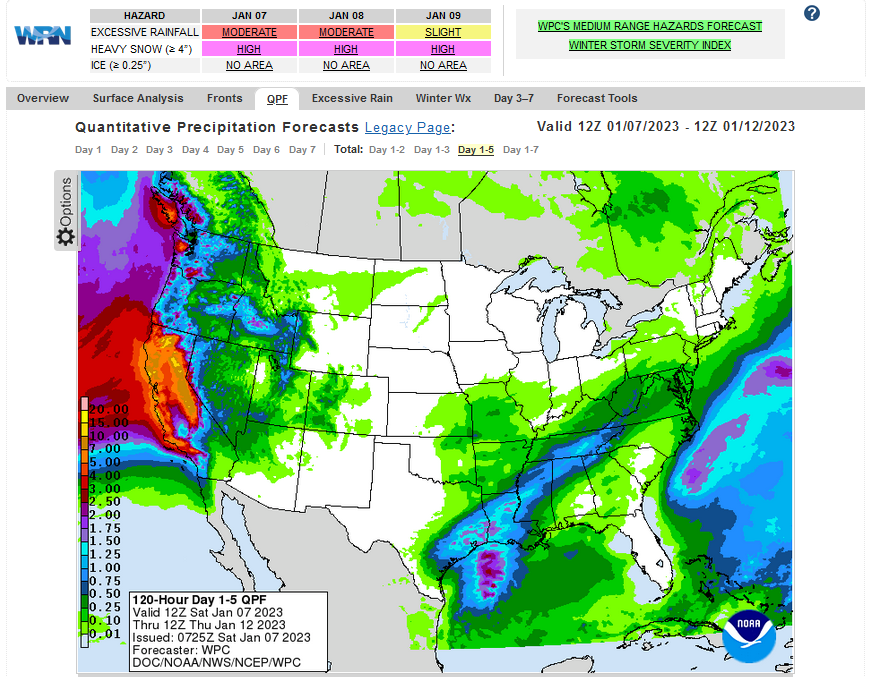
Below is the current five-day cumulative forecast of precipitation (Updates can be found HERE)
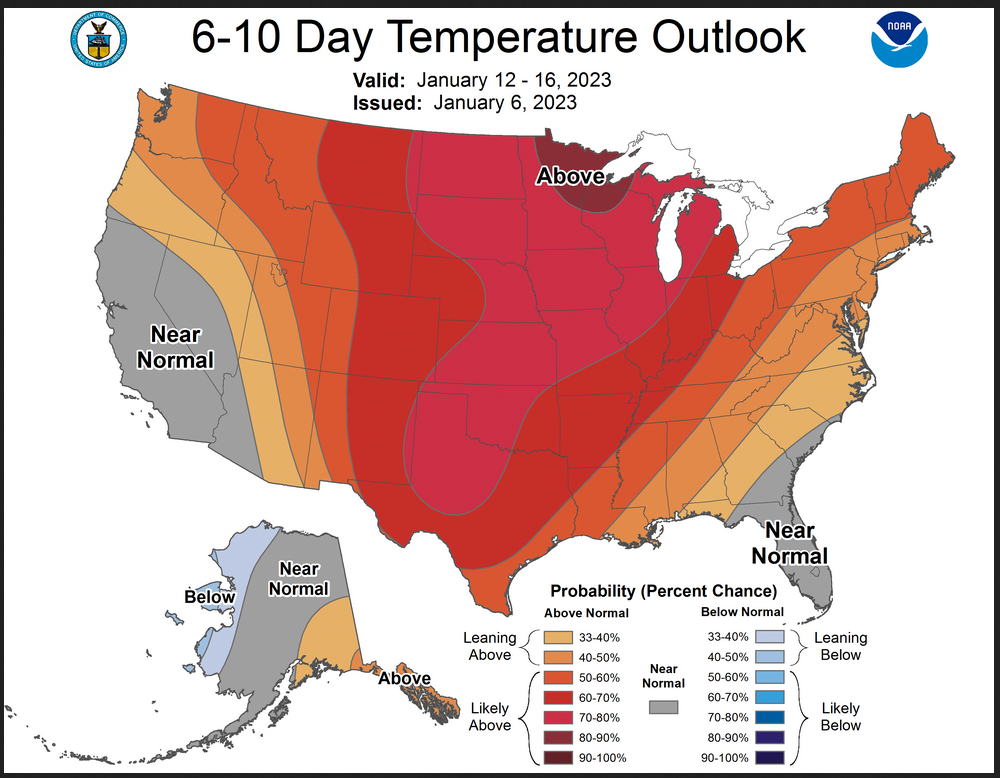
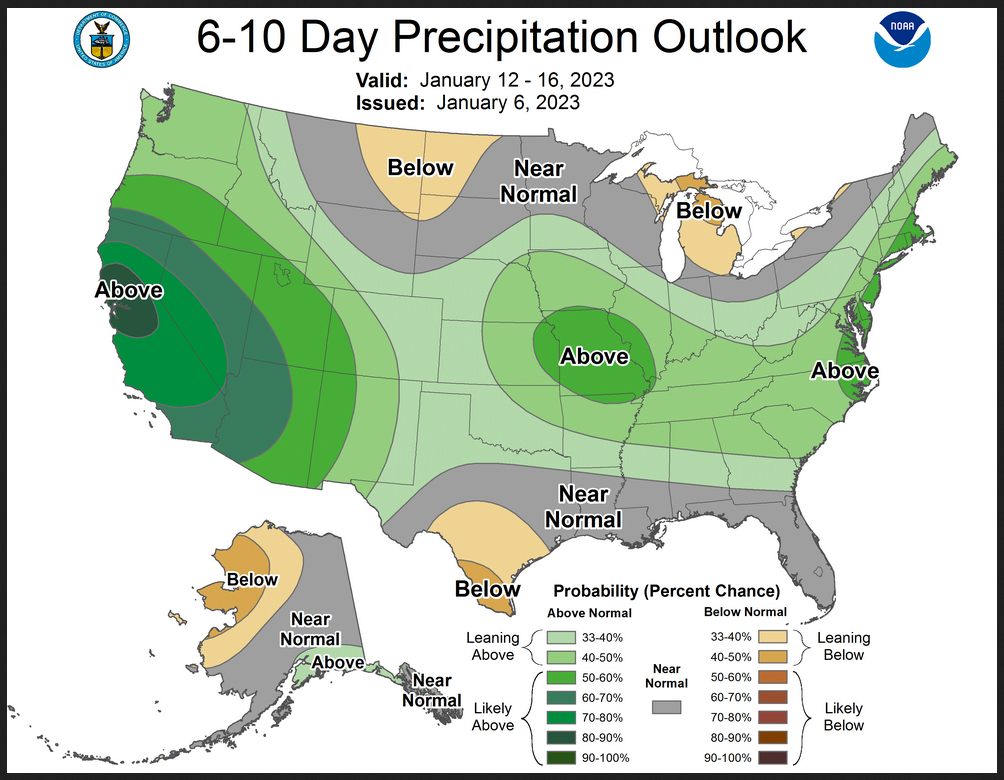
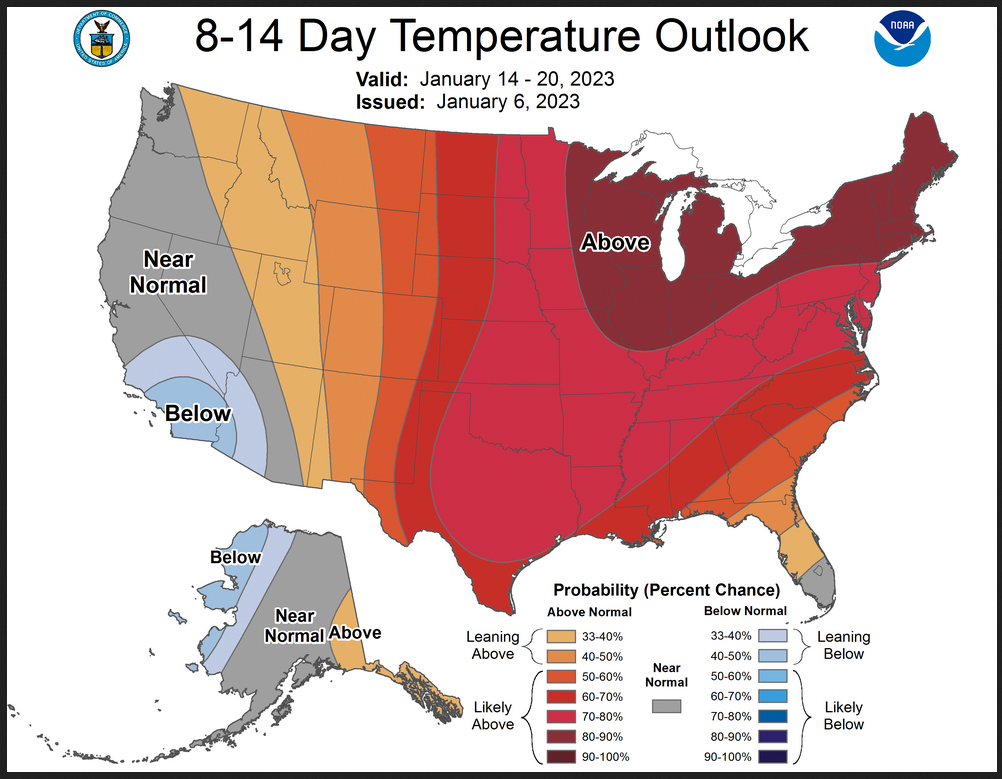
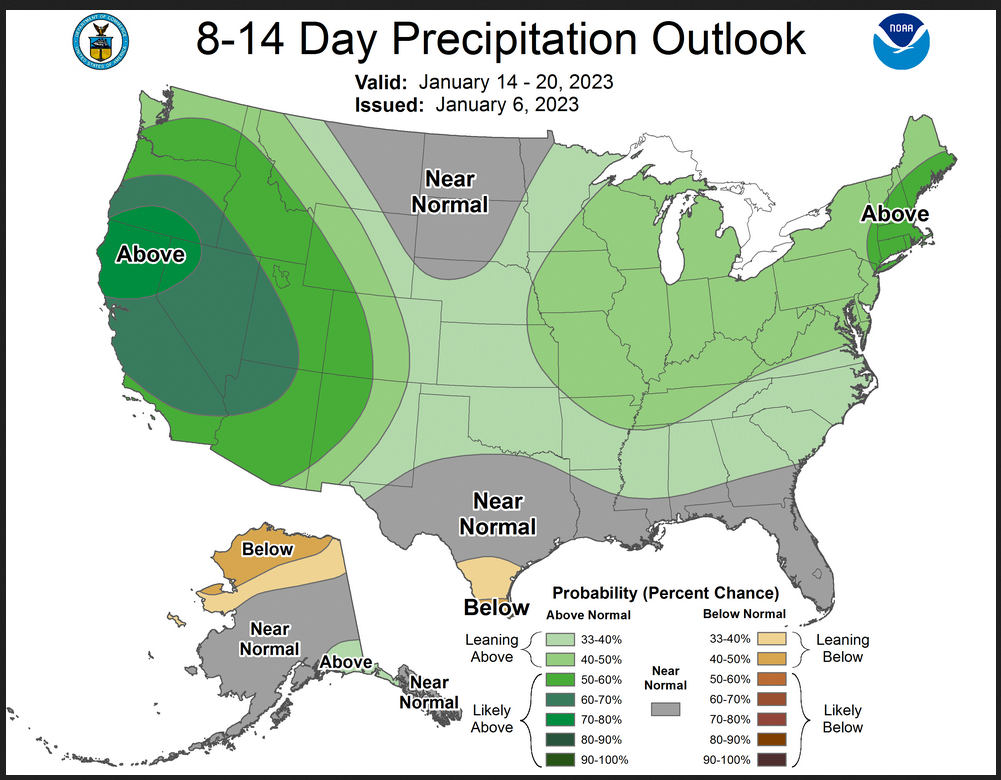
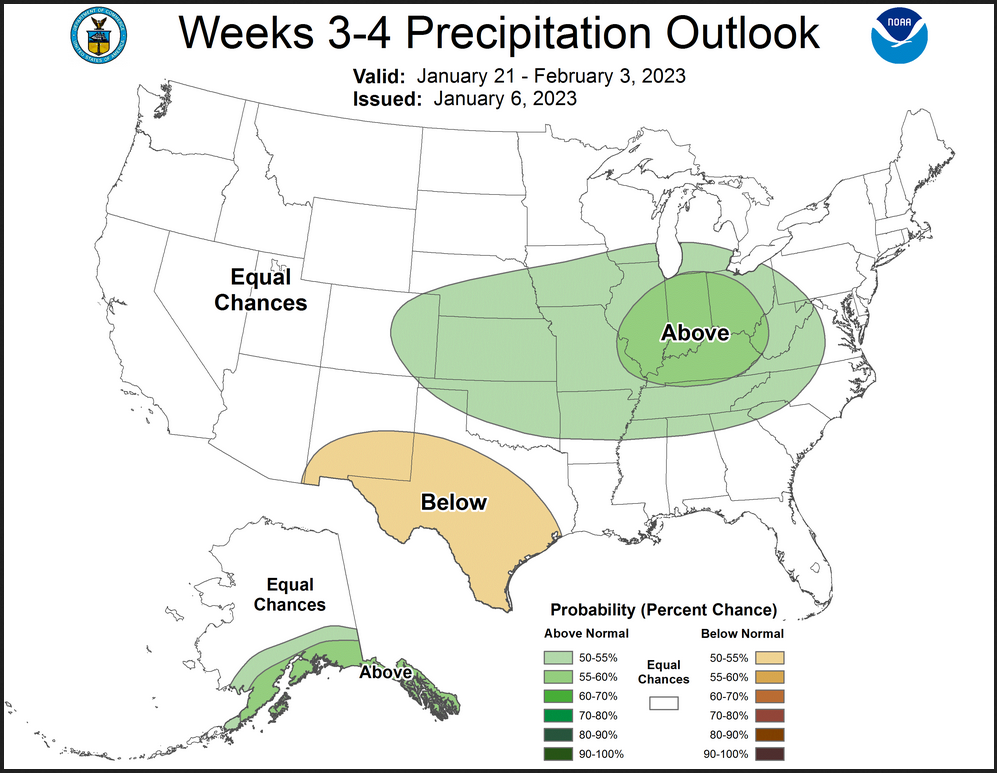
Now we look at Intermediate-Term “Outlook” maps for three time periods. Days 6 – 10, Days 8 – 14, and Weeks 3 and 4. An outlook differs from a forecast based on how NOAA uses these terms in that an “outlook” presents information as deviation from normal and the likelihood of these deviations.
Below are the links to obtain updates and additional information. They are particularly useful if you happen to be reading this article significantly later than when it was published. I always try to provide readers with the source of the information in my articles.
–
| Warm and wet |
Days 8 – 14
–
| Still warm and wet |
Weeks 3 – 4
–
| Very different but that has been the pattern. The 6 – 14 outlooks say one thing and the second half of the month outlooks say something different. That can be correct at any point in time but can not be correct week after week. I spent many hours a month or two ago trying to figure it out and do not feel like redoing that experiment. We will watch it. |
Discussion Released with Week 3 – 4 Outlook
Prognostic Discussion for Week 3-4 Temperature and Experimental Precipitation Outlooks
NWS Climate Prediction Center College Park MD
300PM EST Fri Jan 06 2023Week 3-4 Forecast Discussion Valid Sat Jan 21 2023-Fri Feb 03 2023
The first Week 3-4 Outlook of the year is set against the backdrop of a weakening La Niña signal and the potential for a robust Madden Julian Oscillation (MJO) signal. RMM indices indicate weak convection in Phase 8, but models are in good agreement with the enhancement and eastward propagation of the MJO convection into Phases 8 and 1, which could have implications for North American temperature and precipitation. The majority of the relevant extratropical climate signals, including the North Atlantic Oscillation (NAO), are trending toward neutral phases by the start of the forecast period. There has been some indication that the stratospheric polar vortex, which can sometimes lead to changes in the NAO, will be perturbed by a wave-breaking event in the next week. While this event is currently not forecast to impact the tropospheric circulation during the Week 3-4 period, further stratospheric perturbations may result in larger impacts. Therefore, this week’s forecast relies more on potential tropical teleconnections related to the MJO as well as the dynamical model suite.
There is good agreement between the dynamical models in terms of the large-scale circulation patterns. In particular, the models consistently forecast the inland progression of the anomalous troughing that has been located off the West Coast, bringing extreme precipitation to California and the Pacific Northwest. Current model solutions do not favor a significant eastward progression of the trough from week 3 to week 4, which is notably different from previous model runs that indicated more progression.
The temperature forecast for the Week 3-4 period tilts toward a dipole-like pattern across CONUS, characterized by below normal probabilities throughout western CONUS and above normal probabilities through the East. Dynamical models consistently favor below normal temperature throughout the Southwest, Great Basin, and California under the anomalous troughing. Model agreement and anomalous ridging in the Southeast strongly supports above-normal temperatures in the East with strongest probabilities in the Northeast. Probabilities are less confident in the Southeast due to poor run-to-run consistency, in which previous runs indicated eastward progression of the trough and thus colder temperatures in that region. Model signals are weak across Alaska, resulting in Equal Chances (EC) for above or below normal temperatures for much of the region except the North Slope where model agreement favored a slight tilt toward above normal probabilities.
The precipitation forecast for the Week 3-4 period is largely dominated by the anomalous troughing over western CONUS. As this trough progresses onshore from the Week-2 period, it is expected that the enhanced atmospheric rivers activity will relax. This is further supported by the anticipated MJO progression into Phases 8 and 1, which are often associated with anomalously dry conditions across the western portions of CONUS at Week 3-4 lags. However, model guidance is mixed on any precipitation signal, which will be sensitive to the location of the trough axis. Therefore EC is favored west of the Continental Divide. Ahead of the trough, above normal precipitation is forecast for the central Plains and the Midwest while a slight tilt toward anomalously dry conditions are indicated for southern Texas and New Mexico. Anomalous onshore flow for the Alaskan South Coast and Panhandle resulted in above normal precipitation probabilities there.
SST anomalies surrounding Hawaii are slightly above normal, elevating the chances of above normal temperatures throughout the forecast period with lower probabilities to the southeast. Mixed dynamical model guidance resulted in EC across most of the islands with a slight tilt of below normal probabilities for Hilo.
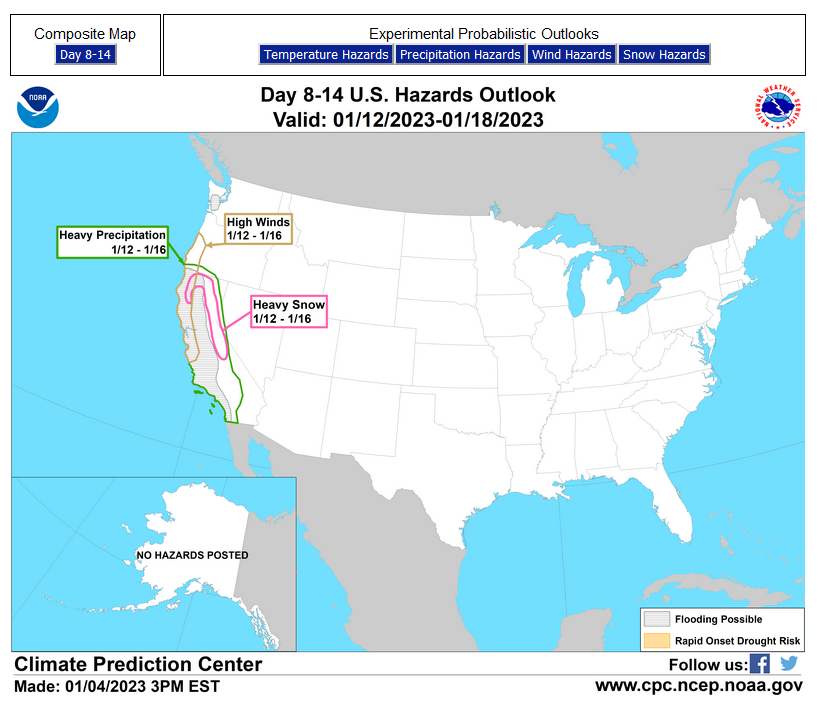
HAZARDS OUTLOOKS
Click here for the latest complete Day 3 -7 Hazards forecast which updates only on weekdays. Once a week probably Monday or Tuesday I will update the images. I provided the link for readers to get daily updates on weekdays. Use your own judgment to decide if you need to update these images. I update almost all the images Friday Night for the weekend edition of this Weather Report. So normally readers do not need to update these images but if the weather is changing quickly you may want to.
 Month to Date Information
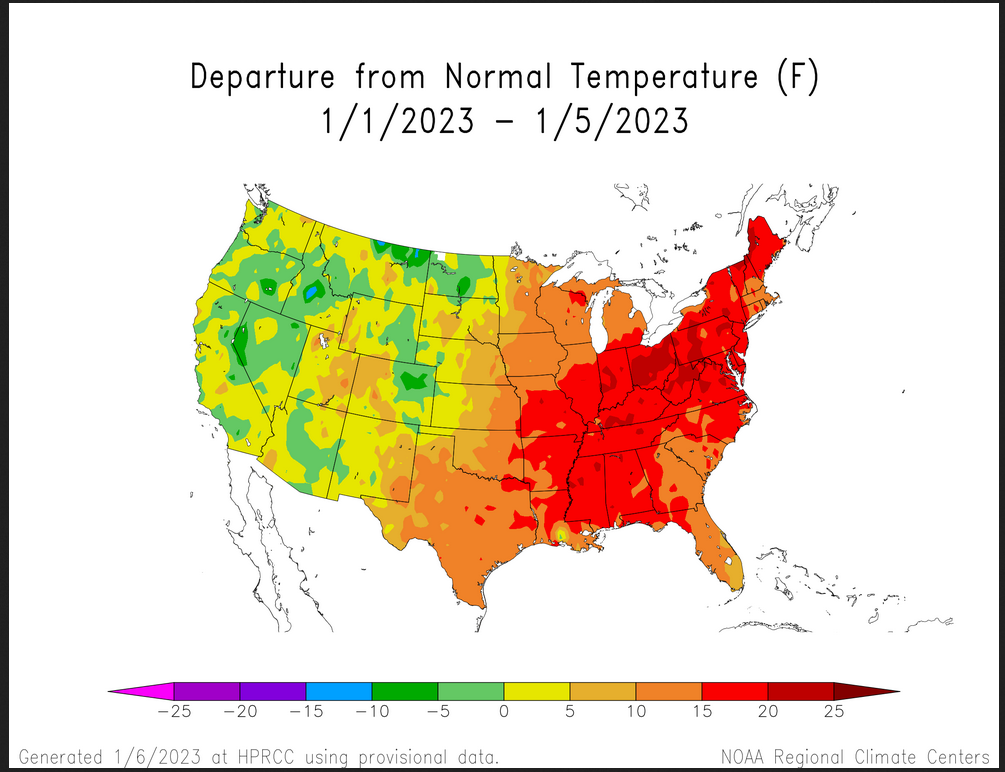
Temperature month to date can be found at https://hprcc.unl.edu/products/maps/acis/MonthTDeptUS.png
Precipitation month to date can be found at https://hprcc.unl.edu/products/maps/acis /MonthPNormUS.png
World Forecast
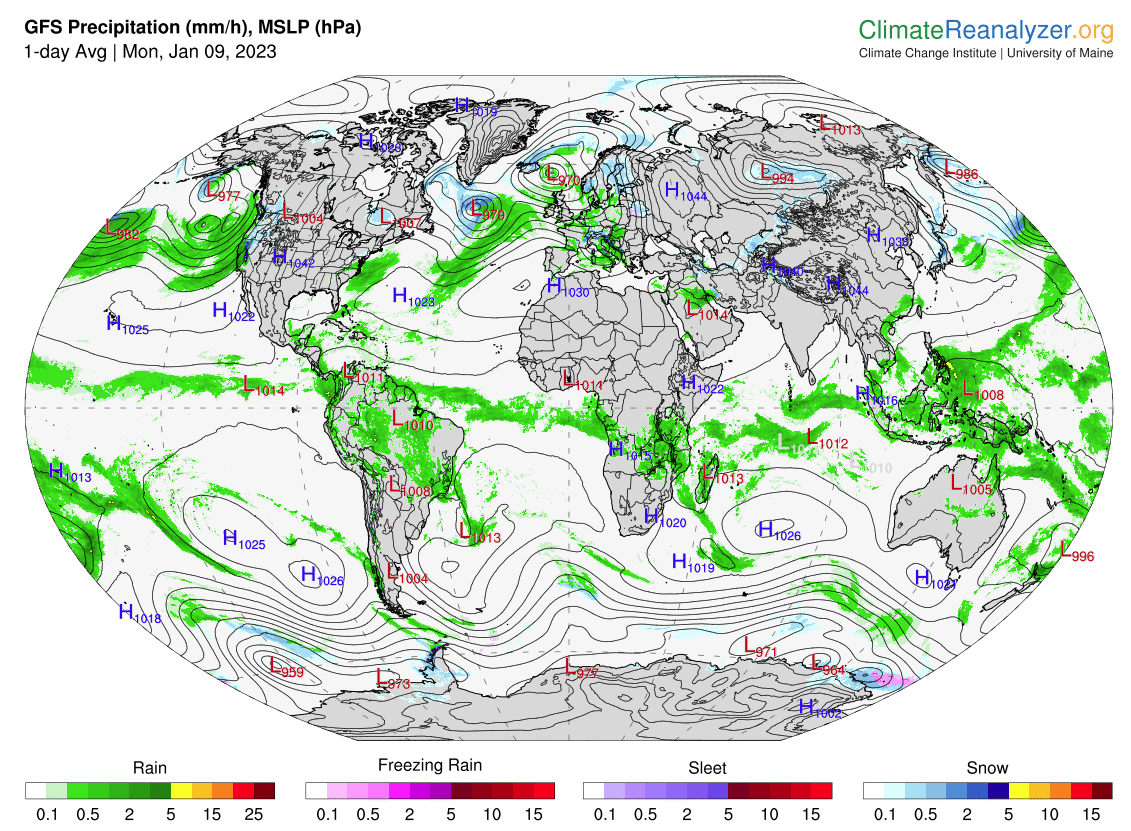
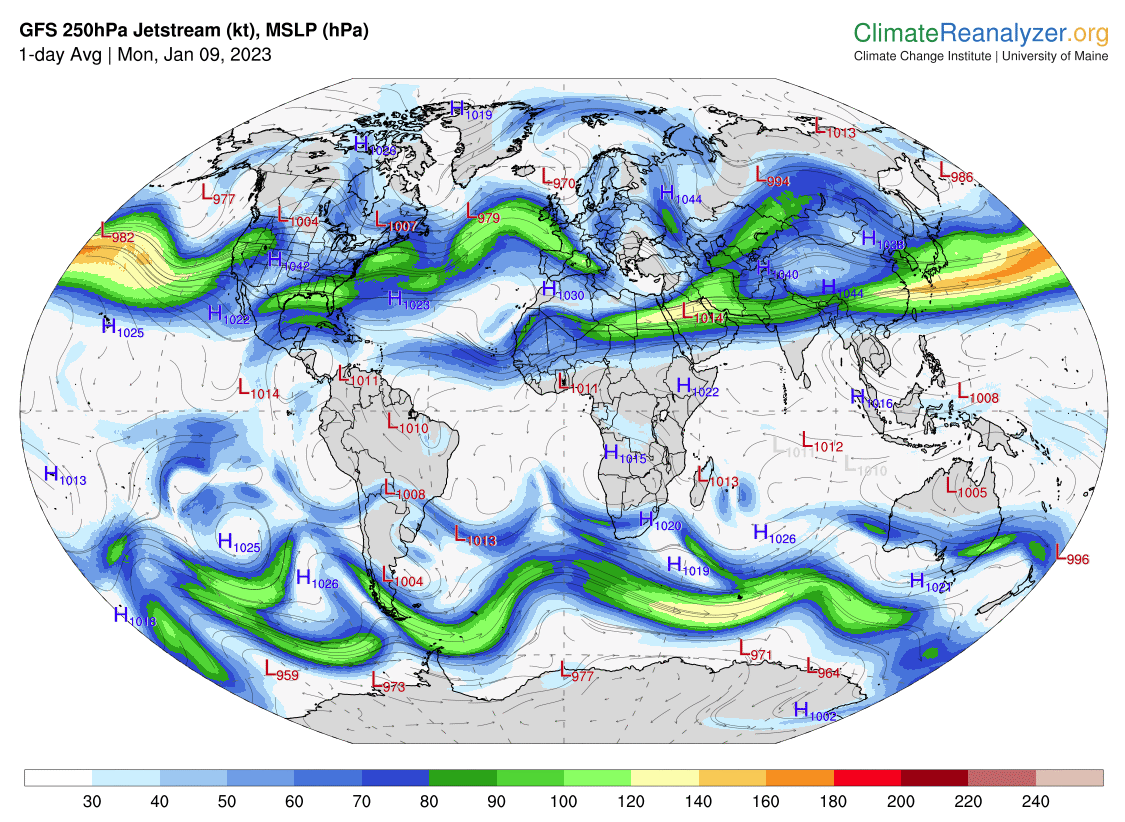
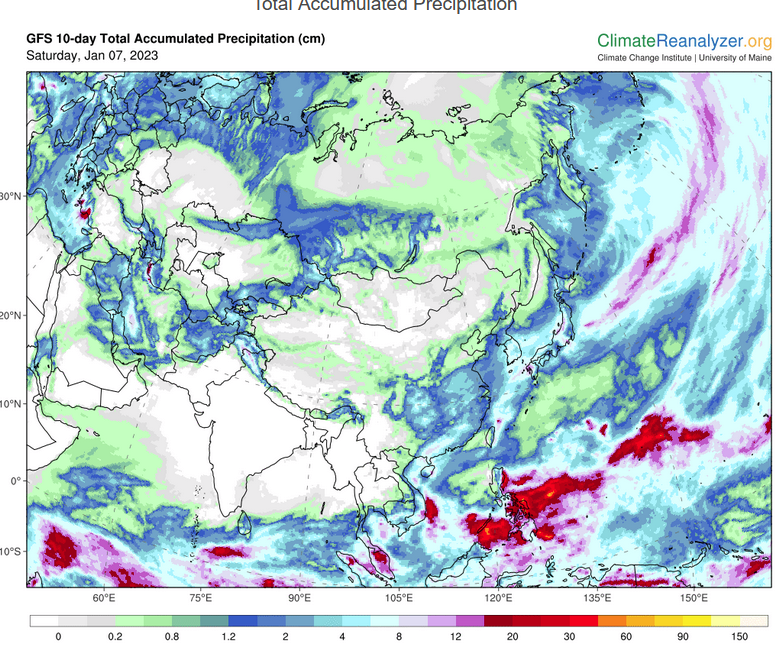
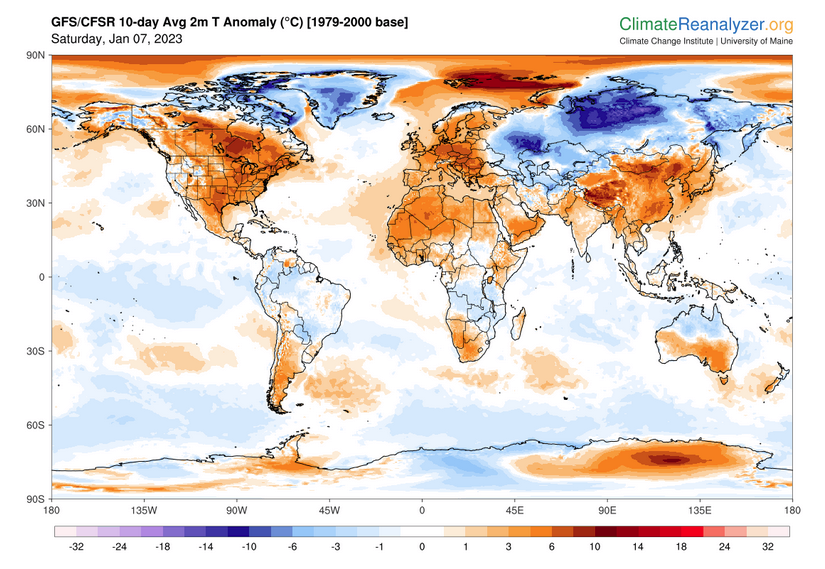
Below are the current precipitation forecast and the 10-Day forecasts for temperature and precipitation. Updates and additional information can be obtained HER E
Much of this information is provided by the University of Maine. They draw upon many different sources.
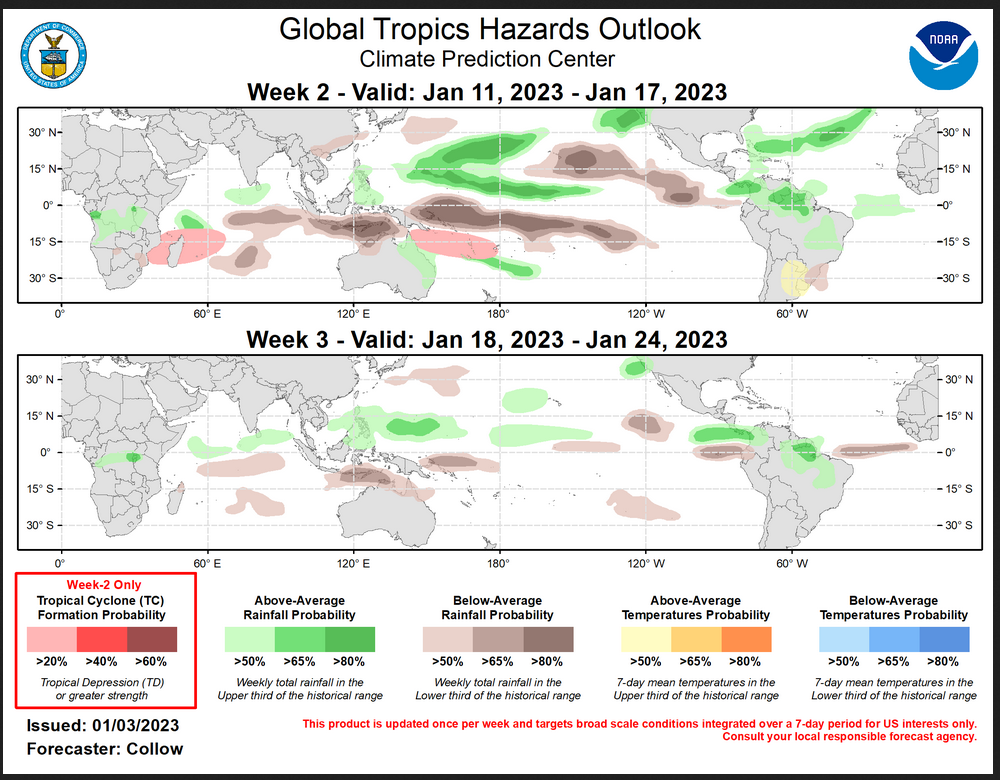
Worldwide Tropical Forecast (This is a NOAA Product)
This graphic updates on Tuesdays) If it has not been updated, you can get the update by clicking here Readers will only have to do that if they are reading this article much later than the date of it being published.
–
| I hope you found this article interesting and useful. |


