Updated at 6:49 p.m EST Tuesday, December 27, 2022 (regular Nightly Report will start tonight) (End of Month Report will be published Saturday Night)
Once a week we show many of the actual forecast maps not just provide the links to these maps. This makes it easier for the reader. Our report provides a separate forecast for Day 1, Day 2, Day 3 and Days 1-5, Days 6 -10, Days 8 – 14, and weeks 3 and 4. We also include a next-day and 10-Day Global Average Temperature and Cumulative Precipitation Forecast. This provides information that is useful to readers in terms of planning their activities for the weekend and the next 28 days. Over the weekend and into Monday there will be frequent updates of the short-term forecast.
Looking out 28 days, what we see is:
- For Temperature: Generally warm but the area that is warmer than normal declines in the second half of the 28 days.
- For Precipitation: Starts out wet but in the second half of the 28 days it reverts to a typical La Nina pattern of wetter to the north and drier to the south.

We start with the regular format of our weekend report. We will be doing selected updates all weekend. Links are generally provided so the reader can update any of the graphics themselves if we are late in doing the updates (plus often you will end up with a lot of additional information).
48-Hour Forecast
Daily weather maps can be updated by clicking Here for Day 1 and Here for Day 2. This link works also.
I will be doing the updating during the period described in the title of the article but if you happen to read this article later you can get updates via the links provided.
TUESDAY 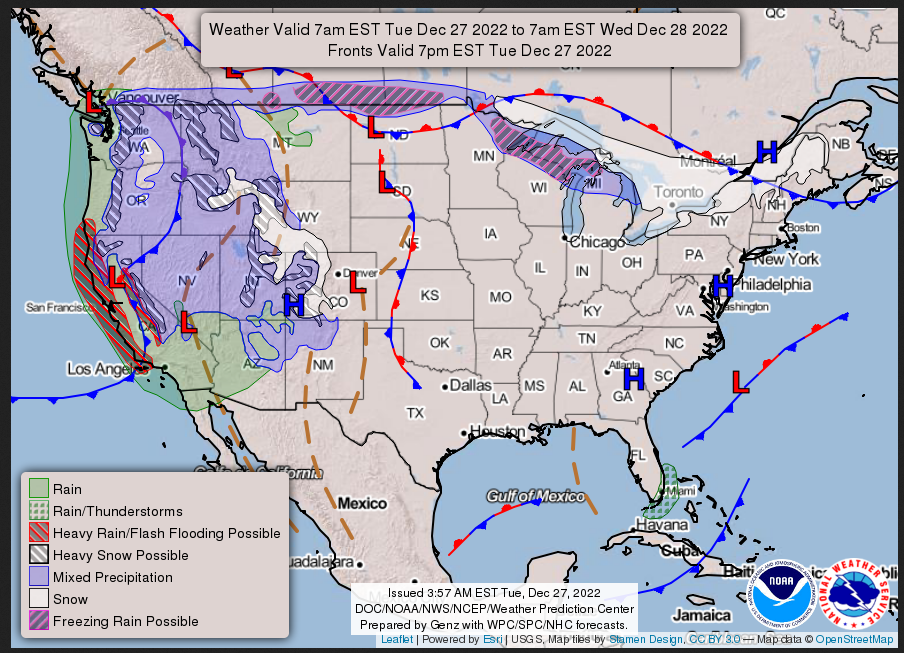
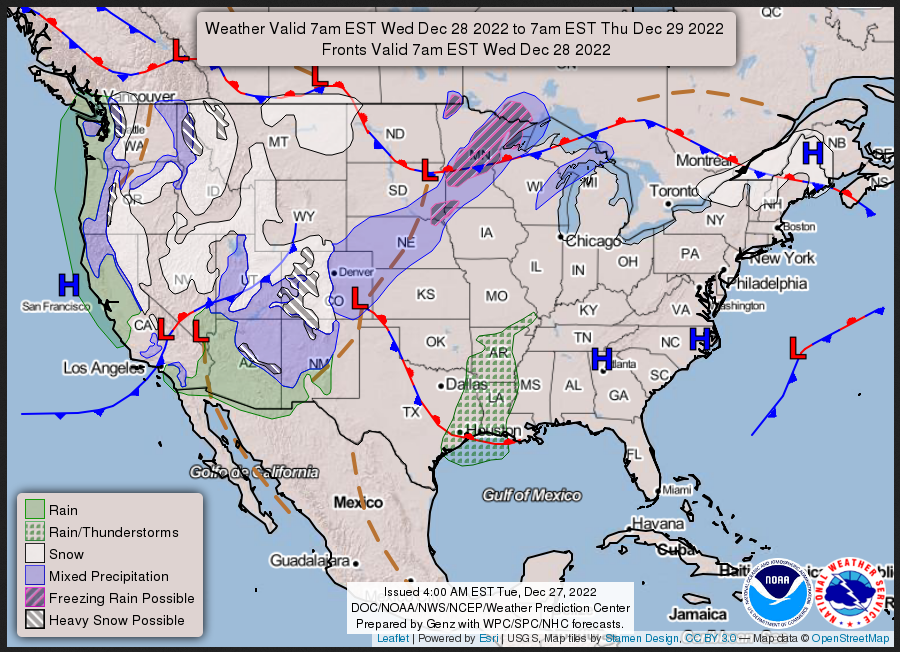
WEDNESDAY
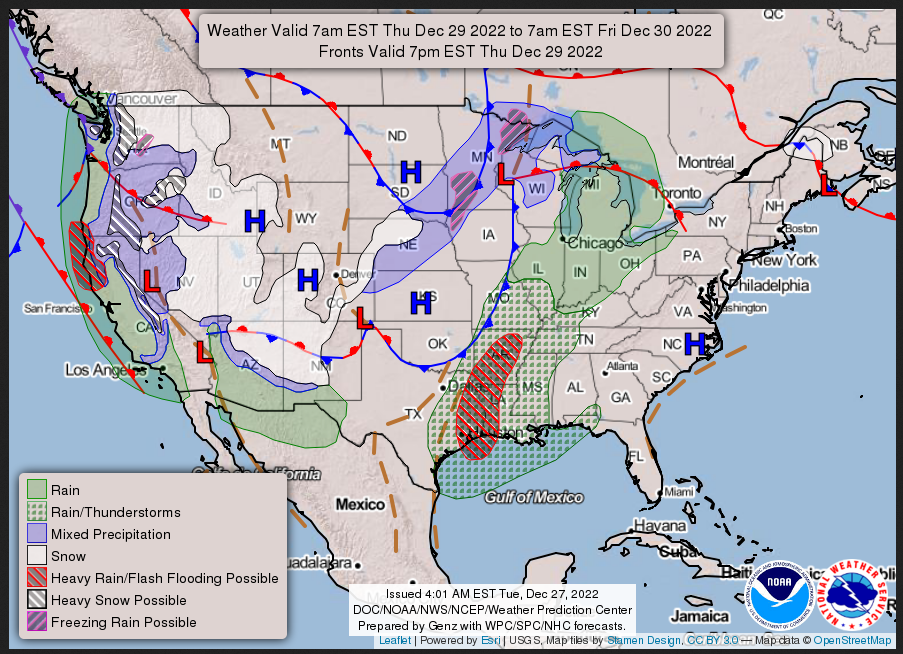
THURSDAY
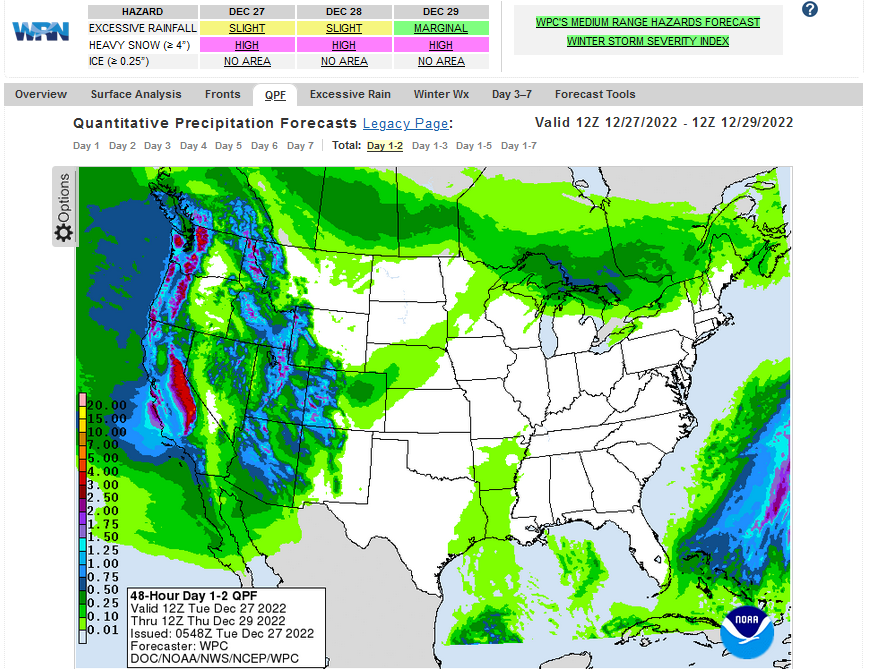
Below is the current two-day cumulative forecast of precipitation (Updates can be found HERE) Later we show a similar map that shows five days of cumulative precipitation. The images in the article are frozen but notice that if you go to the link provided you can get a variety of forecasts. That is true for many of the links provided in this article.
Here is the NWS Short Range Forecast (It is updated by NWS twice a day (a.m. and p.m) and these updates can be found here. We post at least one of those updates daily, over the weekend we usually post both.
Short Range Forecast Discussion
NWS Weather Prediction Center College Park MD
235 PM EST Tue Dec 27 2022

Valid 00Z Wed Dec 28 2022 - 00Z Fri Dec 30 2022

...Stormy and unsettled weather to impact the western United States and
Rockies...

...Increasing shower and thunderstorm chances across parts of the southern
Plains and lower Mississippi Valley by Thursday...

...Well above average temperatures to surge into the central and eastern
U.S. by mid-to-late week...

Much of the active weather over the next few days is expected to be
focused around the western half of the Nation as a pattern change ushers
in rain and mountain snow throughout the region, while the central and
eastern U.S. experiences a rapid warm up. A deep and fast-moving storm
system sweeping through the Intermountain West tonight is forecast to
continue producing moderate-to-locally heavy rain across the West Coast
and parts of southern/central California through early Wednesday. A few
scattered flash floods are possible, with the greatest chances for rapid
runoff and debris flows near recent burn scars. Additionally, heavy snow
is possible throughout the higher terrain of the Sierra Nevada, Cascades,
northern and central Rockies as moisture flows eastward along a potent
Pacific jet streak. After a brief lull on Wednesday, the next system to
move onshore the West Coast is anticipated to begin spreading
precipitation inland on Thursday. Additional heavy rain from central
California to the Pacific Northwest is forecast, along with another round
of moderate to heavy mountain snow. This unsettled weather pattern is
expected to linger into the upcoming weekend as well.

As an upper level trough ejects into the Great Plains on Thursday morning,
return flow from the Gulf of Mexico will allow for warm and moist air to
surge into eastern Texas and the lower Mississippi Valley. Showers and
thunderstorms should become more widespread and could lead to scattered
instances of flash flooding and the potential for isolated severe
thunderstorms into Thursday night. The region most at risk is centered
around the ArLaTex and extending around much of the lower Mississippi
Valley. SPC has issued a Marginal Risk (level 1/5) of severe
thunderstorms, with a Slight Risk (level 2/4) of excessive rainfall also
highlighting a similar area. Farther north, a warm front extending across
the northern tier from North Dakota to Maine may produce light instances
of snow and/or a wintry mix through Thursday.

After a bone chilling Christmas weekend, the final days of 2022 are
forecast to be much more comfortable and mild for a majority of the
central and eastern United States. As the aforementioned storm systems
impact the West and a high pressure system slides into the western
Atlantic, downsloping winds off the Rockies and warmer air from the Gulf
of Mexico will quickly kick out any lingering arctic air. High
temperatures around 20 degrees above average and into the upper 60s and
low 70s will first be felt over the southern Plains on Wednesday before
the warmer air spreads into the Midwest on Thursday. Mild overnight
minimum temperatures are also anticipated to help encourage the
late-December thaw. Low temperatures are expected to remain above freezing
as far north as the lower Great Lakes and Interior Northeast by Thursday.
This animation shows how things may play out over the next 60 hours. To update click here.

| Temperature (Maximum or Minimum Anomaly) for Days 3 – 7 |
Precipitation (Five days of cumulative precipitation) |
| https://www.wpc.ncep.noaa.gov/medr/medr_mean.shtml | https://www.wpc.ncep.noaa.gov/qpf/day1-7.shtml |
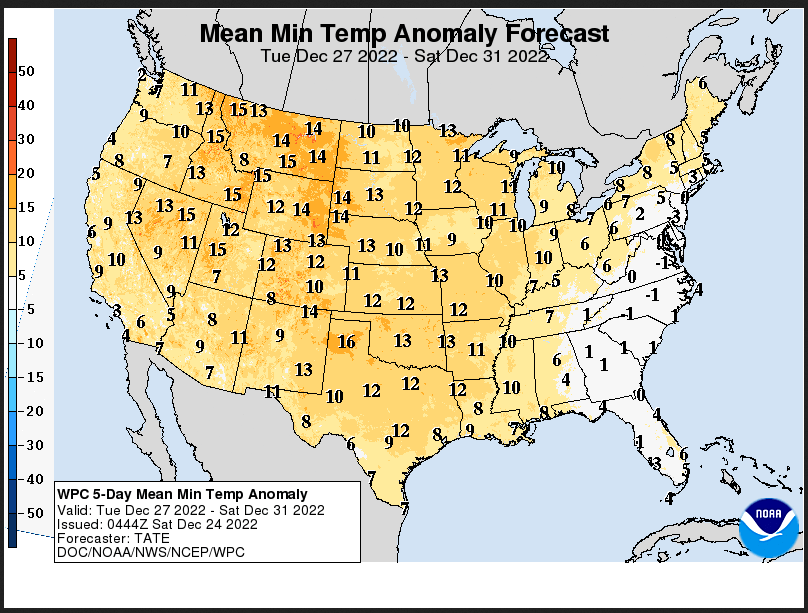
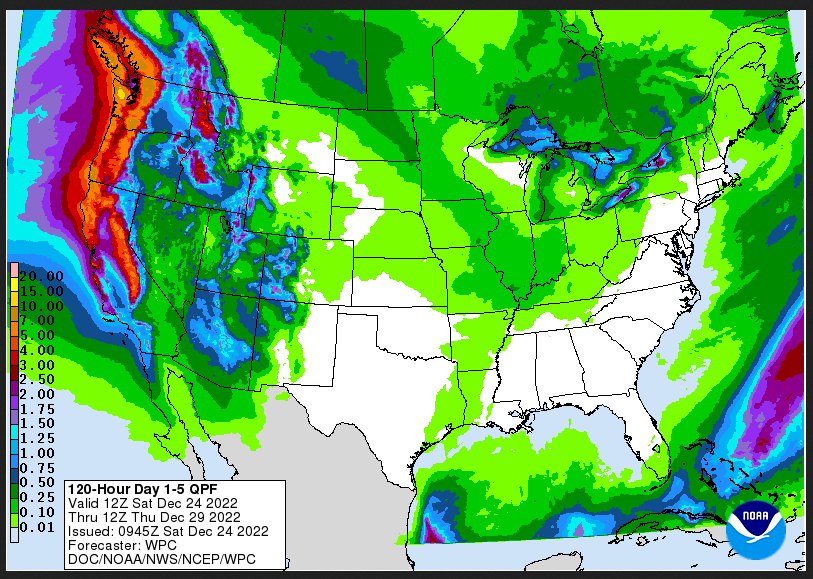
| Notice the warm minimums. It is wet as the Atmospheric River impacts the West. |
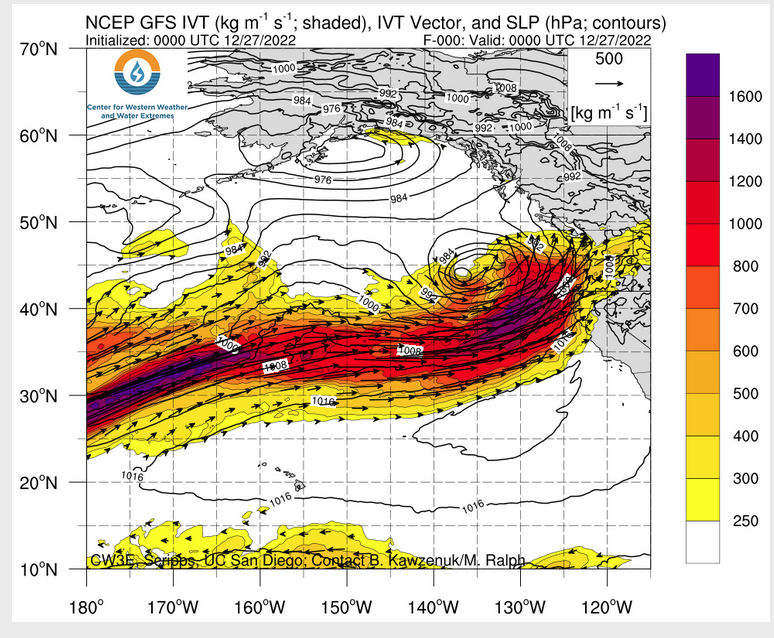
ATMOSPHERIC RIVERS
 —
—
Now we look at Intermediate-Term “Outlook” maps for three time periods. Days 6 – 10, Days 8 – 14, and Weeks 3 and 4. An outlook differs from a forecast based on how NOAA uses these terms in that an “outlook” presents information as deviation from normal and the likelihood of these deviations.
I have provided the maps so you do not need to click to get them. But they do not update daily. But you can get the current images simply by clicking on the links provided. Then hit the return arrow at the upper left of your screen to return to the article. There is no need to do that right away since what is published today is up to date as of the original publish date so they can be updated during the weekend if you want. It is probably not necessary to do that. The Week 3 – 4 Outlook only updates on Fridays.
Below are the links to obtain updates and additional information. They are particularly useful if you happen to be reading this article significantly later than when it was published. I always try to provide readers with the source of the information in my articles.

 –
–
| Warm and wet. That is a big change |
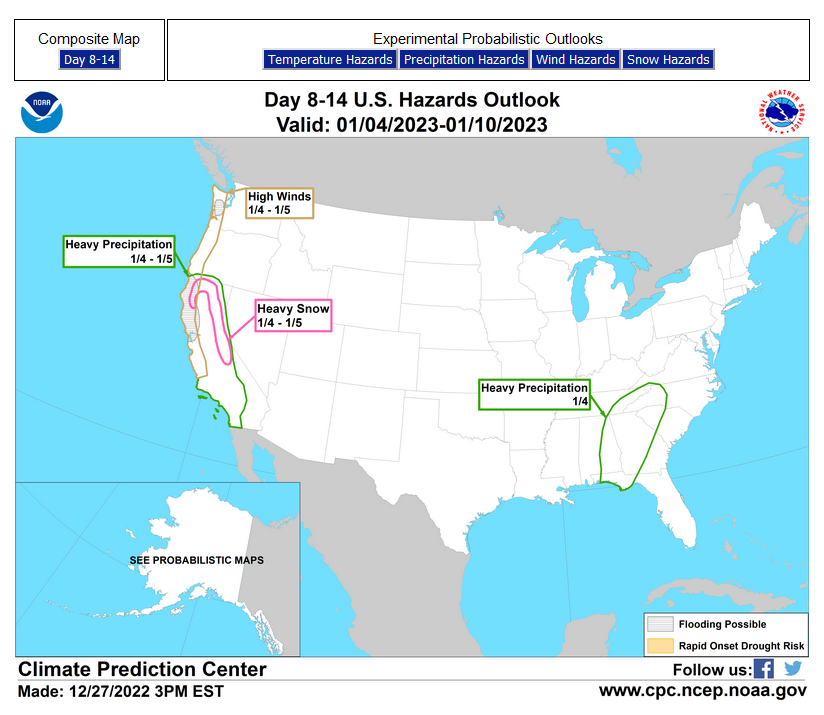
Looking at Weeks 8 – 14 Day
Now Precipitation
| Still warm and wet but the warm is not as consistent. |
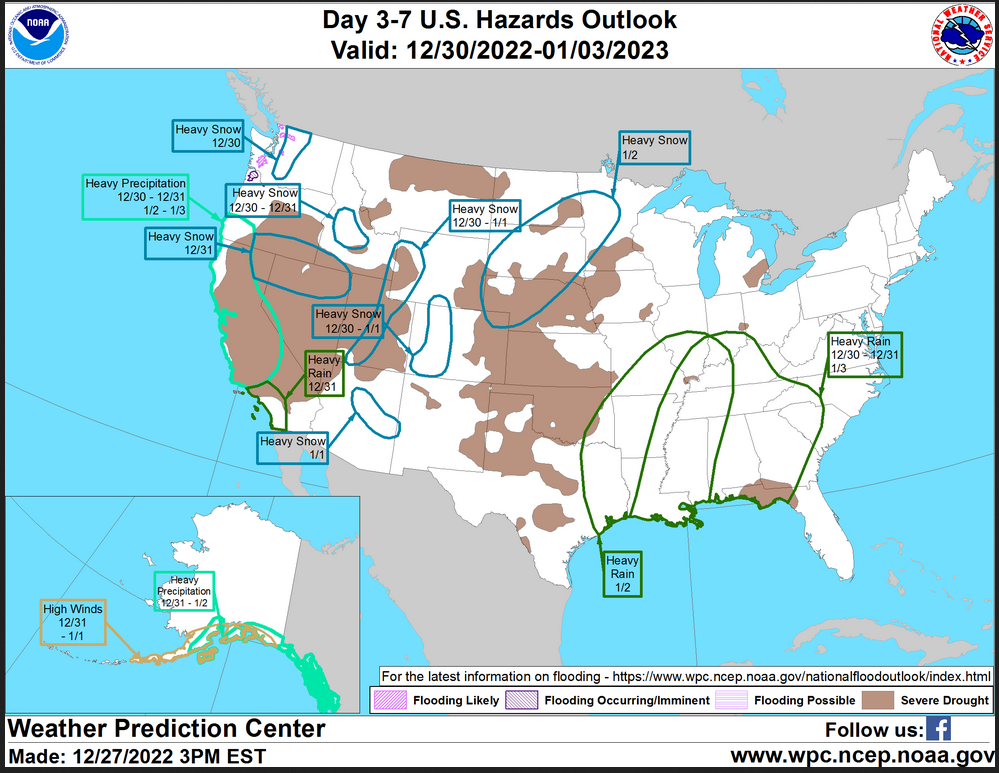
HAZARDS OUTLOOKS
Click here for the latest complete Day 3 -7 Hazards forecast which updates only on weekdays. Once a week probably Monday or Tuesday I will update the images. I provided the link for readers to get daily updates on weekdays. Use your own judgment to decide if you need to update these images.
Now we address Weeks 3 and 4. This is a time frame that is very important. It is half of the 28-Day forecast period. That is why we include the discussion that accompanies the maps.
–
Mostly warm but the wet has gone and the Southwast Drought reappears. –
Here is the discussion releases with the maps.
Prognostic Discussion for Week 3-4 Temperature and Experimental Precipitation Outlooks
NWS Climate Prediction Center College Park MD
300PM EST Fri Dec 23 2022Week 3-4 Forecast Discussion Valid Sat Jan 07 2023-Fri Jan 20 2023
La Niña conditions remain the primary driver of anomalous tropical convection, with enhanced trade winds and suppressed rainfall persisting across the equatorial Pacific near the Date Line. The MJO remains active, however, with the enhanced convective phase now crossing the Maritime Continent, resulting in constructive interference with the La Niña base state. Dynamical model MJO index forecasts generally show continued eastward propagation of the signal, with high uncertainty regarding the amplitude of the signal. Given the robust interference with the base state, the MJO influence is likely to be more pronounced away from the Equator. Therefore, the MJO is likely to continue teleconnecting into the midlatitudes and may play a role in the evolution of the Weeks 3-4 pattern.
Despite the constructive interference of the MJO with the La Niña base state, the 500mb height anomaly forecasts from the suite of operational dynamical models are decidedly unlike the canonical response to La Niña. The ECMWF, GEFS, and CFS are broadly consistent, placing a strong ridge south of the Aleutians and a downstream ridge over western North America. A weakness in the height pattern may extend over portions of the Southeast or eastern Seaboard, while a robust positive NAO type couplet of negative height anomalies over Greenland and positive height anomalies over the North Atlantic extends east of North America. This overall pattern favors anomalous southerly flow across Alaska and reduces the potential for outbreaks of Arctic air into the United States during the Weeks 3-4 period.
A manual blend of dynamical and statistical guidance results in a fairly warm pattern across the U.S., with the highest probabilities of above-normal temperatures across the West. Above-average temperatures are also favored across the Northeast, consistent with the positive NAO pattern. The weakness in the height field across the Southeast suggests the potential for Canadian air intrusions into portions of the eastern United States, and though there may not be a large pool of cold air that could result in widespread below-average temperatures, these frontal intrusions may result in below-average temperatures across the Florida peninsula. Above-average temperatures are favored for Alaska with anticipated southerly flow. Confidence in this forecast decreases considerably during Week 4, as the MJO evolution could effect a pattern change; however, the lack of cold air across Canada during Week-3 may help prevent a rapid shift towards a colder pattern until after the Week-4 period.
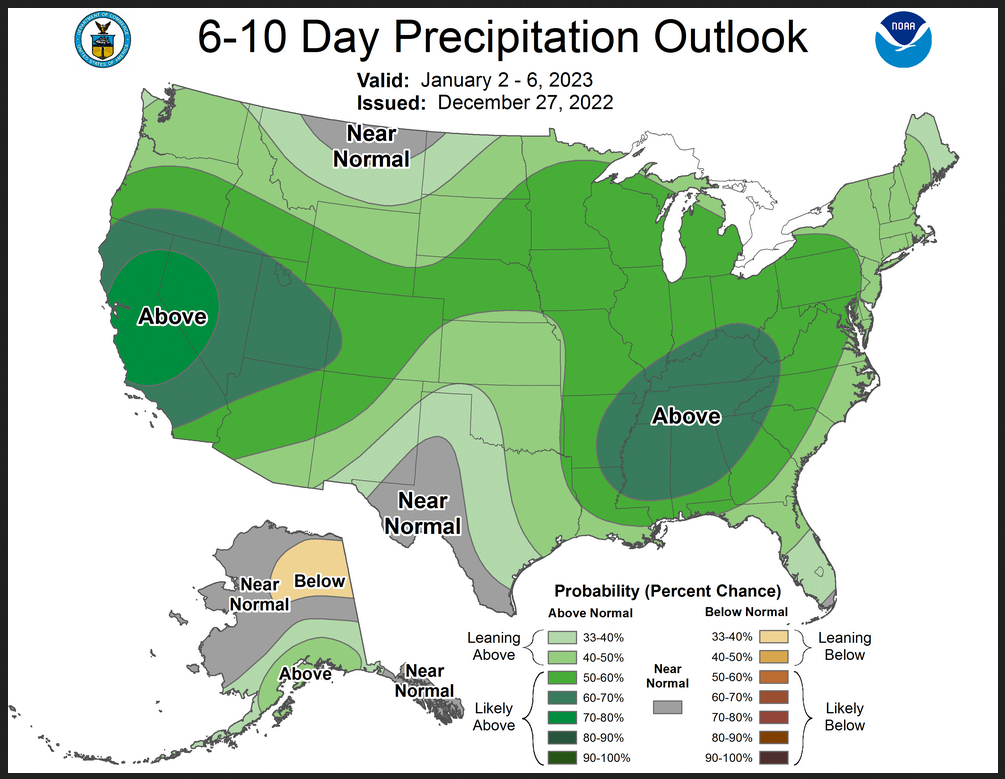
Dynamical and statistical guidance favors above-average precipitation for the Northwest, with many models extending a wet signal across the entire northern tier of the CONUS. The GEFS and ECMWF both depict a dry signal along the Mississippi Valley, Midwest, and Great Lakes. Therefore, above-average precipitation is favored for the Northwest and portions of the Northern Plains, but equal chances are maintained across the Midwest and Great Lakes. Below-average precipitation is favored for the south-central CONUS, while an offshore storm track over the North Atlantic may bring opportunities for above-average precipitation along the coastal Northeast. Southerly flow over Alaska favors a wetter than average pattern, particularly across the southern half of the state.
Both operational models and the multi-model ensemble of the Subseasonal Experiment suite (Sub-X MME) depict broad ridging over the Hawaiian Islands during Weeks 3-4. This ridge, coupled with above-average sea surface temperatures, favors above-average temperatures and below-average precipitation for Hawaii.
–
| It is important to note that the Week 3 -4 Outlook is prepared by a different team than the 6 -10 and 8 – 14 day Outlooks as well as the update of the monthly outlook. |
Month to Date Information
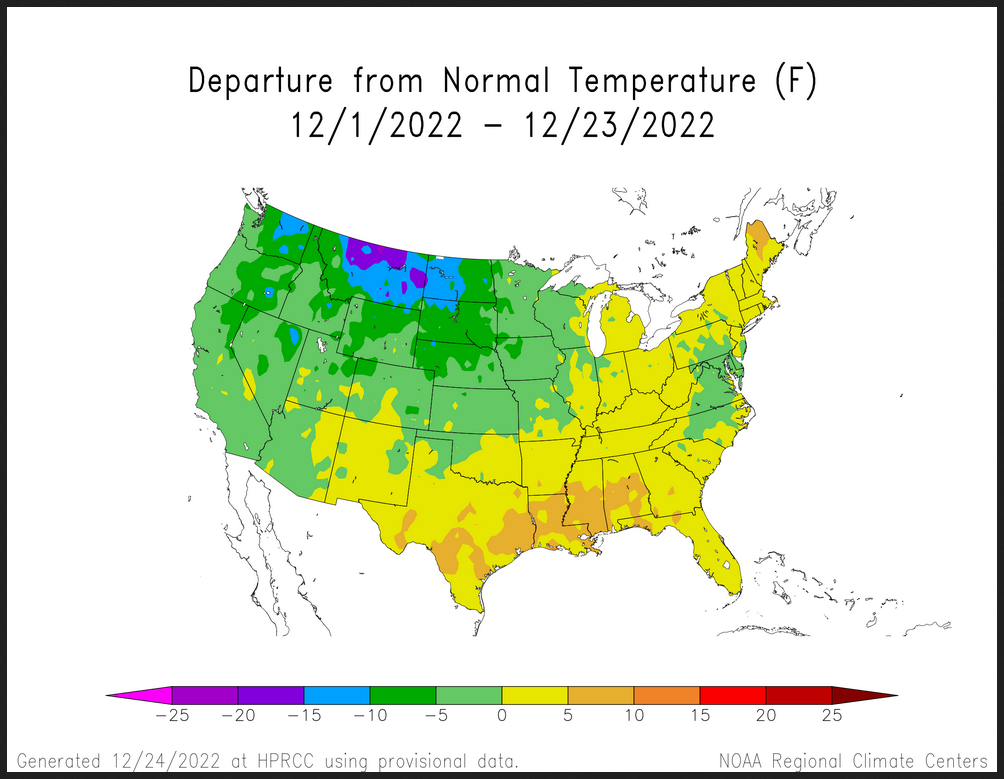
Temperature month to date can be found at https://hprcc.unl.edu/products/maps/acis/MonthTDeptUS.png
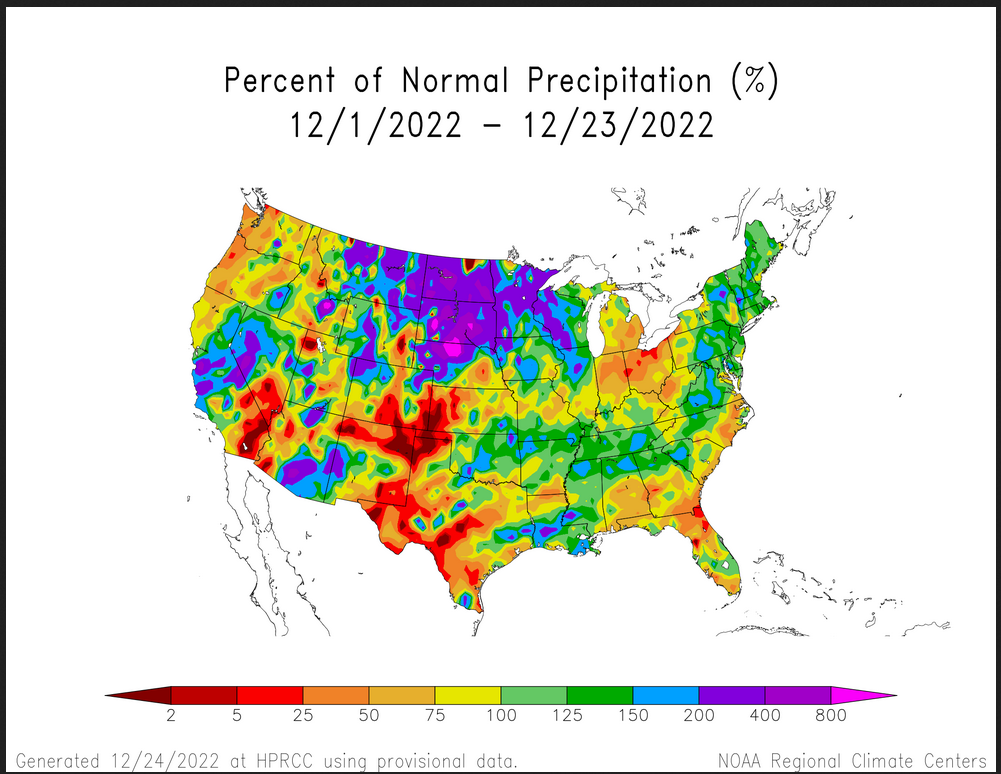
Precipitation month to date can be found at https://hprcc.unl.edu/products/maps/acis /MonthPNormUS.png
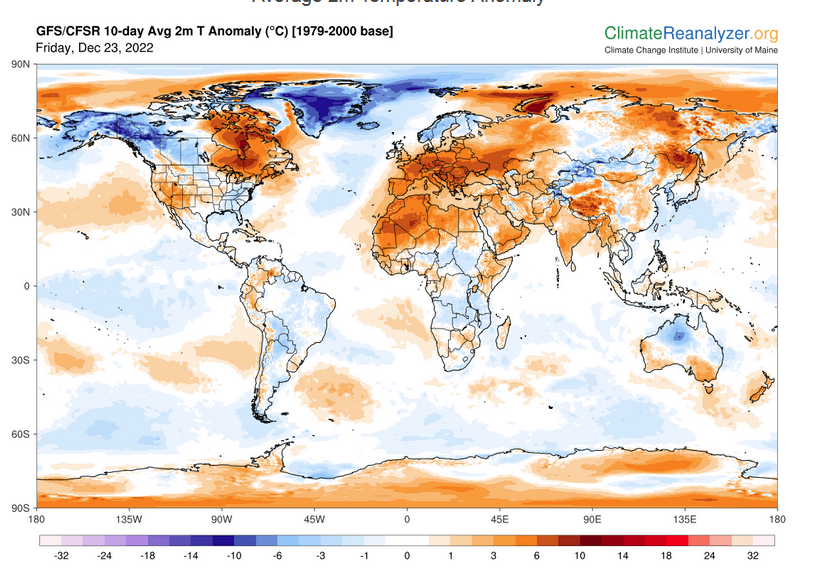
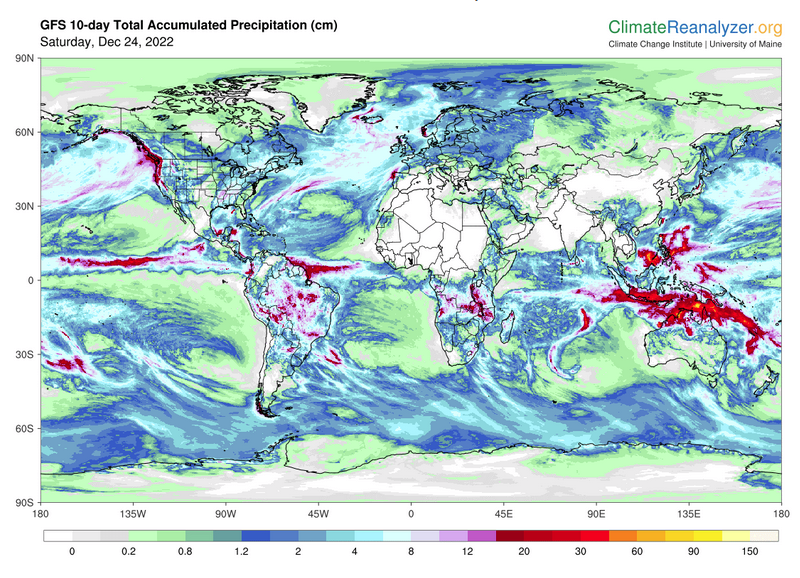
World Forecast
Below are the current precipitation forecast and the 10-Day forecasts for temperature and precipitation. Updates and additional information can be obtained HERE
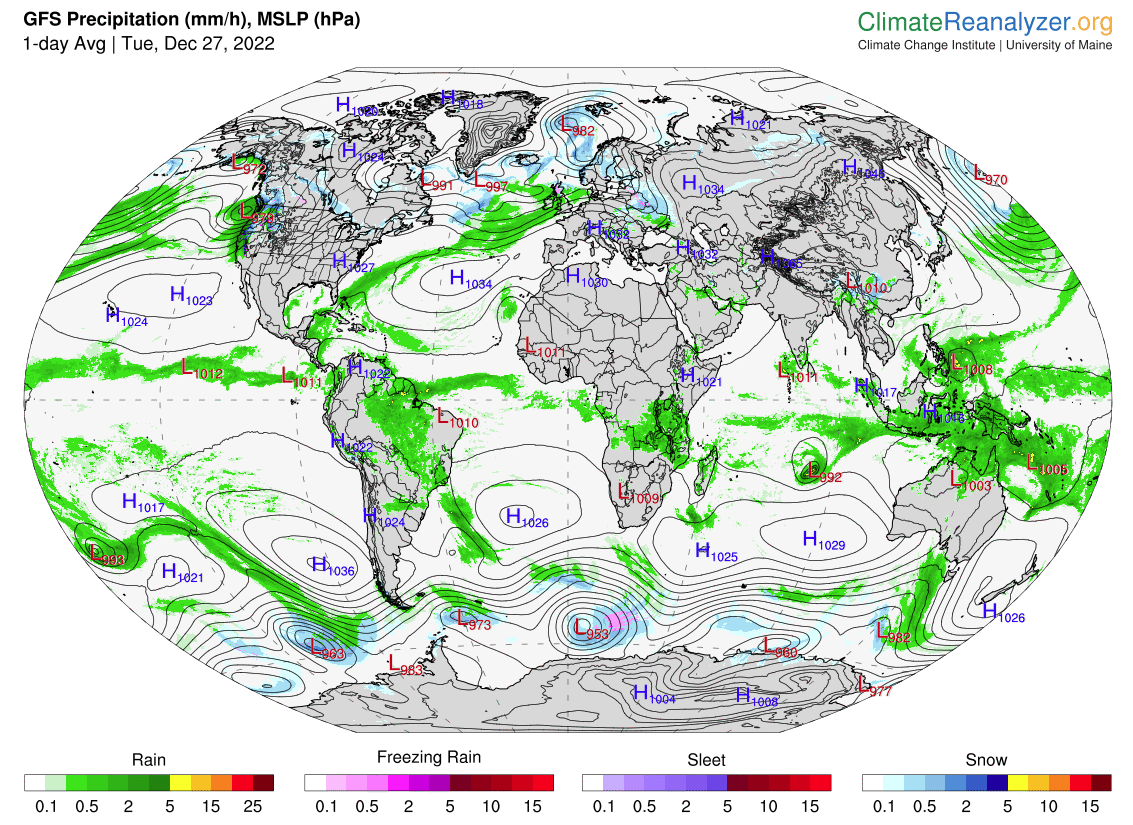
. Much of this information is provided by the University of Maine. They draw upon many different sources.
Worldwide Tropical Forecast (This is a NOAA Product)
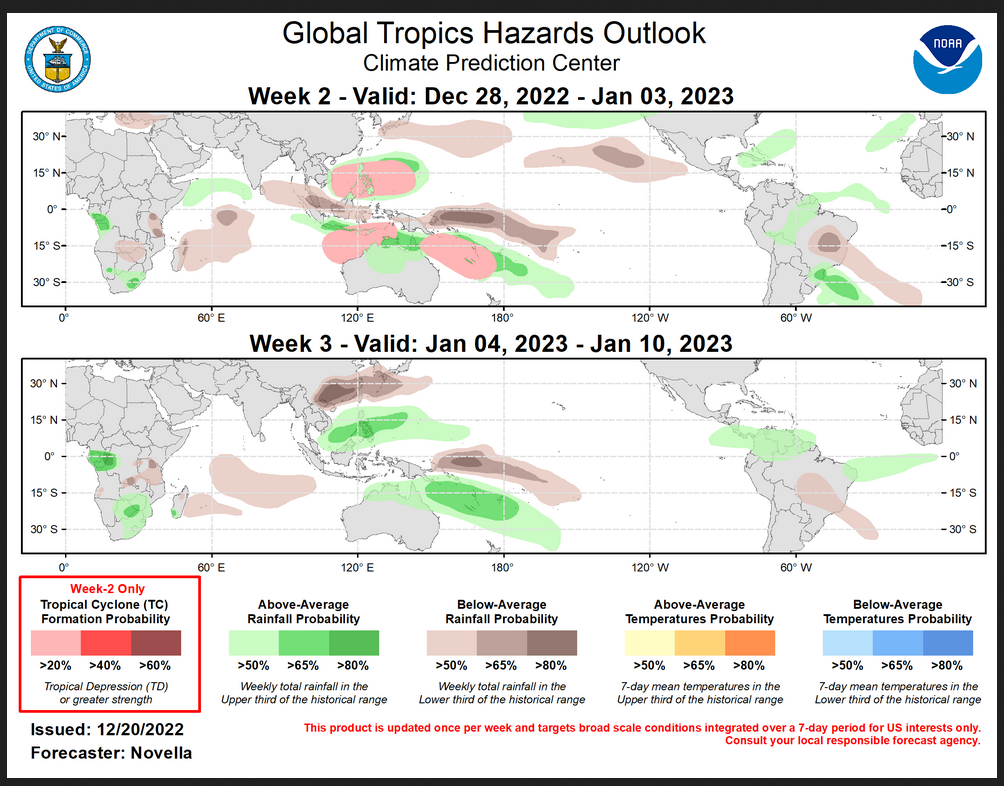
This graphic updates on Tuesdays) If it has not been updated, you can get the update by clicking here Readers will only have to do that if they are reading this article much later than the date of it being published.
| I hope you found this article interesting and useful. |
