La Nina Winter, then ENSO Neutral and then maybe something else (this is very little change from last month’s assessment)
Today is the third Thursday of the month so right on schedule NOAA has issued what I describe as their Four-Season Outlook. The information released also includes the MId-Month Outlook for the single month of January plus the weather and drought outlook for the next three months. I present the information issued and try to add context to it. It is quite a challenge for NOAA to address the subsequent month, the subsequent three-month period as well as successive three-month periods for a year or a bit more.
We will begin to see the impacts of the end of La Nina for precipitation in March/April/May of 2023 and for temperature in May/June/July of 2023.
The maps show a series of changes which I have highlighted in my comments. Next winter will be very different than this winter.
It is very useful to read the excellent discussion that NOAA issues with this Seasonal Outlook. NOAA seems to be more confident about making predictions beyond six months. They even predict a good Southwest Monsoon next summer which they never used to do this far in advance.

| The current weather report is available now HERE. To return to this article hit the return arrow in the upper left-hand corner of your screen. |
First, let’s Take a Look at the Mid-Month Outlook for January
Combination Mid-Month Outlook for January and the Three-Month Outlook
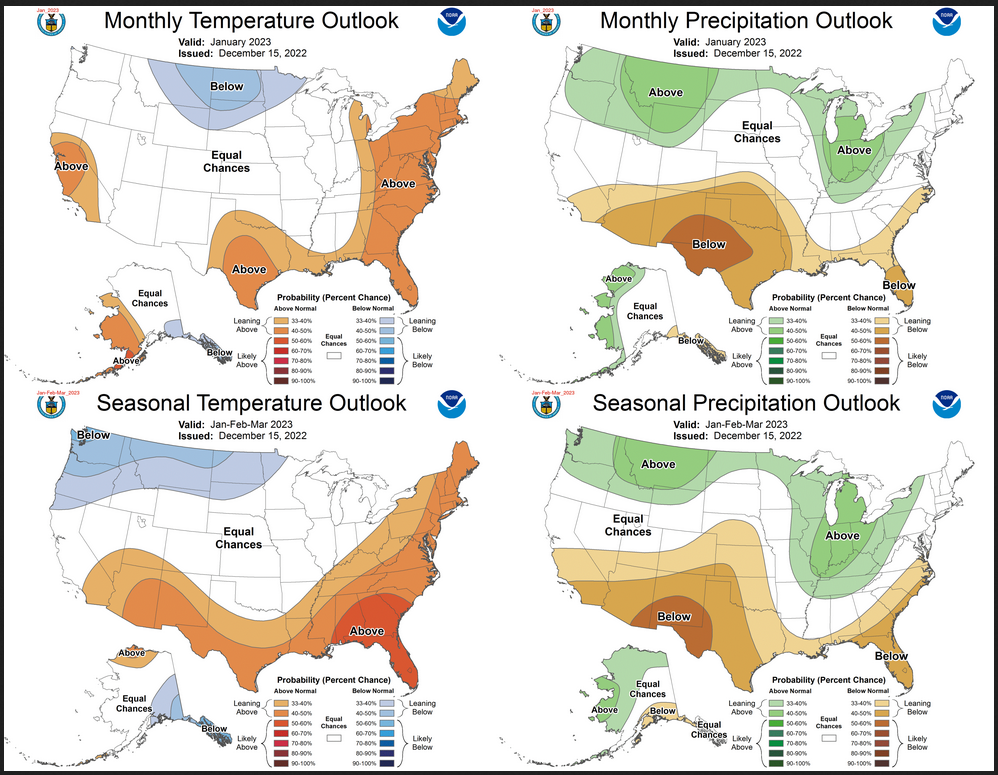
The top row is what is now so-called the Mid-Month Outlook for January which will be updated at the end of December. There is a temperature map and a precipitation map. The second row is a three-month outlook that includes January. I think the outlook maps are self-explanatory. What is important to remember is that they show deviations from the current definition of normal which is the period 1991 through 2020. So this is not a forecast of the absolute value of temperature or precipitation but the change from what is defined as normal or to use the technical term “climatology”.
| Notice that for precipitation, the January and three-month outlooks are quite similar. It is somewhat the same situation for temperature but not for the West and Alaska. |
| For both temperature and precipitation, if you assume the colors in the maps are assigned correctly, it is a simple algebra equation to solve the month two/three anomaly probability for a given location = (3XThree-Month Probability – Month One Probability)/2*. So you can derive the month two/three outlook this way. You can do that calculation easily for where you live or for the entire map. |
Here are larger versions of the Temperature and Precipitation outlook maps for the single month of January.
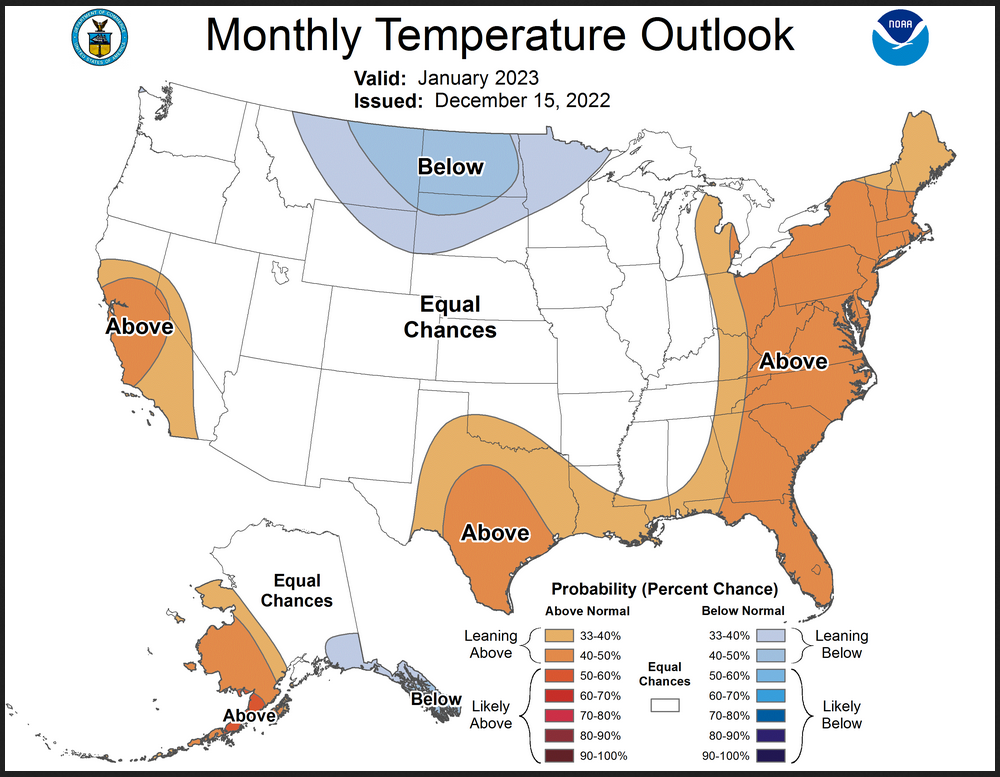
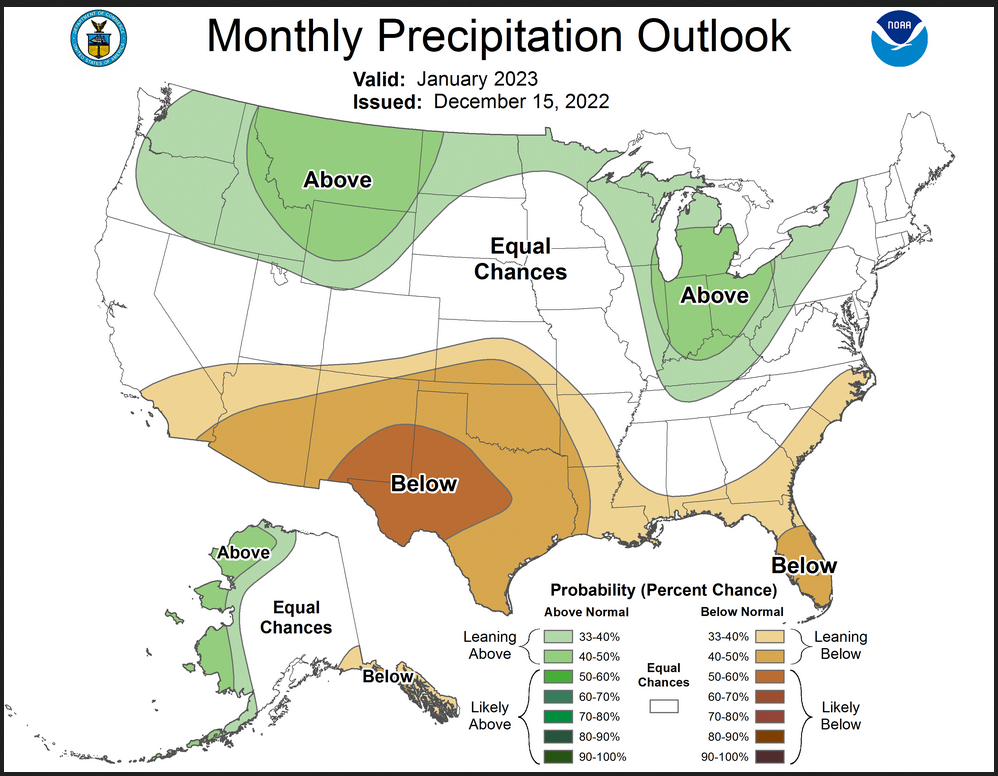
The maps are pretty clear in terms of the outlook.
And here are large versions of the three-month JFM 2023 Outlook
First temperature followed by precipitation.
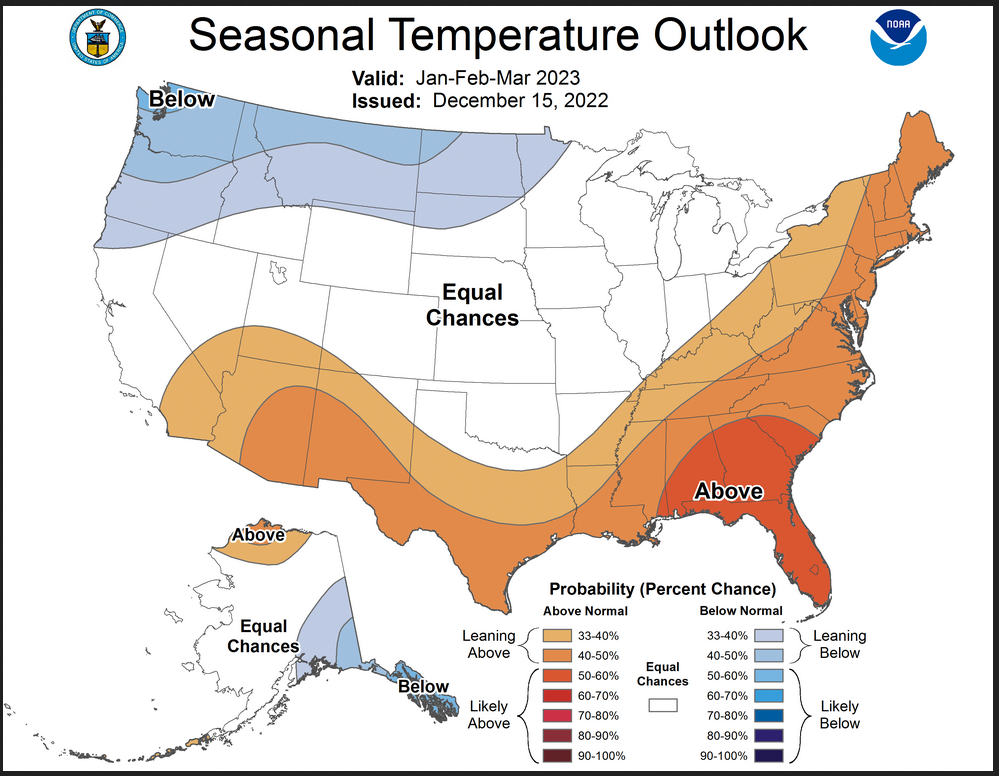
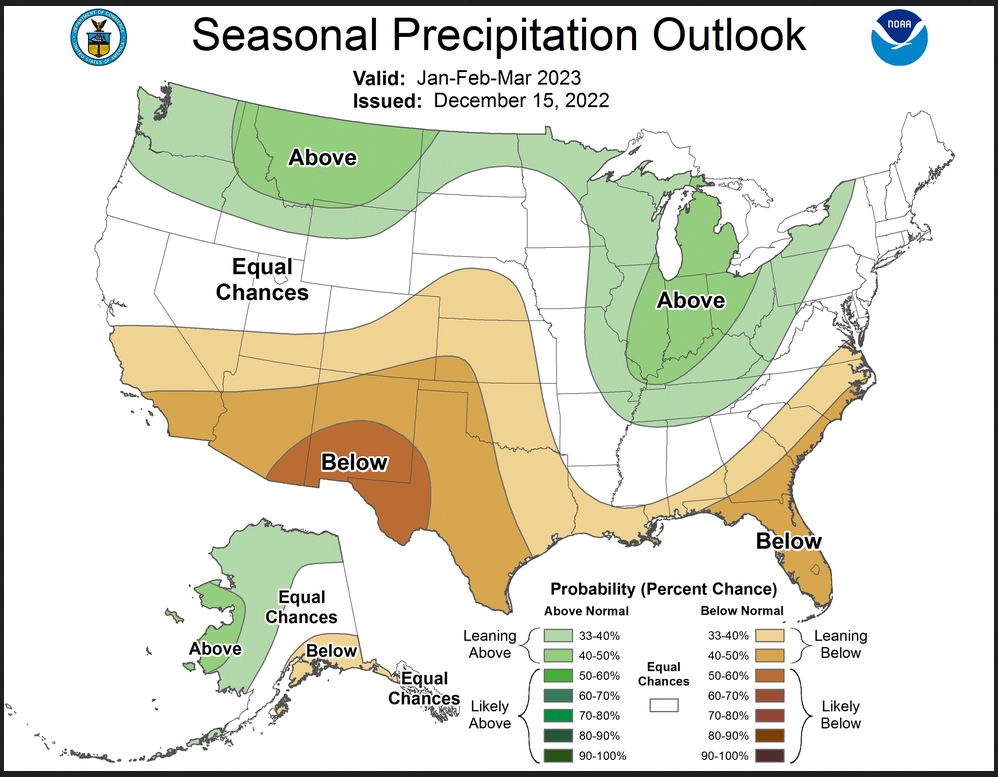
The maps are larger versions of what was shown in the first graphic that had smaller versions of all four of these maps.
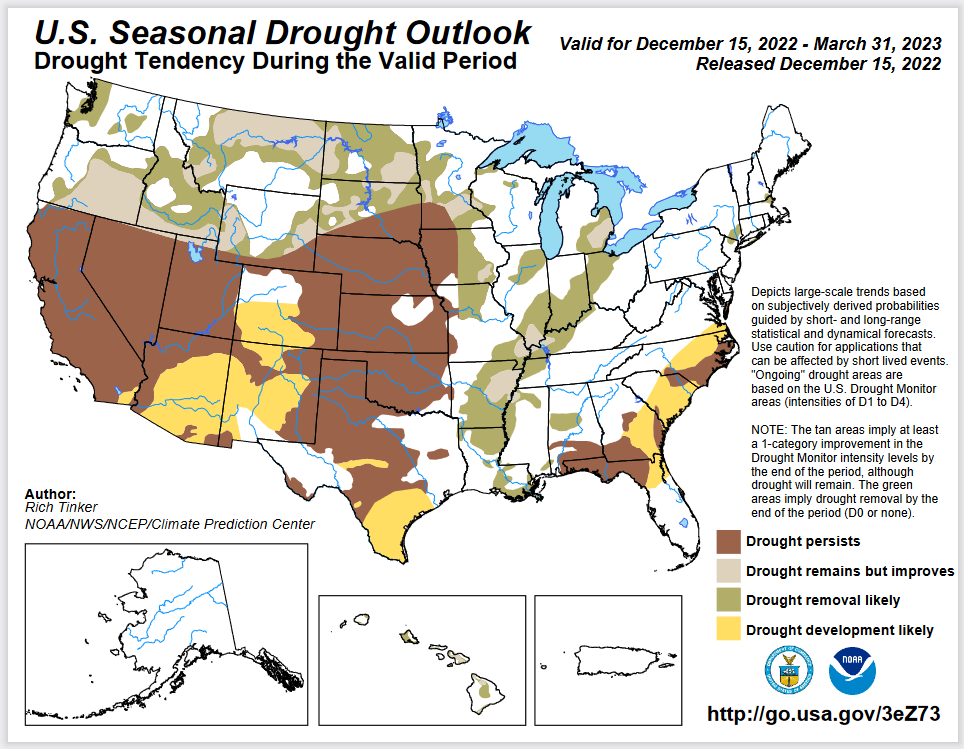
Drought Outlook
–
|
The yellow is the bad news. And there is some of that. But the area with drought improvement seems about the same size or a little larger.
|
Short CPC Drought Discussion
Latest Seasonal Assessment – Conditions were cooler and weather over the last four weeks compared to earlier this autumn. In particular, stormy weather impacted the western U.S., and heavy precipitation was common along parts of the Mississippi, Tennessee, and Ohio River Valleys. Toward mid-December, a potent storm system affected the western and central states. Heavy precipitation and strong winds affected a large part of the Central and Western States, particularly impacting the Far West and the northern Plains. A few feet of snow piled up on some of the higher elevations in the Sierra Nevada while blizzard conditions developed over the northern Plains. Lower elevations recorded heavy rainfall, particularly along the central California coast, where a few sites south of San Francisco reported 5 to 7 inches of rain. Farther east, a couple of potent systems dropped heavy precipitation on many drought areas from the southern Plains eastward to the Appalachians. As a result, more drought areas saw improvement than deterioration. This included several regions from the Rockies westward, much of the northern and southern Plains, part of the middle and lower Mississippi Valley, and areas along and just west of the spine of the Appalachians. A few areas missed most of the precipitation, resulting in some patches of deterioration in the central Plains and in a swath from the Southeast northward through the eastern Great Lakes.
The forecast through March 2023 period is heavily influenced by the high potential for La Niña conditions to persist through a third Boreal winter season in a row. Climate anomalies associated with cold ENSO events are robust, and typically favor drier and warmer conditions along the southern tier of the CONUS, and wetter conditions for the Pacific Northwest, northern Rockies, the northern Plains, the Great Lakes, and from the middle Mississippi Valley eastward into the Ohio Valley. Meanwhile, the southern tier of states and the central Plains tend to be drier than normal. This would seem to make the forecast fairly straightforward, but there are complicating factors. Across the Plains and adjacent areas, January-March is climatologically drier than most other times of year, so precipitation anomalies have less impact on the moisture budget than during the wetter times of year. In addition, heavy precipitation is anticipated during the last half of December in a few areas that are typically drier than normal during La Niña episodes, particularly near the central Gulf Coast. The resulting forecast calls for improving conditions in the small patches of drought in New England and in a swath across the northern tier of the country from the Pacific Northwest through the Great Lakes Region. Improvement is also anticipated in the Mississippi and Ohio River Valleys, where heavy precipitation is expected over the next 1-2 weeks. Expected above-normal precipitation in Hawaii should bring some improvement there as well. In contrast, drought areas across the central Plains and the southern tier of states are expected to persist or deteriorate, with some expansion anticipated into parts of the South Atlantic Coast, central and southern Texas, part of the southern High Plains, portions of the central and southern Rockies, and southeastern California.
Looking out Four Seasons.
Twelve Temperature Maps. These are overlapping three-month maps (larger versions of these and other maps can be accessed HERE)
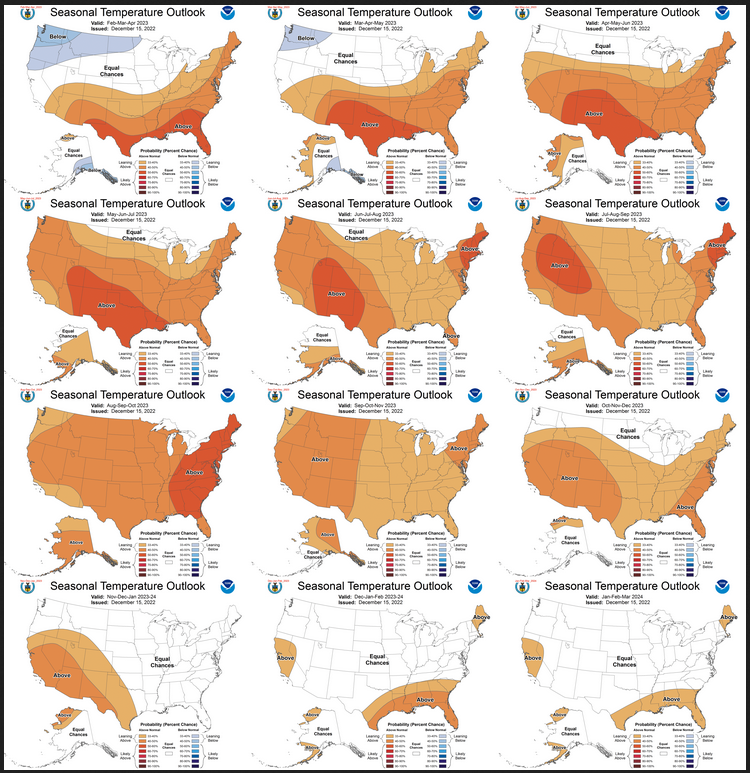
Notice that this presentation starts with February/March/April 2023 (FMA since JFM is considered the near-term and is covered earlier in the presentation. The changes over time are generally discussed in the discussion but you can see the changes easier in the maps.
| I see a number of points in time where the pattern significantly changes and they are MJJ 2023, JJA 2023, OND 2023, NDJ and DJF 2023/2024. The MJJ 2023 change is one month earlier than shown last month probably due to a prediction that La Nina will change to ENSO Neutral a month earlier. |
Comparing the new outlook with the prior Outlook,
The 12 temperature maps that were released last month.
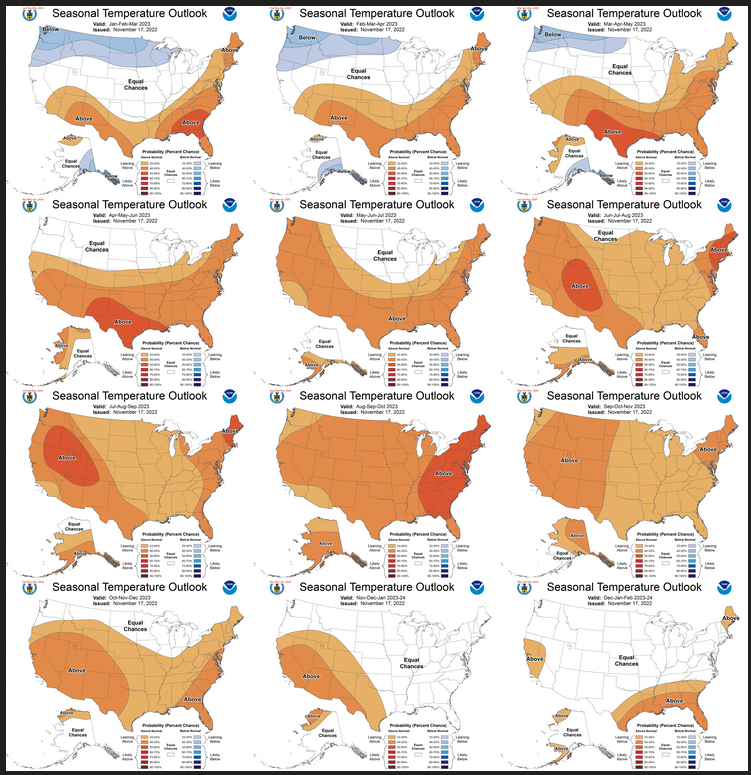
I have been showing the current set of outlooks with the prior set side by side. But I think the images are too small for most to be able to work with. I do the analysis so you do not need to but if you choose to do so the best way is to print out both maps. If you have a color printer that is great but not needed. What I do is number the images from last month 1 – 12 starting with “1” and going left to right and then dropping down one row. Then for the new set of images, I number them 2 – 13. That is because one image from last month in the upper left is now discarded and a new image on the lower right is added. Once you get used to it, it is not difficult. In theory, the changes are discussed in the NOAA discussion but I usually find more changes. It is not necessarily important.
Now the Twelve Precipitation Maps
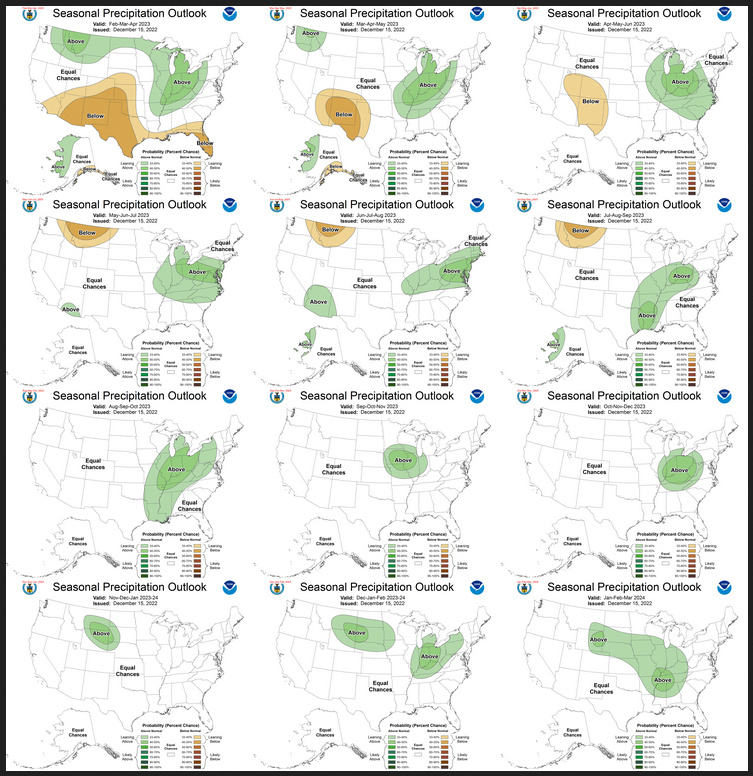
Similar to Temperature in terms of the organization of the twelve overlapping three-month outlooks.
| Similar to temperature, I see mostly similar major points in time where the pattern significantly changes and they are
MAM 2023, MJJ 2023, JAS 2023, OND 2023, SON 2023 and DJF 2023/2024. This is not changed from what was predicted last month. |
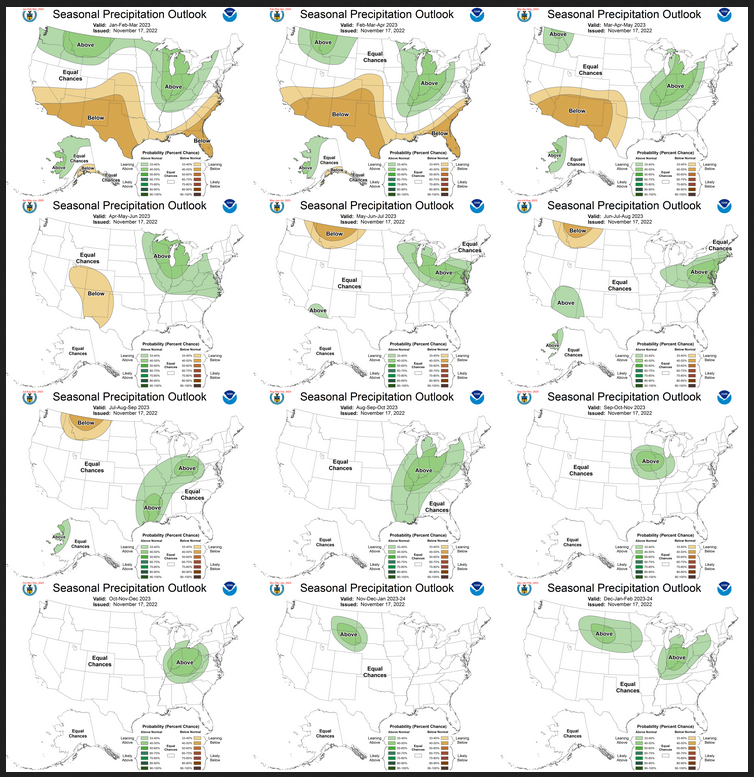
The maps that were released last month.
NOAA Discussion
Maps tell a story but to really understand what is going you need to read the discussion. I combine the 30-day discussion with the long-term discussion and rearrange it a bit and add a few additional titles (where they are not all caps the titles are my additions). Readers may also wish to take a look at the article we published last week on the NOAA ENSO forecast. That can be accessed here.
I will use bold type to highlight some things that are especially important. My comments, if any, are enclosed in brackets [ ].
CURRENT ATMOSPHERIC AND OCEANIC CONDITIONS
Below-average SSTs persisted across the equatorial central and eastern Pacific. Recent observed SST anomalies in the Niño 3.4 region are at -1.0 degrees Celsius. Subsurface temperature anomalies (averaged from 180-100W and 0-300 meters) remained at near -1.0 degrees Celsius from August through October but these negative anomalies weakened during November. Positive subsurface temperature anomalies have steadily expanded eastward since mid-October. Positive OLR anomalies (suppressed convection and precipitation) continue over the equatorial west-central Pacific with weak negative OLR anomalies (enhanced convection and precipitation) throughout Indonesia and Southeast Asia. Although enhanced trade winds weakened slightly during late November due to the Madden-Julian Oscillation, the anomalous low-level easterlies resumed by early December. These atmospheric and oceanic conditions reflect a continuation of La Niña.
SST anomalies are positive over the North Pacific and near the Aleutians. Positive SST anomalies, present earlier in the fall along the West Coast, have moderated to near average. Positive SST anomalies persist over the Gulf of Mexico and along the East Coast with the largest anomalies offshore of the Mid-Atlantic and New England.
PROGNOSTIC DISCUSSION OF SST FORECASTS
The CPC SST consolidation forecast for Niño 3.4 depicts decreasing negative anomalies through the spring 2023 as a transition to ENSO-neutral conditions are predicted to occur. The CFS model favors a faster warming trend with positive anomalies exceeding +0.5 degrees Celsius by June-July-August 2023. The North American Multi-Model Ensemble (NMME) ensemble mean forecast is more similar to the CPC consolidation. Based on the latest observations and model forecasts, the CPC official ENSO outlook indicates a 50-50 split for either La Niña or ENSO-neutral conditions during January-February-March 2023. ENSO-neutral conditions become the most likely outcome (near 70 percent) by February-March-April 2023.
PROGNOSTIC TOOLS USED FOR U.S. TEMPERATURE AND PRECIPITATION OUTLOOKS
The temperature and precipitation outlooks for JFM 2023 were based on dynamical model guidance such as the NMME and statistical tools, including the global SST based Constructed Analog (CA) and experimental Calibration, Bridging, and Merging (CBaM). The objective, historical skill weighted consolidation was a major tool used in the outlooks, and that includes the ENSO/OCN tool and a complete suite of statistical and dynamical tool combinations. Although a transition to ENSO-neutral is favored during the early forecast lead times, La Niña composites were used during JFM and FMA as the atmospheric response to La Niña is expected to linger through the late winter or early spring. An expectation of dry soil moisture heading into the spring for the central to southern Great Plains played a role in the temperature outlooks during the 2023 warm season. Long-term climate trends were considered for all leads, but were relied upon more heavily from the summer 2023 through JFM 2024.
30-DAY OUTLOOK DISCUSSION FOR JANUARY 2023
The temperature and precipitation outlooks for January 2023 are largely reflective of the ongoing La Nina and the potential for MJO activity to emerge. The future state of the MJO is less certain than that of ENSO, and would be transient during the month, so that increases the uncertainty in the outlook. The statistical tools (CA, CCA, OCN, and ENSO/OCN), the NMME, and the consolidation of those tools also contributed heavily to the outlooks.
Temperature
The MJO is likely to be in Phase 4 near the start of the new year, which could have some impacts over the CONUS. Composites mostly indicate a tilt toward warmer than normal temperatures from an MJO in phases 4 through 6 for Dec-Jan-Feb, especially across the Southern Plains and east of the Mississippi River. The statistical tools and the NMME output for January both favor below normal temperatures across the Northern Great Plains. That signal is further bolstered by feedback from expected increases in snow pack during mid and late December. Trends favor above normal temperatures across much of California and below normal temperatures across the Southwest. That cold signal in the Southwest is at odds with the NMME probabilities and most likely impacts from La Nina on a seasonal timescale, so equal chances are indicated there. Above normal temperatures are favored across western Alaska with below normal temperatures favored across southeast Mainland Alaska and the Alaska Panhandle, related to the ongoing La Nina. The signal in western Alaska is also supported by below normal sea-ice extent near the Seward Peninsula.
Precipitation
The impact of the potential MJO on the precipitation outlook for January is less certain, with less of the points across the CONUS passing statistical significance of downstream impacts from MJO activity in phases 4 through 6. The precipitation pattern is largely reflective of the CA, CCA, ENSO, and the NMME, as trends in precipitation are weak and noisy across the CONUS. Below normal precipitation is favored across the Southern tier of the CONUS, largely related to the ongoing La Nina. Above normal precipitation is more likely from the Pacific Northwest to the Northern Great Plains, around the Great Lakes, and into the Tennessee River Valley, which is largely based on the NMME and the SST-CA as the ENSO/OCN tool only supports the below normal precipitation in the Southwest and portions of the Southeast. Uncertainty about the above normal precipitation is higher, and the probabilities are all less than 50 percent for above normal precipitation to reflect the uncertainty. Pacific SST patterns favor above normal precipitation across Western Alaska and below normal precipitation for southeast Mainland Alaska and the Alaska Panhandle. Below normal sea ice could also support above normal precipitation across Western Alaska.
SUMMARY OF THE OUTLOOK FOR NON-TECHNICAL USERS (Focus on JFM 2023)
Temperature
The January-February-March (JFM) 2023 temperature outlook favors below-normal temperatures across the Pacific Northwest, northern Rockies, and northern Great Plains. Below-normal temperatures are also favored for southeastern Alaska. Above-normal temperatures are more likely for the southern and eastern contiguous United States (CONUS) along with parts of northern Alaska and the Aleutians.
Precipitation
The JFM 2023 precipitation outlook depicts elevated probabilities for above-normal precipitation for the Pacific Northwest, northern Rockies, parts of the northern Great Plains, and from the Great Lakes southward to the Ohio and Tennessee Valleys. Below-normal precipitation is favored for central to southern California, the Southwest, central to southern Great Plains, Gulf Coast, and parts of the Southeast.
Areas depicted in white and labeled “Equal-Chances” or “EC” are regions where climate signals are weak and so there are equal chances for either above-, near- or below-normal seasonal mean temperatures and total precipitation amounts.
Equatorial sea surface temperatures (SSTs) are below average across most of the Pacific Ocean and La Niña conditions are present. The La Niña state is expected to continue into the winter, with equal chances of La Niña and ENSO-neutral during January-March 2023. From February-April 2023, there is a 71 percent chance of ENSO-neutral.
BASIS AND SUMMARY OF THE CURRENT LONG-LEAD OUTLOOKS
PROGNOSTIC DISCUSSION OF OUTLOOKS – JFM 2023 TO JFM 2024
TEMPERATURE
Elevated probabilities of above-normal temperatures during JFM 2023 are forecast across the southern and eastern CONUS. This favored area of above-normal temperatures is supported by the calibrated NMME, CBaM, and consolidation tool. Probabilities for above-normal temperatures exceed 50 percent across the Southeast where the consolidation has the strongest warm signal. Coverage and probabilities for above-normal temperatures across the southern Great Plains are tempered by concerns of Arctic air outbreaks through February. Although the calibrated NMME features a notable warming trend across the northern Great Plains, below-normal temperatures are slightly favored for much of the Dakotas, based on La Niña composites and given the potential for high-latitude blocking/negative Arctic Oscillation to remain more prevalent. Forecast confidence for below-normal temperatures is highest from the northern Rockies west to the Pacific Northwest, due to good agreement and consistency among tools. EC is forecast for areas of the CONUS where temperatures are expected to be most variable during this three-month period. It should be noted that subseasonal variability related to the MJO and Arctic Oscillation (AO) are expected to influence the circulation pattern and temperatures this winter. Dynamical and statistical tools support increased probabilities of below-normal temperatures for southeastern Alaska with above-normal temperatures favored for the Aleutians and parts of northern Mainland Alaska.
The temperature outlook for FMA 2023 (compared to the previous month release) reveals a slightly warmer solution for the southern tier and north-central CONUS, based on the latest NMME. Beginning in the spring and continuing through the summer 2023, the likelihood of low soil moisture led to enhanced probabilities for above-normal temperatures across the central to southern Great Plains. The temperature outlooks at later lead times relied mostly upon long-term trends .
PRECIPITATION
Dynamical model guidance and statistical tools continue to depict a La Niña related precipitation pattern through JFM 2023. Impacts on the primary storm track and precipitation due to La Niña are forecast to linger even if negative SST anomalies across the equatorial central Pacific begin to weaken. Given dynamical model trends since the previous outlook, probabilities for below-normal precipitation were increased to 50 percent, or more, across the Southwest for JFM 2023, and above-normal precipitation is also favored for the Aleutians. La Niña effects support a wet-to-dry dipole from the Ohio River to the Gulf Coast. Increased probabilities for above-normal precipitation extend north to the Great Lakes and west to parts of the northern Great Plains, northern Rockies, and Pacific Northwest. Farther to the south along the West Coast, below-normal precipitation is most likely for southern California based on the calibrated NMME and consolidation tool. EC is forecast for northern California and southern Oregon where precipitation signals are weaker and forecast confidence is lowest. Consistent with below-normal temperatures and many precipitation tools, below-normal precipitation is favored for parts of southeastern Alaska during JFM 2023. This dry signal continues through next spring. Conversely, the calibrated NMME and statistical tools support elevated probabilities for above-normal precipitation across the Aleutians and western to northern Mainland Alaska during JFM with this favored wetness decreasing in spatial coverage by MAM 2023.
During FMA and MAM 2023, the dry signal among dynamical models weakened across southern California and the Southeast, compared to last month, which resulted in modifications to the previous outlook. Other minor changes from last month included adjustments to the favored wet area across the east-central CONUS for AMJ and MJJ 2023, based on the latest NMME and consolidation tools. Beginning in the summer 2023 and through the winter 2023-2024, long-term trends were the primary tool for those precipitation outlooks.
Review of the ENSO Assumptions utilized by NOAA (CPC) in Preparing this Four-Season Outlook
It is useful to review the ENSO forecasts used by NOAA to produce this Four-Season Outlook. We reported on that last week and you can read that article by clicking HERE
The key information used by NOAA follows.
IRI CPC ENSO STATE Probability Distribution (IRI stands for the International Research Institute for Climate and Society)
Here are the new forecast probabilities. This information is released twice a month and the first release is based on a survey of Meteorologists, the second is based on model results. The probabilities are for three-month periods e.g. NDJ stands for November/December, January. I am just showing the first release which is what we have and presumably what NOAA (actually their CPC Division) worked from.
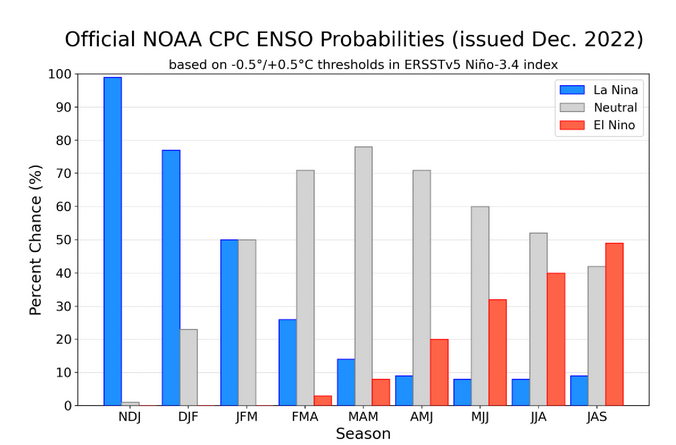
| Notice for JFM 2023 the probability of La Nina and ENSO Neutral are equal. But for FMA the probability for ENSO Neutral greatly exceeds that for La Nina. So maybe March (the midpoint of the FMA three-month period) is when the ocean conditions will be consistent with ENSO Neutral but the impact on our weather may lag a month or so. So we really seem to be looking at La Nina into Spring.
It is early but the probabilities shown for JAS 2023 year are very interesting. Are we headed for El Nino? It would be unusual to transition so quickly. |
Tropical Subsurface Temperature Anomalies
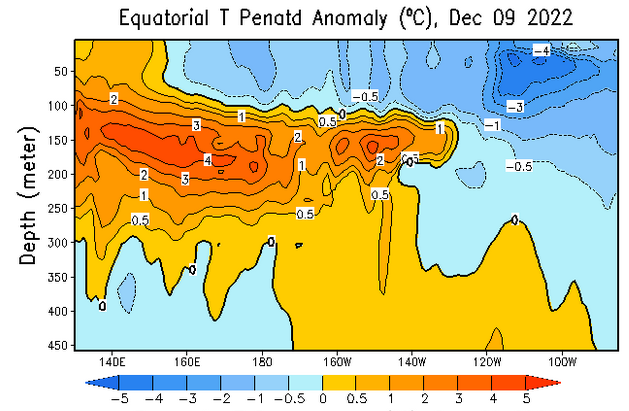
| You can update this graphic by clicking HERE and scrolling down to “Mean and anomalous equatorial temperatures” . You can see the anomalously warm water at depth undercutting the anomalously cool water but I still am not convinced the meteorologists have the timing of the demise of La Nina correct. I hope they have it correct. |

–
| The image will update if you click HERE. https://www.cpc.ncep.noaa.gov/products/people/wwang/cfsv2fcst/images3/nino34SeaadjPDFSPRDC.gif This model shows La Nina ending a month earlier than the IRI/CPC assessment.
NOAA used to rely more on the IRI Forecast but now that CPC seems to have taken more control over IRI it is not totally clear how they determine their ENSO forecast. But it is pretty much evident in the NOAA Discussion and the set of 12 three-month maps they provide and which are shown in this article. I assume it takes them a couple of days to produce their Seasonal Outlook so it is always difficult to know the exact date of the data they utilized. |
Resources
The link for the drought outlook map and some discussions that come with the map can be found by clicking HERE.
| I hope you found this article useful and interesting. |