Updated at 7:08 p.m. EDT October 3, 2022 to have some of the maps be more up to date.
NOAA updates many of its weather outlooks daily or even more frequently and in many cases issues a discussion with those outlooks. We provide a daily report which focuses on the shorter-term predictions but also has links to all the partial-month outlooks. Because WordPress does not provide the ability to have these maps automatically updated, our daily report shows some of the maps which we update each evening plus the links to the other important weather forecast Maps.
Once a week we show many of the actual forecast maps not just provide the links to these maps. This makes it easier for the reader. Our report provides a separate forecast for Days1-5, Days 6 -10, Days 8 – 14, and weeks 3 and 4. This provides information that is useful to readers in terms of planning their activities for the next 28 days.
The week 3-4 outlook is only updated by NOAA’s Climate Prediction Service once a week on Friday. Thus, when we publish on Friday night, it provides a 28-day view of the future. Since we are publishing this week on Sunday night it is only a 26-day view. This makes very little difference but I mention it simply to be technically correct. What is important is that this is a longer-term view than one that is typically available in the media and online.
We also include In Part II of the article the other information from the daily 48-hour forecast article. Importantly, this time of the year, it includes updates on tropical events.
It is important to recognize that the forecasts do not always work out as predicted. But in the article, there are links to obtain updated forecasts If you read this article a few days or more after it is published. And there will be a totally updated version next Friday.

What NOAA is predicting for the next 28 days.
We will start with the short-term – It is up to date as of today. If you look at this article after today you can click the links to update (plus you will end up with a lot of additional information)
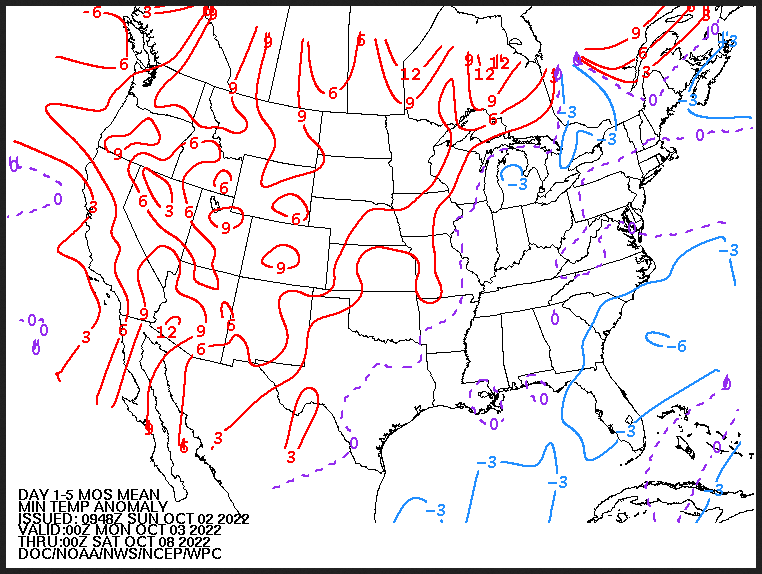
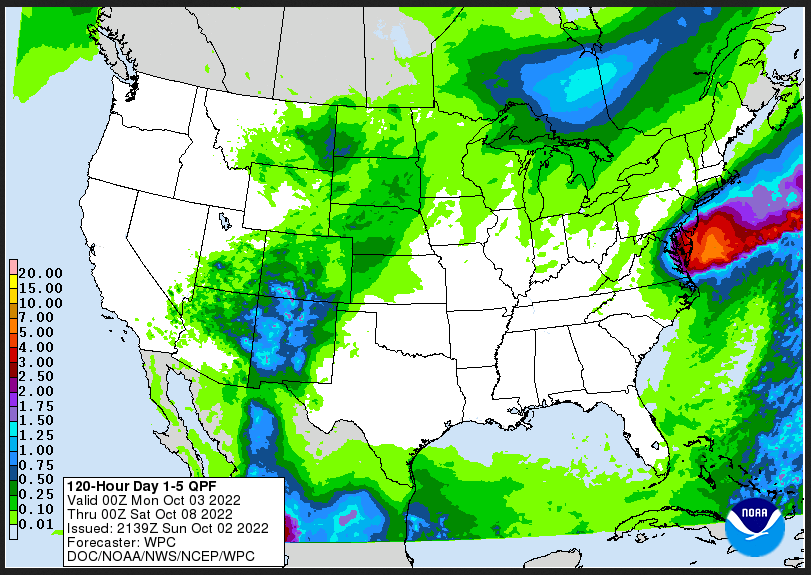
| Temperature (Maximum or Minimum Anomaly) for the next five days | Precipitation (Five days of cumulative precipitation) |
| https://www.wpc.ncep.noaa.gov/medr/me dr_mean.shtml | https://www.wpc.ncep.noaa.gov/qpf/day1-7.shtml |
| Warm in the West and cool and wet in the Northeast. Because we are getting into the first-frost season I used the minimum temperature departure graphic rather than the maximum temperature departure. I assume that what I am showing is the departure from the normal low for the five-day period. |
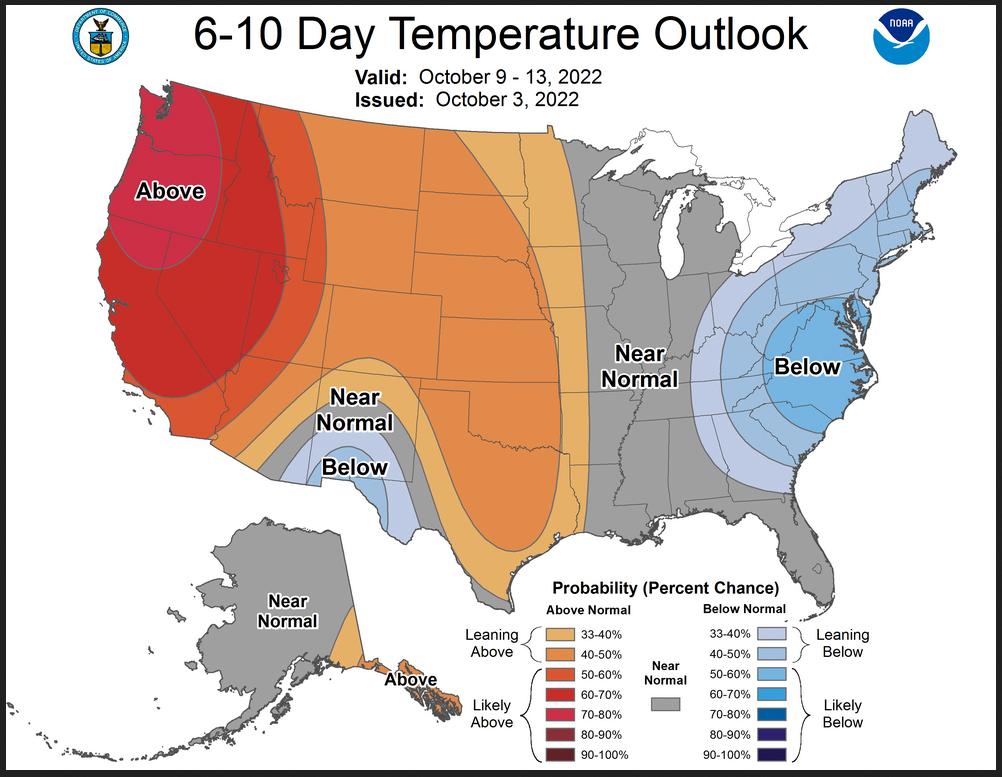
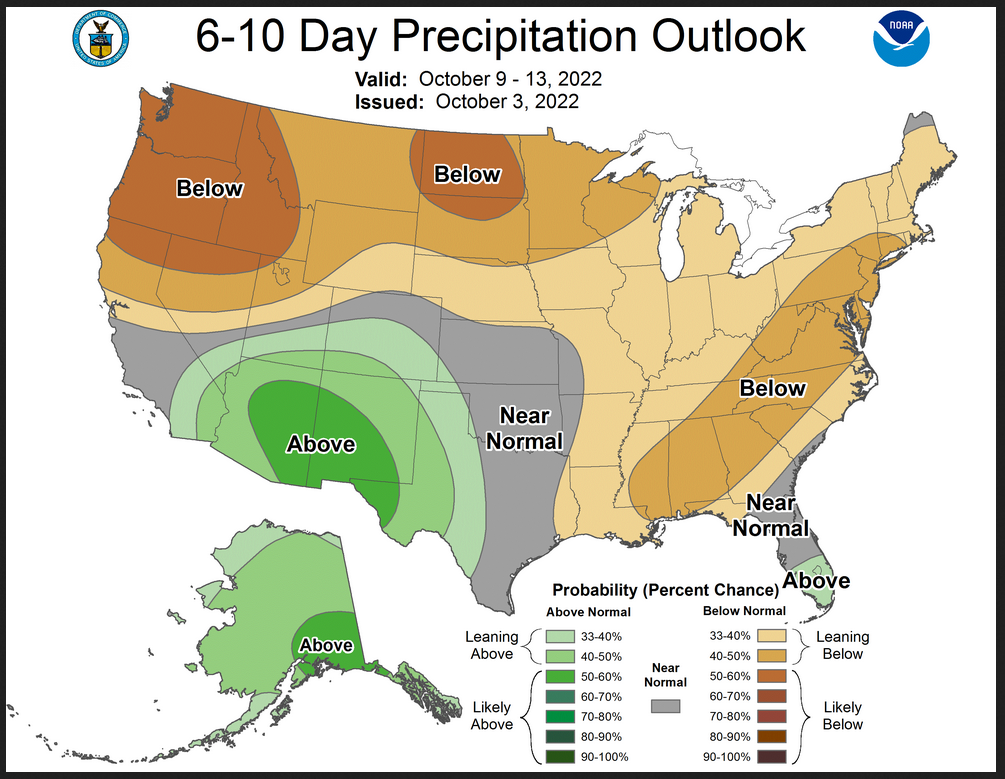
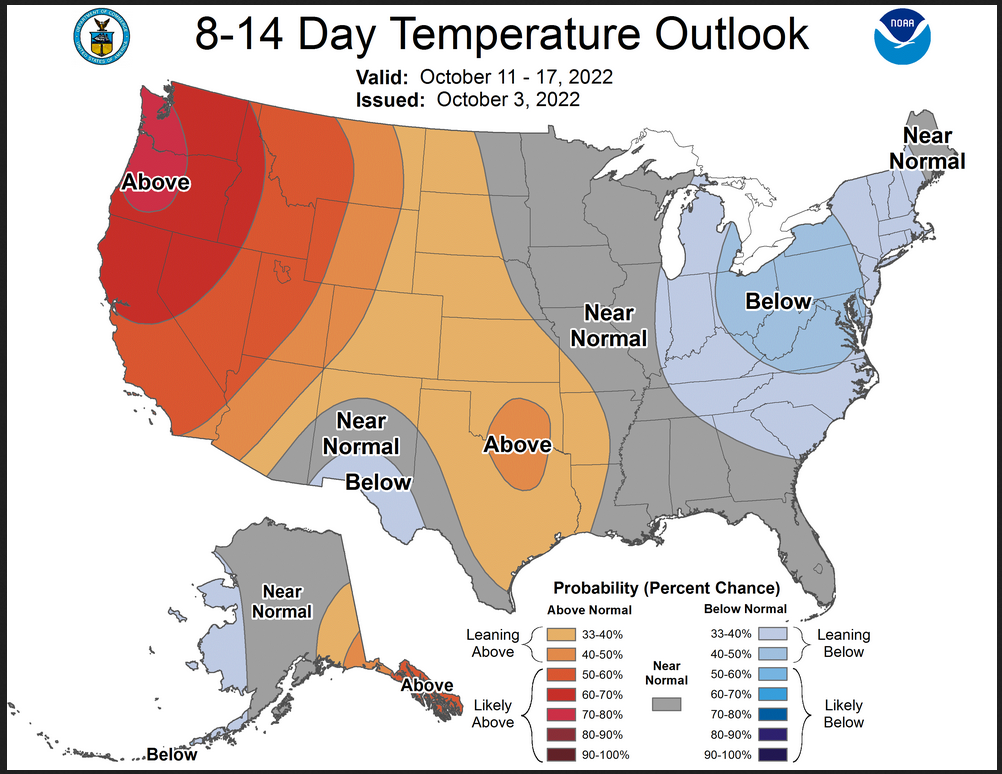
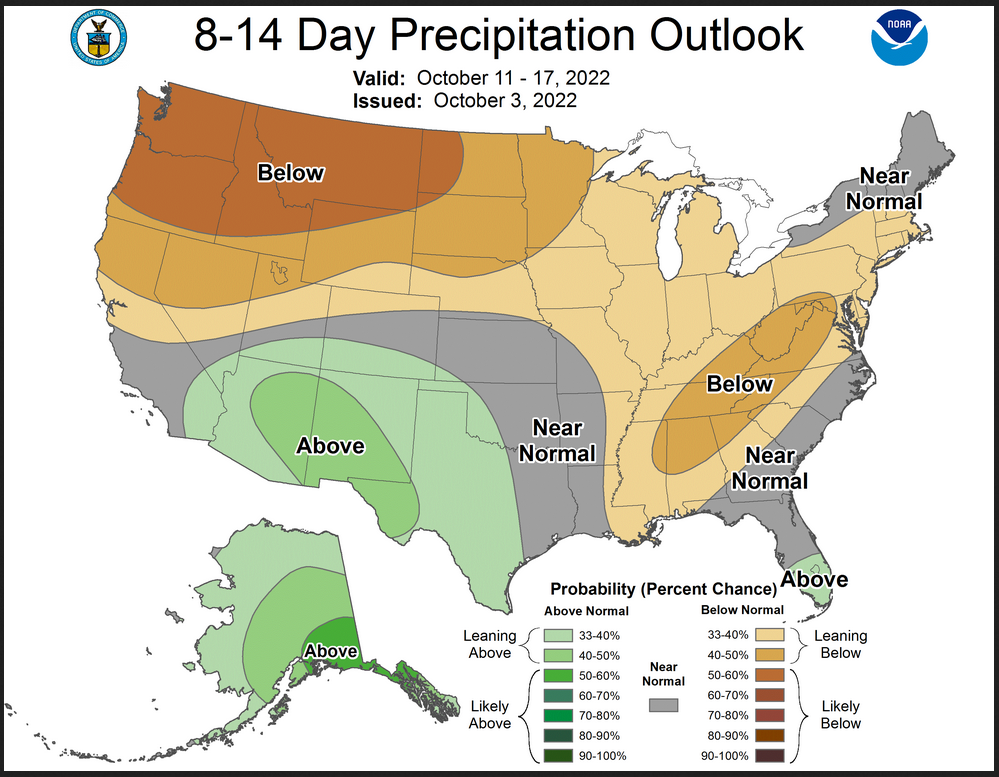
Now we look at “Outlook” maps for three time periods. Days 6 – 10, Days 8 – 14, and Weeks 3 and 4. An outlook differs from a forecast based on how NOAA uses these terms in that an “outlook” presents information as deviation from normal and the likelihood of these deviations.
I have provided the maps so you do not need to click to get them. But they do not update daily. But you can get the current images simply by clicking on the links provided. Then hit the return arrow at the upper left of your screen to return to the article. There is no need to do that right away since what is published today is up to date. The Week 3 – 4 Outlook only updates on Fridays.
Below are the links to obtain updates and additional information.
| The West is warm and the East is cool and most of CONUS is warm. The Southwest is wet. |
| The pattern moderates a bit. |
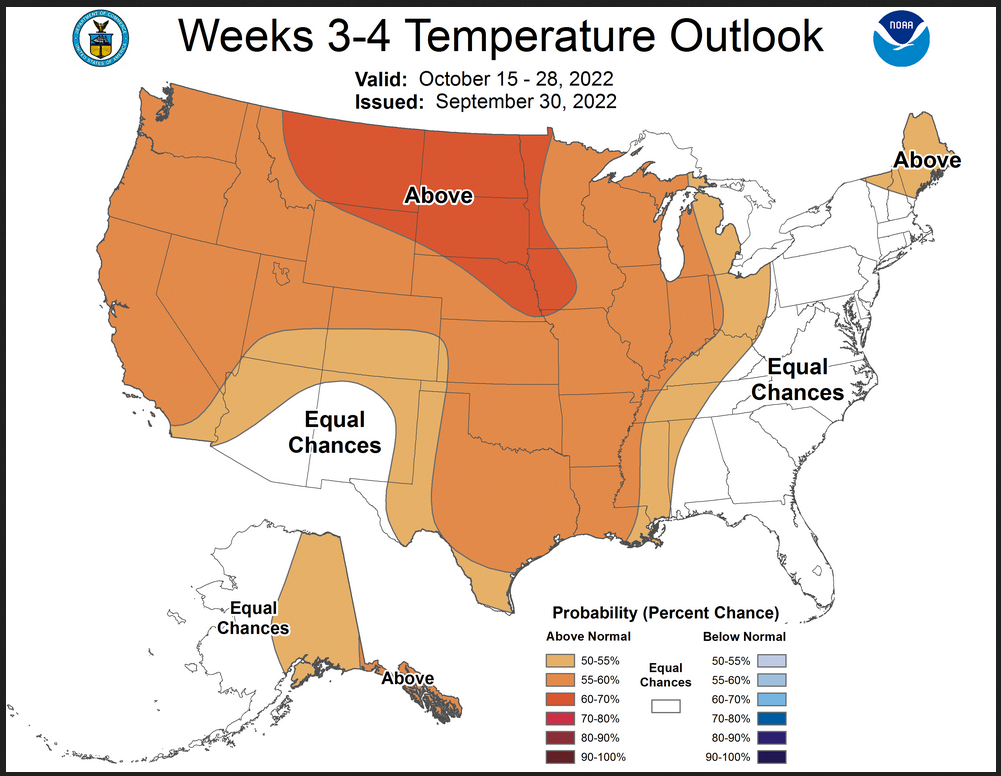
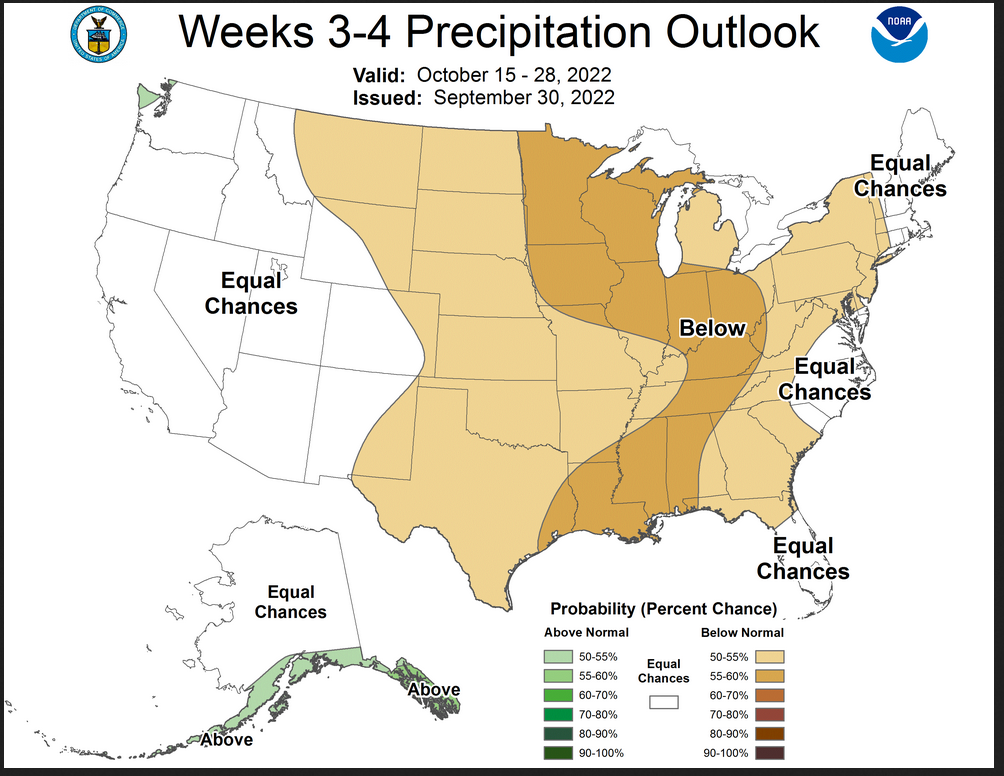
Now we address Weeks 3 and 4. This is a time frame that is very important. It is half of the 28-Day forecast period. That is why we include the discussion that accompanies the maps.
Prognostic Discussion for Week 3-4 Temperature and Experimental Precipitation Outlooks
NWS Climate Prediction Center College Park MD
300PM EDT Fri Sep 30 2022Week 3-4 Forecast Discussion Valid Sat Oct 15 2022-Fri Oct 28 2022
For the Weeks 3-4 forecast period, La Niña conditions are expected to persist in the tropical Pacific, continuing to suppress trans-Pacific propagation of the Madden-Julian Oscillation (MJO). This outlook is based on a combination of operational and experimental dynamical model guidance as well as statistical guidance, including the experimental Linear Inverse Model (LIM) at CPC.
A prominent feature of the anomalous 500mb height pattern predicted by dynamical model guidance for this outlook is a wave-train of above- and below-average heights stretching from the central Pacific Ocean, over the CONUS, to the North Atlantic Ocean. A prominent trough is located generally to the south of Alaska, followed by a ridge to the east and over the western and central CONUS. The dynamical models disagree on both the tilt of these abutting patterns, as well as the location. The ECMWF indicates a meridional alignment of this inflection zone, and centers this over the west coast states of the CONUS. On the other hand, the CFSv2 indicates a more southwest to northeast tilt of the transition zone, centered over British Columbia. The differences in these patterns likely contribute to the differences in precipitation outlooks for the western half of the CONUS. The ECMWF indicates a broadly above-average rainfall outlook for the western half of the CONUS whereas the CFSv2 indicates the opposite. Other guidance supports either outlook or indicates weak probabilities. Given the inconsistent guidance and uncertainty of the position of the transition zone, Equal Chances is forecast for precipitation for the western CONUS. For the eastern two-thirds of the CONUS, the models broadly agree probabilities are weak along the Eastern Seaboard and increase toward a drier than average signal for the Midwest and Central Plains. Experimental guidance indicates the strongest chances of below-average rainfall at 60% or greater for the central CONUS. However, for the official outlook those probabilities were tempered by the weaker probabilities forecast by operational guidance and thus only a 55-60% chance of drier than average conditions is forecast for the east-central CONUS.
The model agreement on the position and strength of the ridging over the CONUS contributes to the widespread enhanced chances of above-average temperatures for most of the CONUS for this outlook. The most confident area for above-average temperatures is in the North Plains where chances reach 60% and greater. The models disagree on the direction of the probabilities for the Mid-Atlantic states and in particular for week-3 and week-4 separately. The ECMWF favors a cooler than average signal for the eastern half of CONUS in week-3 but that changes to a warmer than average signal in week-4. The JMA provides a similar forecast, with a comparatively weaker below-average signal, but hangs on to the tilt toward cooler than average conditions into week-4. The CFSv2 also indicates a cooler than average signal however has that signal confined to the Southeast and in week-4. Given the mix of guidance, Equal Chances is forecast for most of the Mid-Atlantic. Equal Chances is also forecast for the Southwest based on modest differences in dynamical and statistical model guidance.
The SubX multi-model ensemble forecast for Hawaii indicates strong probabilities of above-average temperatures for all islands and slightly enhanced chances of drier than average conditions for Lihue and Honolulu and near-normal rainfall for Kahului and Hilo.
| It is important to note that the Week 3 -4 Outlook is prepared by a different team than the 6 -10 and 8 – 14 day Outlooks as well as the update of the monthly outlook. |
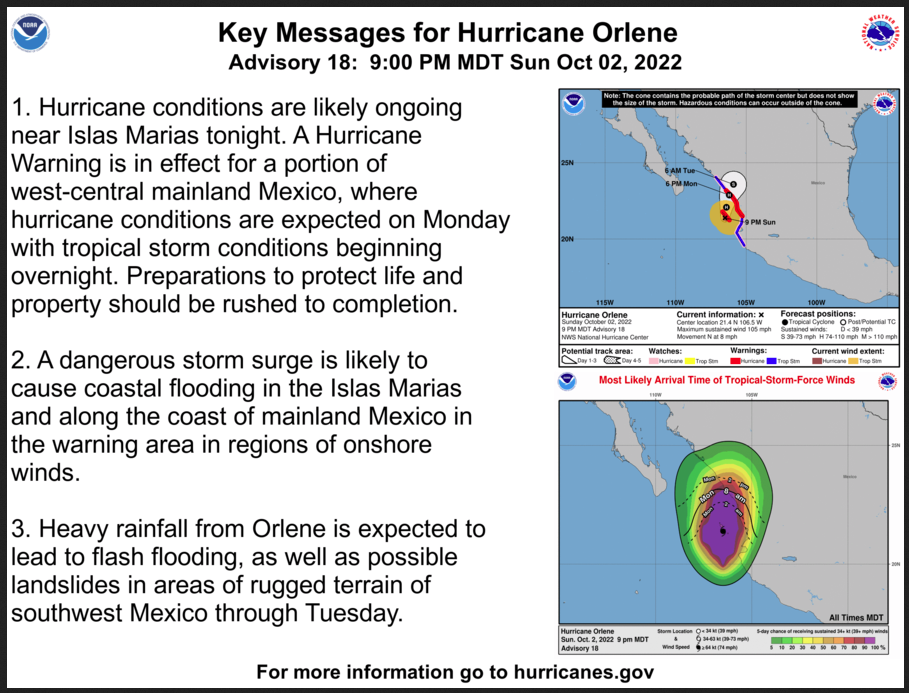
Now switching over to Part II of this article which is our regular 48-Hr Forecast which also includes links for tropical updates and in some cases the NHC maps for storms that are near-term threats.
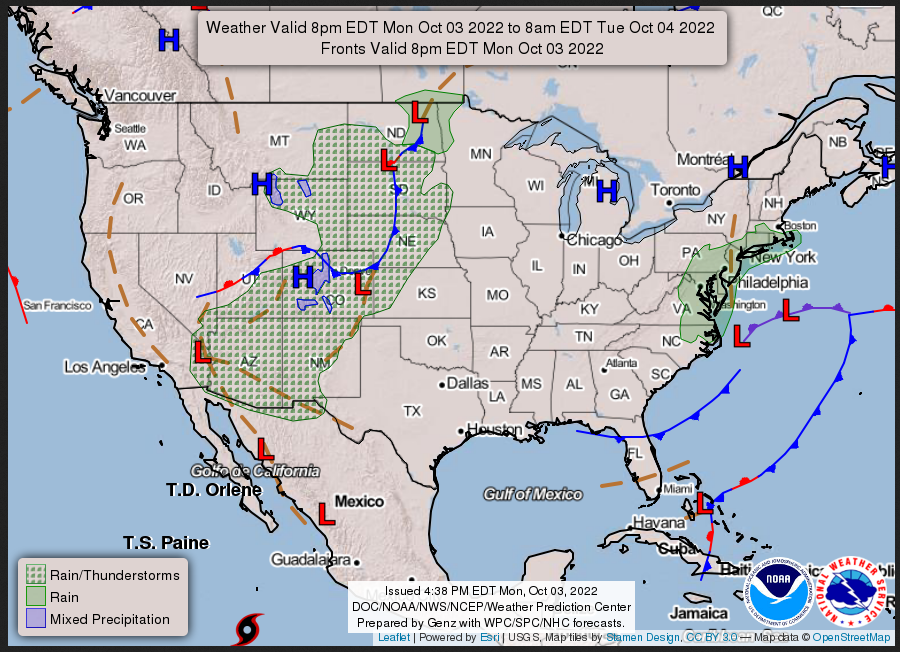
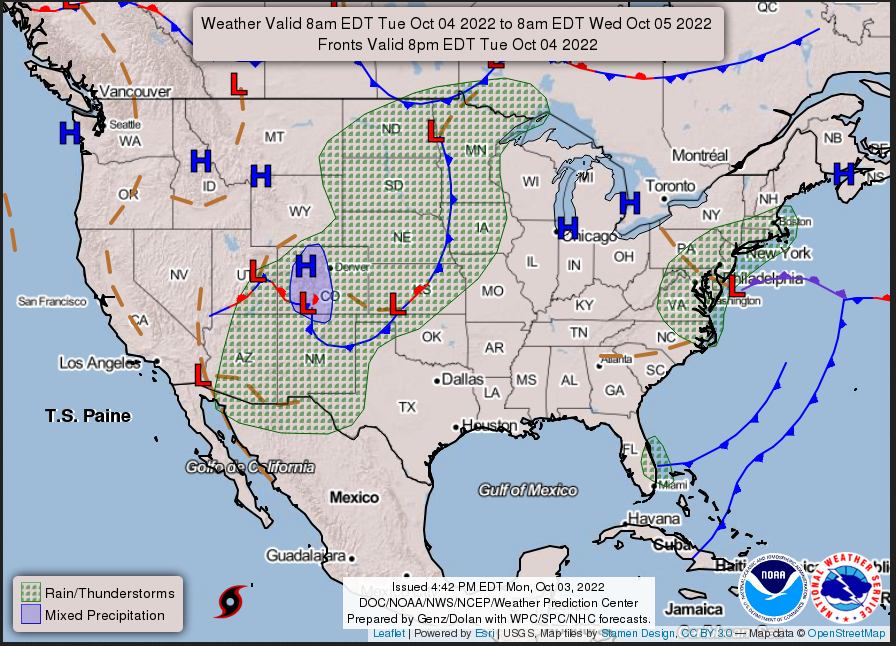
Here is what we are paying attention to today and the next 48 hours from this morning’s NWS Forecast.
...There is a Slight Risk of excessive rainfall over parts of the Great
Basin through Monday morning...

...There are Freeze Warning and Frost Advisories over parts of the
Northeast into the Great Lakes late Sunday into Monday morning...

...Temperatures will be 10 to 15 degrees below average over parts of the
Mid-Atlantic...

An upper-level low over the Mid-Atlantic will keep clouds and showers over
the region through Tuesday. Moisture streaming inland off the Atlantic
will produce rain that may be heavy at times over parts of the
Mid-Atlantic. Therefore, the WPC has issued a Marginal Risk of excessive
rainfall over parts of the Mid-Atlantic through Monday morning. The
associated heavy rain will create localized areas of flash flooding,
affecting areas that experience rapid runoff with heavy rain.

The threat of excessive rainfall continues on Monday with a Marginal Risk
of excessive rainfall over the immediate Mid-Atlantic Coast. The threat of
excessive rainfall ends on Tuesday. However, the clouds and rain will keep
temperatures 10 to 15 degrees below average on Monday. In addition, strong
high pressure over parts of Eastern Canada will provide clear skies and
calm wind, allowing temperatures to cool off overnight, prompting Freeze
Warning and Frost Advisories over parts of the Northeast into the Great
Lakes late Sunday into Monday morning.

Meanwhile, a second upper-level low over the Northern Rockies will slowly
drift to the Northern Plains by Tuesday. Moisture pooling over the
Southwest and the upper-level energy will aid in producing heavy rain and
thunderstorms over parts of the eastern Great Basin, Southwest, and
Central/Southern Rockies. Therefore, the WPC has issued a Slight Risk of
excessive rainfall over parts of the eastern Great Basin through Monday
morning. The associated heavy rain will create mainly localized areas of
flash flooding, with urban areas, roads, small streams, and burn scars the
most vulnerable.

The threat of excessive rainfall decreases slightly on Monday over parts
of the Southwest, Great Basin, and Central/Southern Rockies. Therefore,
the WPC has issued a Marginal Risk of excessive rainfall over parts of the
region from Monday into Tuesday morning. The associated heavy rain will
create localized areas of flash flooding, affecting areas that experience
rapid runoff and burn scars. On Tuesday, the Marginal Risk of excessive
rainfall is limited to parts of the far eastern Southwest and parts of the
Central/Southern Rockies.
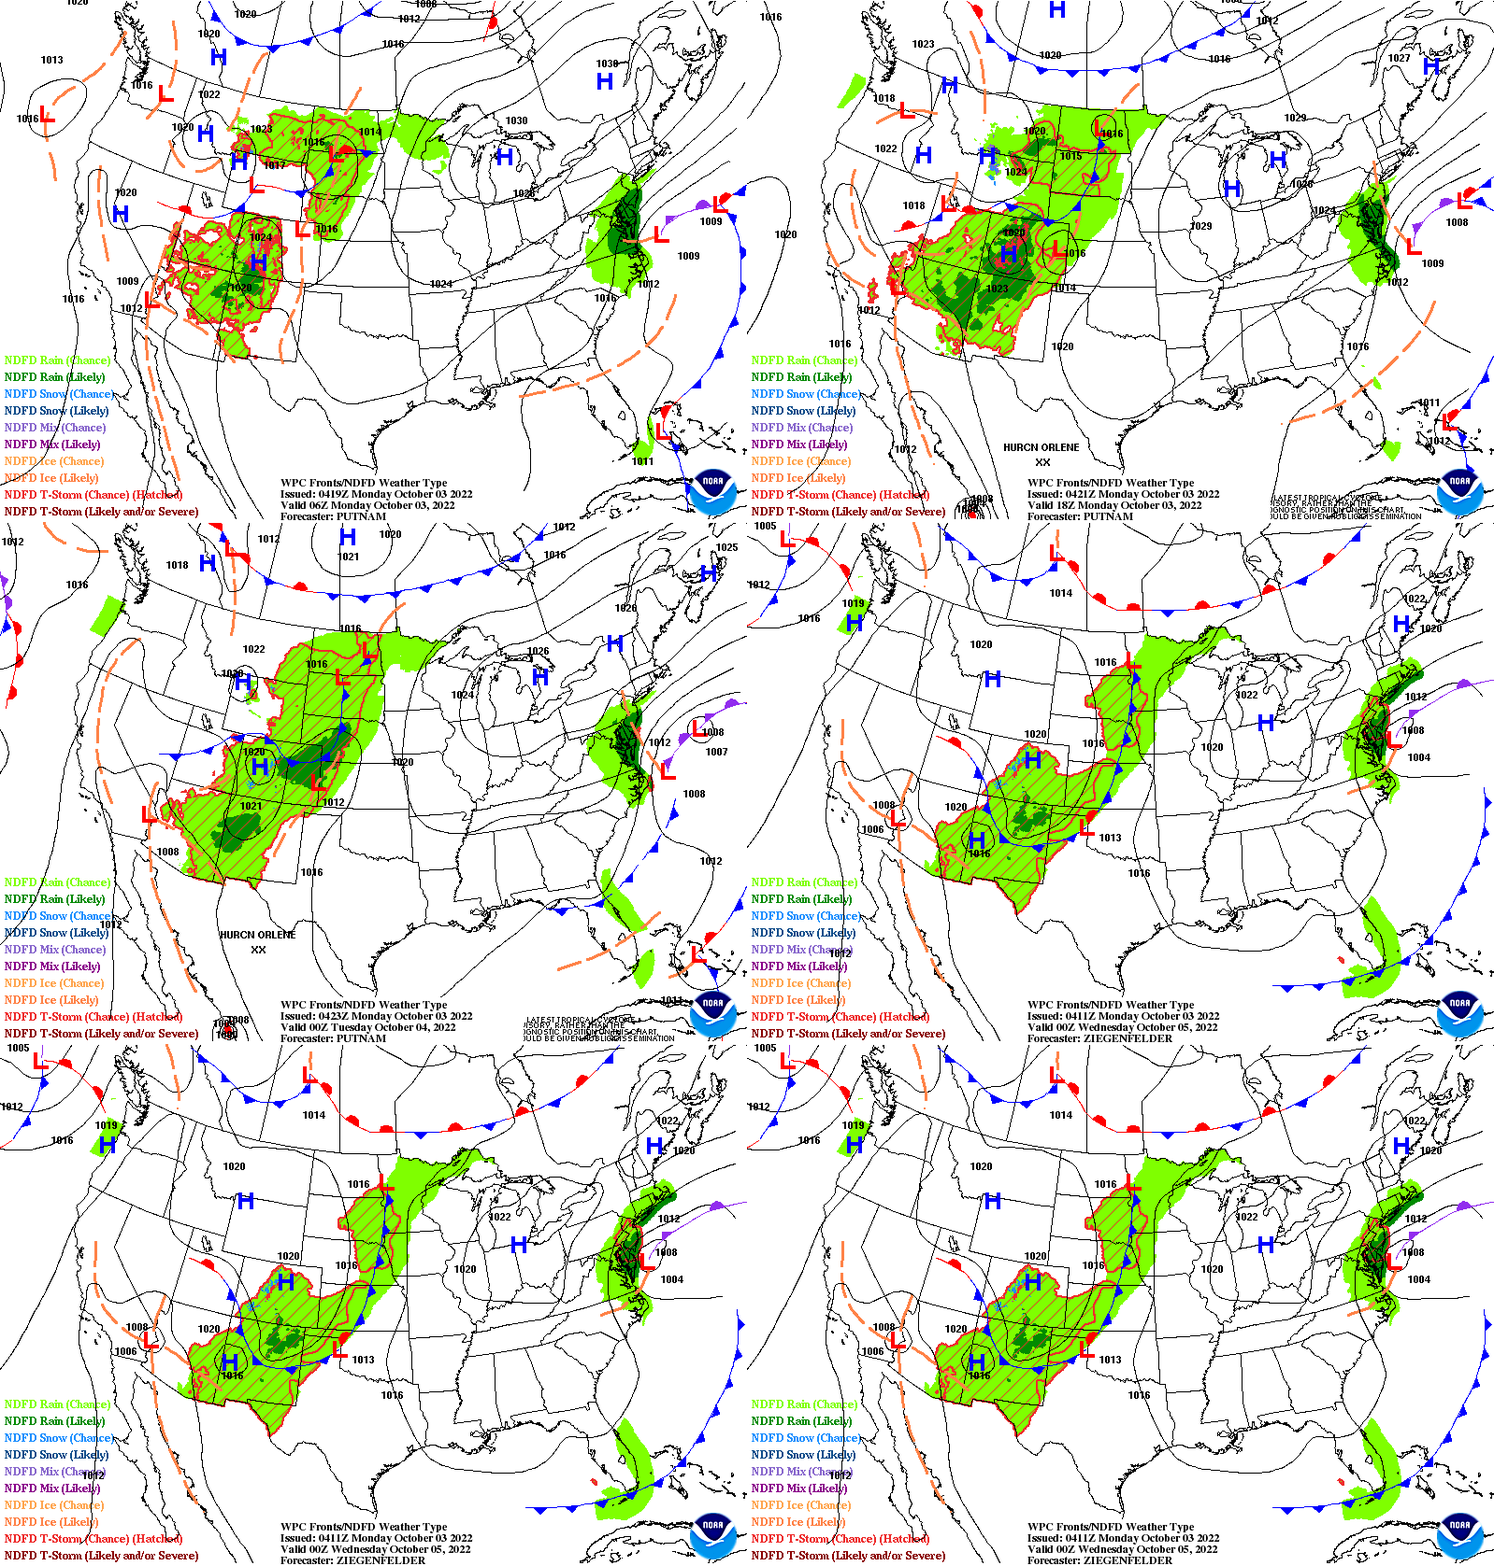
(It is updated twice a day and these updates can be found here.
Maps that relate the forecast to geography can be found by clicking Here for Day 1 and Here for Day 2. (I will update these on Monday morning so they will be current at that point).
Here is a 60-hour animated forecast map that shows how the short-term forecast is expected to play out.
If it needs to be updated click here.
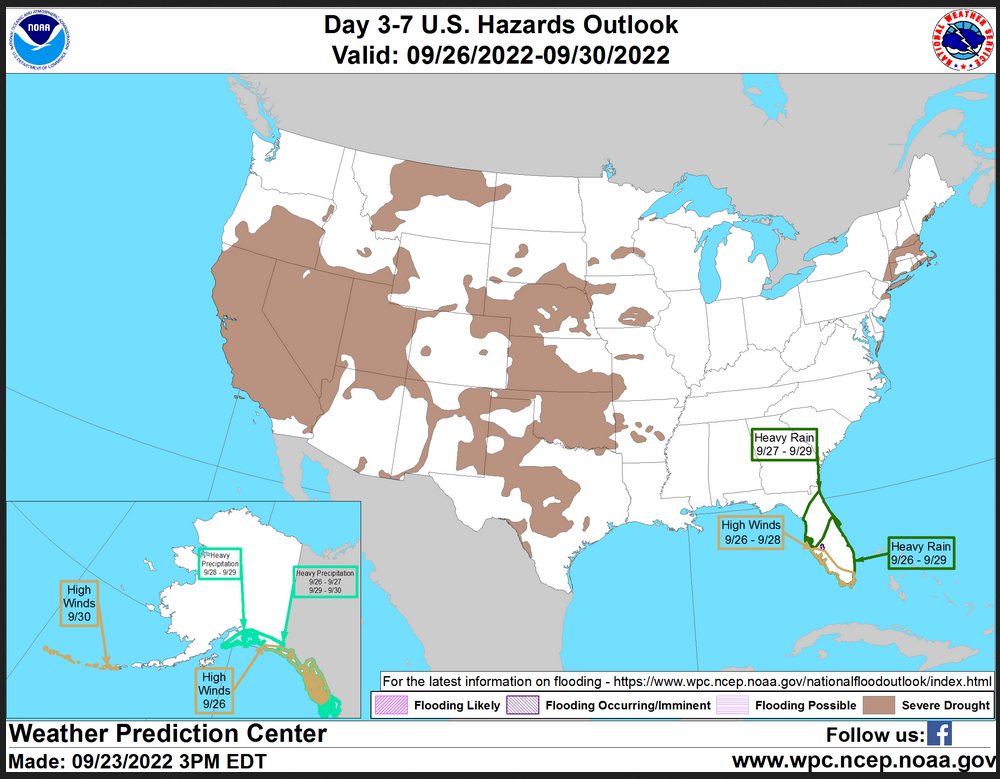
HAZARDS OUTLOOKS
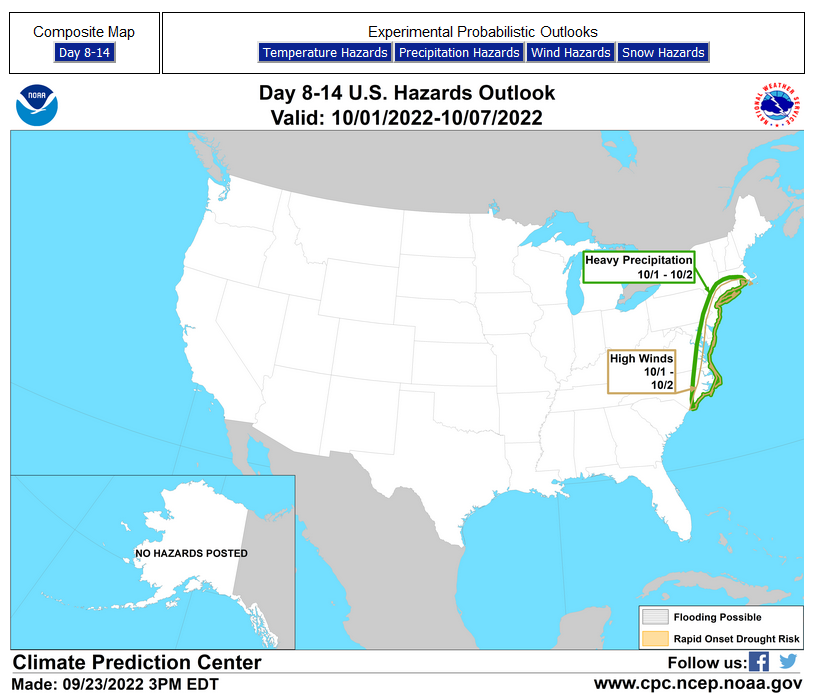
Click here for the latest complete Day 3 -7 Hazards forecast which updates only on weekdays. Once a week probably Monday or Tuesday I will update the images. I provided the link for readers to get daily updates on weekdays. Use your own judgment to decide if you need to update these images.
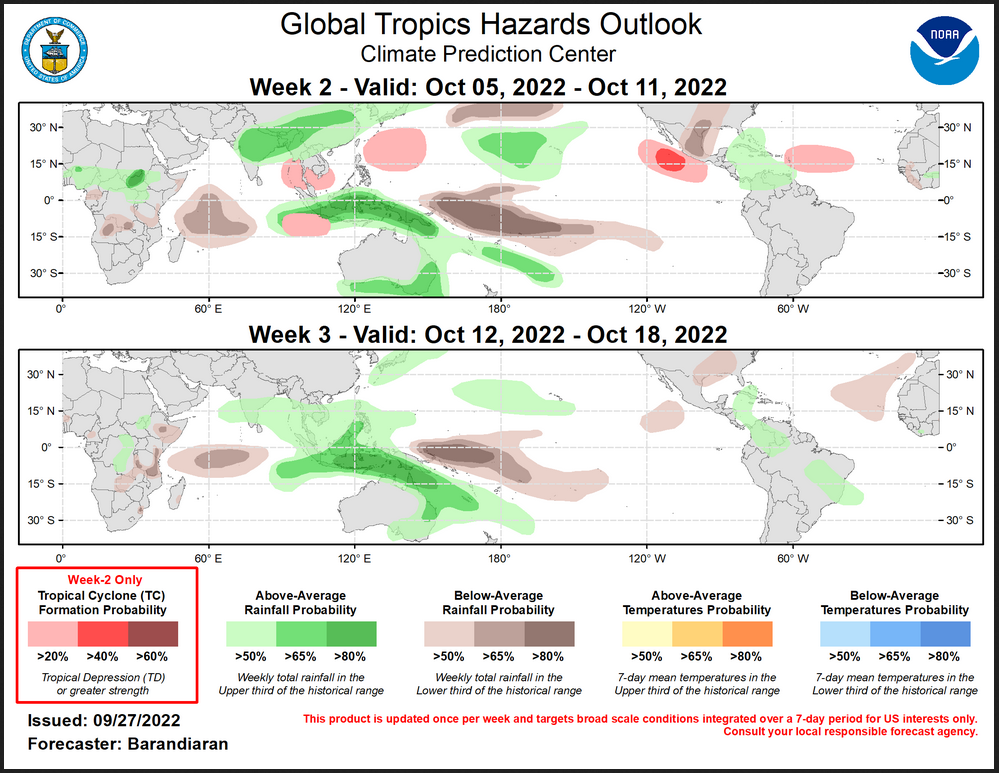
Worldwide Tropical Forecast
(This graphic updates on Tuesdays) If it has not been updated, you can get the update by clicking here
Detailed Maps and Reports
First the Atlantic
Click to view the forecast map and have access to additional information https://www.nhc.noaa.gov/gtwo.php ?basin=atlc&fdays=5
Then Eastern Pacific
Click to view the forecast map and have access to additional information https://www.nhc.noaa .gov/gtwo.ph p?basin=epac&fdays=5
Then Central Pacific
Click to view the forecast map and have access to additional information https://www.nhc.noaa.gov/gtwo.php?basin=cpac&fdays=5
And the Western Pacific
Click to view the forecast map and have access to additional information https://www.metoc.navy.mil/jtwc/jtwc.html
Updates and additional information can be accessed by clicking HERE
World Forecast for Day 6 (Currently Set for Day 6 but the reader can change that)
World Weather Forecast produced by the Australian Bureau of Meteorology. Unfortunately, I do not know how to extract the control panel and embed it into my report so that you could use the tool within my report. But if you visit it Click Here and you will be able to use the tool to view temperature or many other things for THE WORLD. It can forecast out for a week. Pretty cool. Return to this report by using the “Back Arrow” usually found top left corner of your screen to the left of the URL Box. It may require hitting it a few times depending on how deep you are into the BOM tool.
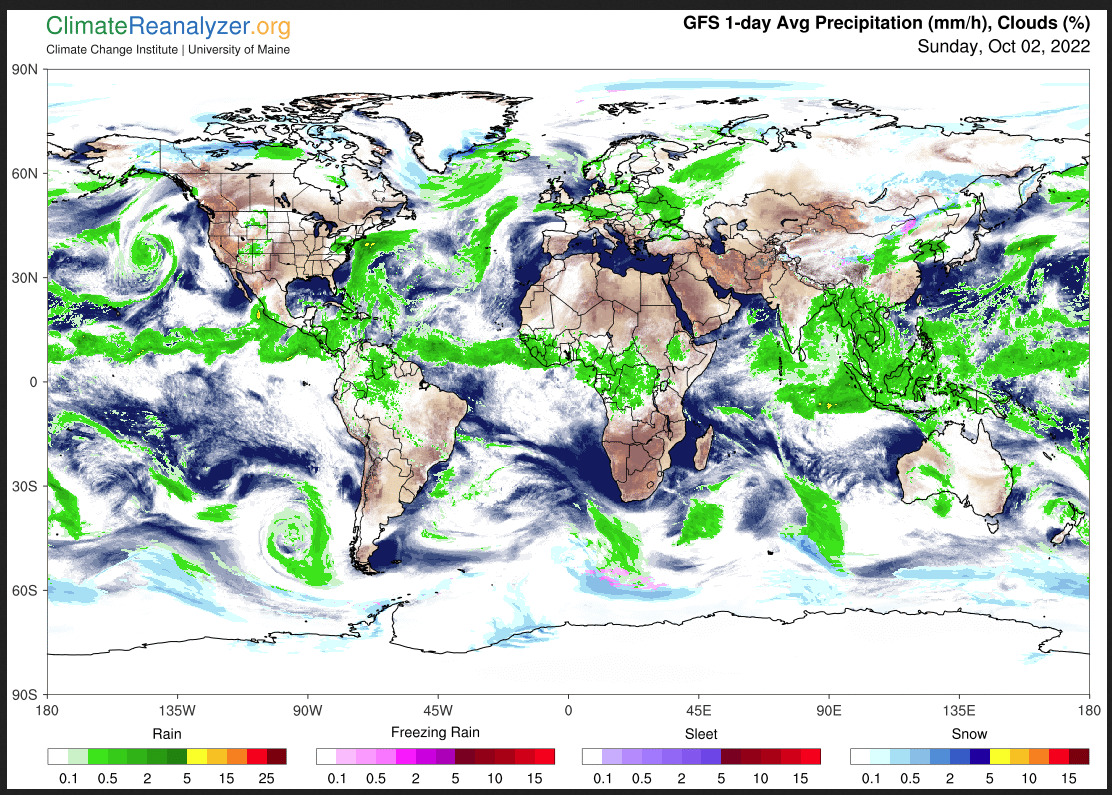
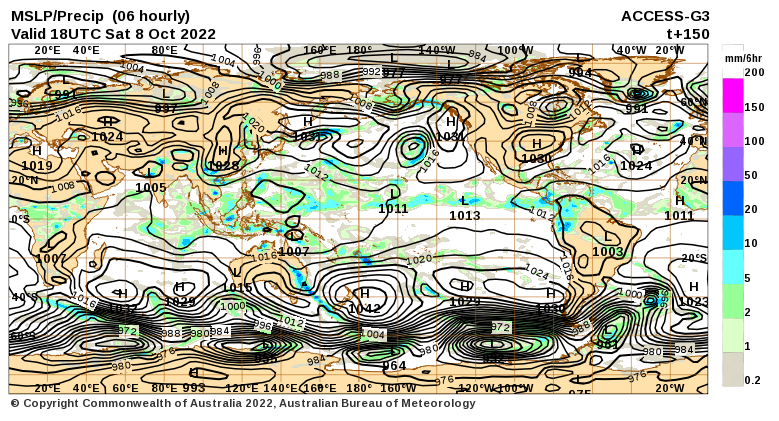
Below are the current worldwide precipitation and air pressure forecasts for six days out. They will not auto-update and right now are current for Day 6. If you want the forecast for a different day Click Here I will try to update this map each day but you have the link so you can access the dashboard and get a wide variety of forecasts. I mostly rely on the reader to interpret world maps.
For this map, areas of expected precipitation for the date and time shown are clearly shown. The number of High-Pressure systems shown is called the Wave Number. Maybe I will discuss WN someday. But it shows how many Rossby Waves there are around the World. Sometimes they are hard to count. Counting Low-Pressure systems should provide the same WN. Rossby Waves are the way the temperature distribution of the Planet remains in balance. It is basically the science of fluid dynamics. It can be very helpful in predicting the movement of weather patterns. You can snip an area of interest and move it into MS Paint and enlarge it.
 Below is the current or short-term forecast which can be updated by clicking HERE Additional maps can be obtained HERE.
Month to Date Information
Temperature month to date can be found at https://hprcc.unl.edu/products/maps/acis/MonthTDeptUS.png
Precipitation month to date can be found at https://hprcc.unl.edu/products/maps/acis/MonthPNormUS.png
