Here is what we are paying attention to this evening and the next 48 hours from this evening’s NWS Forecast.
...Heavy Rainfall event to unfold across the Southern Plains and Lower
Mississippi Valley over the next several days...

...Potential Tropical Cyclone Four is forecast to reach southern Texas as
a Tropical Depression on Sunday...

...Above average temperatures in the Northwest and Northeast...

...Scattered to severe thunderstorms possible across the Midwest/Ohio
Valley through Sunday...
Continuation of the NWS Short Range Forecast (It is updated twice a day and these updates can be found here.
A multi-day heavy rainfall event is set to unfold over parts of the
Southern Plains and Lower Mississippi Valley beginning tonight. Shortwave
energy currently driving heavy rain and flash flooding impacts in the
Southwest will move into the Southern Plains tonight, bringing with it a
pool of monsoonal moisture. Additionally, moisture from Potential Tropical
Cyclone Four will surge northward from the Gulf of Mexico and interact
with a surface front draped across the Southern Plains tomorrow. Both
sources of moisture will combine to amplify the heavy rainfall threat over
eastern Texas and the Lower Mississippi Valley Sunday night through
midweek. Between 4-8 inches of rain with isolated pockets of 10+ inches
are forecast to accumulate over the next 5 days from central Texas to
eastern Louisiana. Much of this rainfall will be beneficial and welcome
due to the effects of an ongoing drought, but the potential still exists
for instances of flash flooding in urban areas and places with poor
drainage. Slight Risks of Excessive Rainfall leading to Flash Flooding are
in effect for portions of the Southern Plains and Lower Mississippi Valley
as a result.

Elsewhere, a slow moving low pressure system will bring showers and
thunderstorms to the Midwest over the next couple of days before spreading
into the East Coast. Thunderstorms tonight may become severe, particularly
over parts of Illinois and Ohio where Slight Risks of Severe Thunderstorms
are in effect. Damaging winds and large hail appear to be the main
concerns from any severe storms that form.

Temperatures are expected to drop well below average across the Southern
Plains and Lower Mississippi Valley due to clouds and rainfall forecast
for that region over the next few days. Meanwhile, the Northwest will warm
up beneath a ridge of high pressure on Sunday, before temperatures
moderate a bit early next week. The approaching trough responsible for
potential severe weather in the Midwest will continue to stream warm air
into the Northeast on Sunday before the arrival of showers and
thunderstorms cool things down a bit heading into the work week.
Maps that relate the forecast to geography can be found by clicking Here for Day 1 and Here for Day 2.
Here is a 60-hour animated forecast map that shows how the short-term forecast is expected to play out.
If it needs to be updated click here.
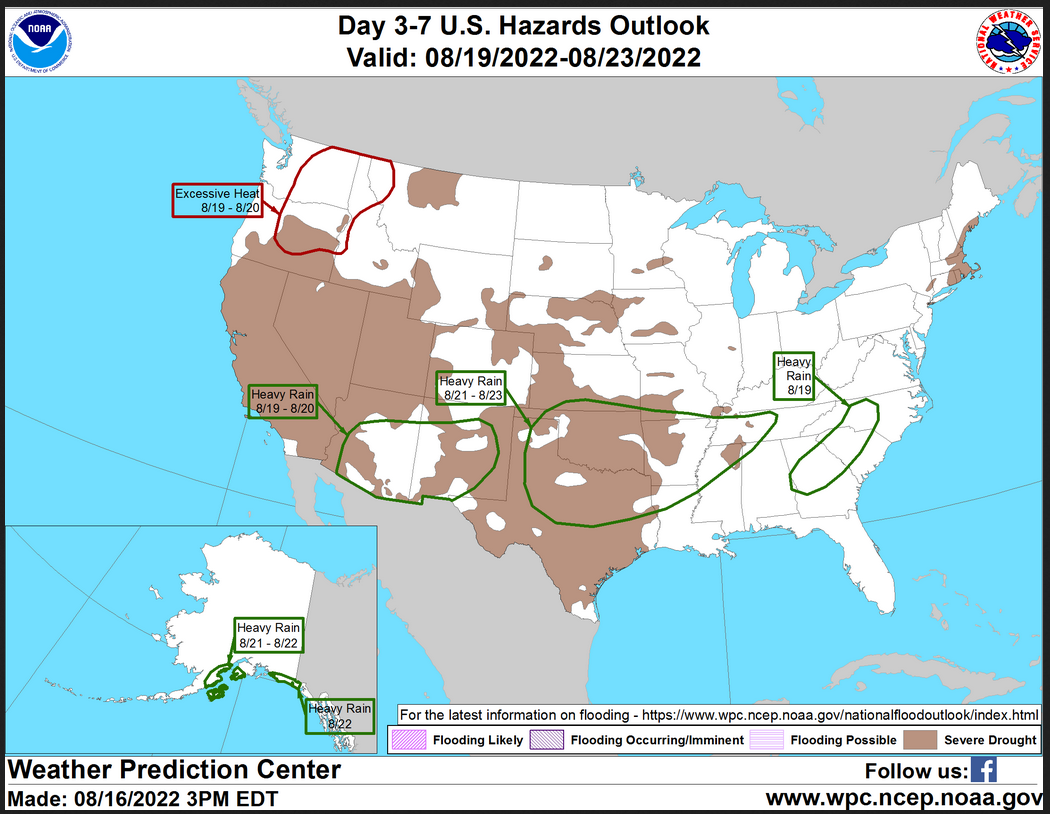
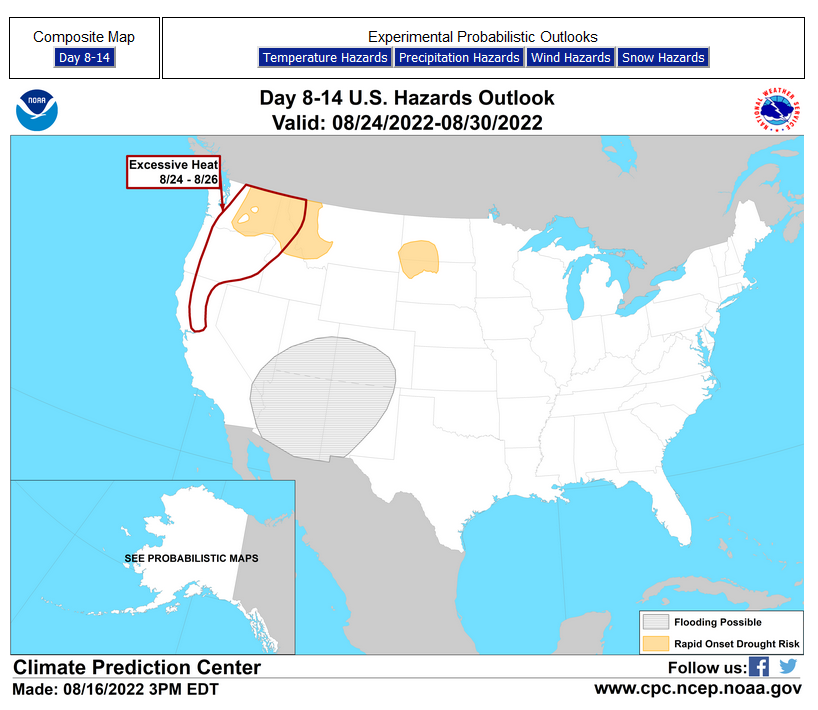
HAZARDS OUTLOOKS
Click here for the latest complete Day 3 -7 Hazards forecast which updates only on weekdays. Once a week probably Monday or Tuesday I will update the images. I provided the link for readers to get daily updates on weekdays. Use your own judgment to decide if you need to update these images.
Worldwide Tropical Forecast
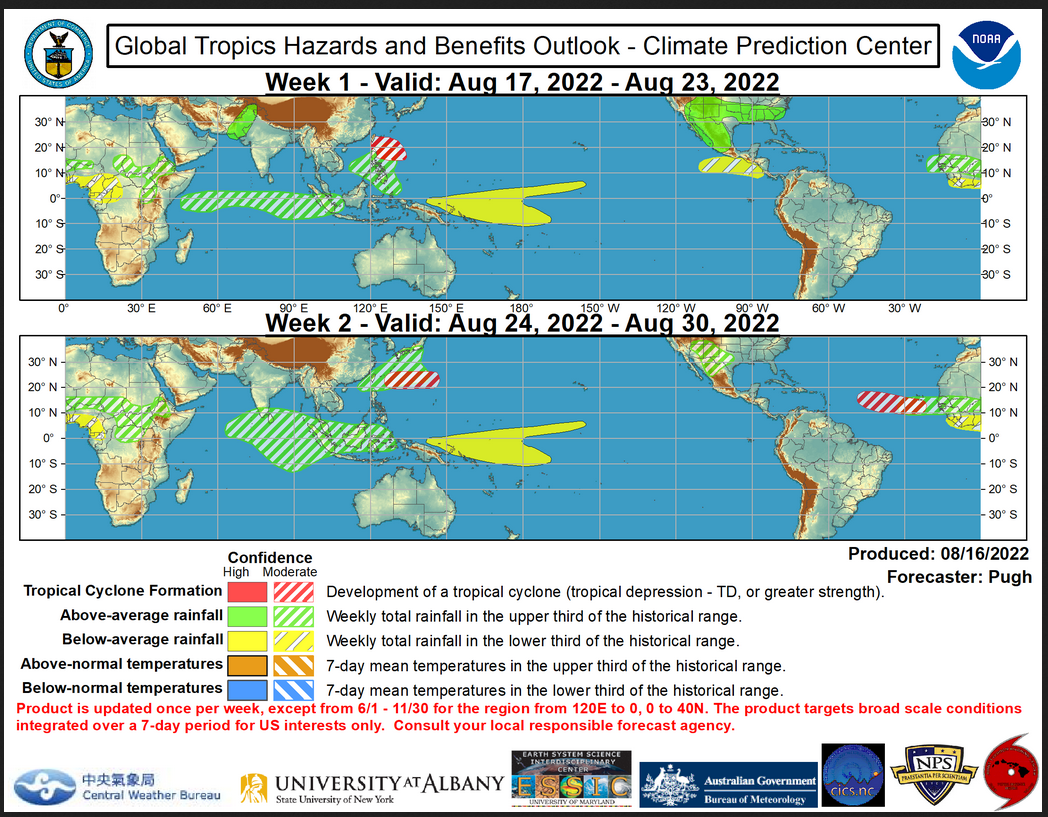
(This graphic updates on Tuesdays) If it has not been updated, you can get the update by clicking here
Detailed Maps and Reports for the Western Atlantic and the Pacific Oceans
Below are three maps that summarize the situation for the Atlantic, Eastern and Central Pacific. Additional information can be accessed by clicking HERE
First the Atlantic
Click to view the forecast map and have access to additional information https://www.nhc.noaa.gov/gtwo.php?basin=atlc&fdays=5
Then Eastern Pacific
Click to view the forecast map and have access to additional information https://www.nhc.noaa.gov/gtwo.php?basin=epac&fdays=5
Then Central Pacific
Click to view the forecast map and have access to additional information https://www.nhc.noaa.gov/gtwo.php?basin=cpac&fdays=5
And the Western Pacific
Click to view the forecast map and have access to additional information https://www.metoc.navy.mil/jtwc/jtwc.html
Some Intermediate-Term Outlooks
Links to “Outlook” maps and discussions for three time periods. Days 6 – 10, Days 8 – 14, and Weeks 3 and 4. An outlook differs from a forecast based on how NOAA uses these terms in that an “outlook” presents information from deviation from normal and the likelihood of these deviations.
You have to click on the links because they do not update automatically and I do not want to have stale images in the article. But it is not difficult to click on a link and you get a large image plus a discussion. On Fridays in a separate article, we will show the images and provide a link in this article that article. But remember what you will see is the images as of Friday. But here you can get the current images simply by clicking on them. Then hit the return arrow at the upper left of your screen to return to the article. You will not find this information easily anywhere else.

Right now you can find these maps here (We show them every Friday there but you can click above and find them).
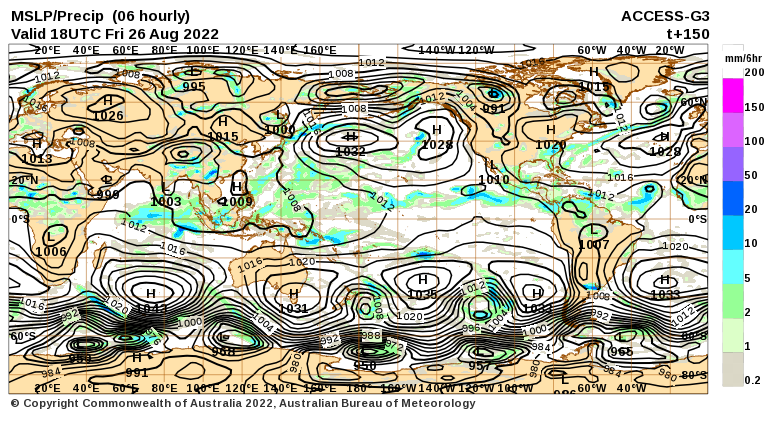
World Forecast for Day 6 (Currently Set for Day 6 but the reader can change that)
World Weather Forecast produced by the Australian Bureau of Meteorology. Unfortunately, I do not know how to extract the control panel and embed it into my report so that you could use the tool within my report. But if you visit it Click Here and you will be able to use the tool to view temperature or many other things for THE WORLD. It can forecast out for a week. Pretty cool. Return to this report by using the “Back Arrow” usually found top left corner of your screen to the left of the URL Box. It may require hitting it a few times depending on how deep you are into the BOM tool. Below are the current worldwide precipitation and air pressure forecasts for six days out. They will not auto-update and right now are current for Day 6. If you want the forecast for a different day Click Here I will try to update this map each day but you have the link so you can access the dashboard and get a wide variety of forecasts.
I mostly rely on the reader to interpret world maps. For this map, areas of expected precipitation for the date and time shown are clearly shown.
The number of High-Pressure systems shown is called the Wave Number. Maybe I will discuss WN someday. But it shows how many Rossby Waves there are around the World. Sometimes they are hard to count. Counting Low-Pressure systems should provide the same WN. Rossby Waves are the way the temperature distribution of the Planet remains in balance. It is basically the science of fluid dynamics. It can be very helpful in predicting the movement of weather patterns. You can snip an area of interest and move it into MS Paint and enlarge it.
Month to Date Information
Month to date Temperature can be found at https://hprcc.unl.edu/products/maps/acis/MonthTDeptUS.png
Month to date Precipitation can be found at https://hprcc.unl.edu/products/maps/acis/MonthPNormUS.png