This is still an experimental article (we are working to be sure all the images update)
Here is what we are paying attention to this evening and the next two days from this afternoon’s NWS Forecast:
...Widespread showers and thunderstorms with excessive rainfall and severe
weather possible through Friday from the High Plains to the East Coast...

...Dangerous heat and humidity to continue from parts of the
Central/Southern Plains to the Mid-Atlantic and Southeast...
Continuation of the NWS Short Range Forecast (It is updated twice a day and these updates can be found here.
Weather highlights and hazards for the short-term forecast period will be
largely dominated by a persistent upper-level ridge over the central U.S.
and a quasi-stationary frontal boundary draped from the High Plains to the
Mid-Atlantic. Upper-level disturbances moving southeastward along the
ridge as well as high surface moisture (low to mid-70s dewpoints) along
the frontal boundary will help to trigger widespread showers and
thunderstorms both today and Friday, with multiple areas under the risk of
excessive rainfall and severe thunderstorms each day. Today, there are
Slight Risks of excessive rainfall (level 2/4) for the coastal Carolinas,
the Middle-Mississippi/Ohio Valleys, and the Northern Plains. Slight Risks
are also again in effect for the Middle-Mississippi/Ohio Valleys and the
southern Appalachians as well as the coastal Carolinas on Friday. The
combination of greater areal coverage of rainfall from organized
convective complexes, high moisture content leading to efficient rainfall
rates, and proceeding days of heavy rainfall leading to more saturated
soils will lead to the risk for isolated to scattered instances of flash
flooding. The Storm Prediction Center has also issued Slight Risk outlook
areas for severe thunderstorms (level 2/5) from the Tennessee Valley to
the Carolinas as well as the Northern Rockies and High Plains today. Some
thunderstorms may produce damaging winds, and large hail will also be a
threat in the Northern Rockies and High Plains. A Slight Risk is also in
effect for the Northern Rockies and High Plains on Friday for the
continued risk of scattered instances of damaging winds and large hail.
Thunderstorms in this region may also have the tendency to grow upscale
into organized convective lines in the evening hours, enhancing the threat
for damaging winds.

Meanwhile, a dangerous heat wave continues south of the frontal boundary
over the Central/Southern Plains to the southern Mid-Atlantic and
Southeast. High temperatures are forecast to be in the low 100s for most
of the Central/Southern Plains and east into the Mid-South and Tennessee
Valley today. Mid-to-upper 90s are expected elsewhere from the Ohio Valley
to the Mid-Atlantic and Southeast. These already hot temperatures will be
made even more uncomfortable when combined with the high humidity in place
across the region. Excessive Heat Warnings are in effect today for areas
from Kansas City east to St Louis and Louisville and south to Memphis as
heat indices will soar into the 110-115 degree range. Widespread Heat
Advisories are also in effect for the region through Friday for still very
uncomfortable heat indices in the 105-110 degree range. Just as
concerning, low temperatures will remain very warm overnight providing
little relief from the sweltering conditions during the day. Near
record-tying/breaking forecast lows from the mid-70s to low-80s are
expected. Excessive heat is especially dangerous for vulnerable
populations. Be sure to check in on friends and loved ones frequently.

Elsewhere, to the northeast of the ridge, temperatures will remain cooler
than normal for New England, with highs in the 70s along the coast and the
low 80s inland. An upper-level trough over the Pacific Northwest will also
keep temperatures cooler than normal for early July, with mostly 70s and
low 80s expected. However, conditions should remain mostly dry. High
temperatures for California and the Great Basin will tend to be around or
a bit cooler than normal, with 60s-70s along the immediate coast, 80s to
90s in the interior valleys, and 100s for the Desert Southwest. Elevated
fire weather concerns continue over the Great Basin through Friday.
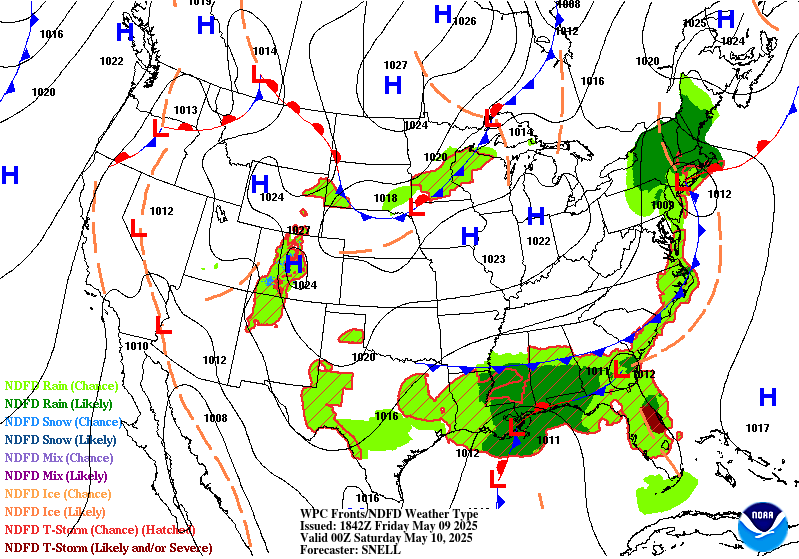
Some of the Images Associated with the Short-Range Forecast
First, the Day One and Two CONUS Forecasts: These Maps Update Daily.
| Day One CONUS Forecast | Day Two CONUS Forecast |
 |
 |
| These graphics update and can be clicked on to enlarge. You can see where the weather will be | |
The links for these two maps are https://origin.wpc.ncep.noaa.gov/NationalForecastChart/staticmaps/noaad1.png and https://origin.wpc.ncep.noaa.gov/NationalForecastChart/staticmaps/noaad2.png
This should play out something like shown in this 60 Hour Forecast Animation
Here is a national animation of weather fronts and precipitation forecasts with four 6-hour projections of the conditions that will apply covering the next 24 hours and a second day of two 12-hour projections the second of which is the forecast for 48 hours out and to the extent it applies for 12 hours, this animation is intended to provide coverage out to 60 hours. Beyond 60 hours, additional maps are available at links provided below. The explanation for the coding used in these maps, i.e. the full legend, can be found here although it includes some symbols that are no longer shown in the graphic because they are implemented by color-coding.

Click here to update this animation
Click here for the latest complete Day 3 -7 Hazards forecast which updates only on weekdays. It includes the full discussion which I do not update in this article but I only present the highlights.
HAZARDS OUTLOOKS
Now the Day 3 – 7 Hazards Outlook Maps

The orange and red outlined areas are what is most concerning of the forecasted Day 3 – 7 Hazards. This graphic does not update during the weekend. There is a discussion that goes with this graphic and you can access that discussion here.
Looking out one more week
 https://www.cpc.ncep.noaa.gov/products/predictions/threats/hazards_d8_14_contours.png
21 to 28 Day Forecast/Outlook (On Thursday it is a 22 day forecast and when the Week 3 – 4 Forecast Updates on Friday it becomes a 28 day forecast)

Very short-term forecasts (expressed as absolute values) and then intermediate-term outlooks (deviations from Normal and associated probabilities.
First Short-Term
Day 3 Maximum Temperature

Then two views of cumulative precipitation.
Here are the short-term precipitation forecasts. First the cumulative for Days 1 – 3

Then cumulative for Days 1 – 7

Links to “Outlook” maps and discussions for three time periods. Days 6 – 10, Days 8 – 14, and Weeks 3 and 4. An outlook differs from a forecast based on how NOAA uses these terms in that an “outlook” presents information from deviation from normal and the likelihood of these deviations.
I have not figured out how to have these maps update. So you will have to click on the links provided. You will get the updated forecasts plus a lot of additional information. Once a week I will provide those maps either in this article or more likely in a separate article. They are here for you right now you just have to click the link.
Worldwide Tropical Forecast
(This graphic updates on Tuesdays) If it has not updated you can get the update by clicking here https://www.cpc.ncep.noaa.gov/products/precip/CWlink/ghazards/images/gth_small.png
–

–
Now More Detail for the Western Atlantic and the Pacific Oceans
Below are three maps that summarize the situation for the Atlantic, Eastern and Central Pacific. Additional information can be accessed by clicking HERE
First the Eastern Pacific
Click to view the forecast map and have access to additional information https://www.nhc.noaa.gov/gtwo.php?basin=atlc&fdays=5
Then Eastern Pacific
Click to view the forecast map and have access to additional information https://www.nhc.noaa.gov/gtwo.php?basin=epac&fdays=5
Then Central Pacific
Click to view the forecast map and have access to additional information https://www.nhc.noaa.gov/gtwo.php?basin=cpac&fdays=5
And the Western Pacific
Click to view the forecast map and have access to additional information https://www.metoc.navy.mil/jtwc/jtwc.html
Now to our More Detailed Weather Report
500 MB Mid-Atmosphere View
The map below is the mid-atmosphere 3-Day chart rather than the surface highs and lows and weather features. In some cases, it provides a clearer less confusing picture as it shows only the major pressure gradients. This graphic auto-updates so when you look at it you will see NOAA’s latest thinking. The speed at which these troughs and ridges travel across the nation will determine the timing of weather impacts. This graphic auto-updates I think every six hours and it changes a lot. Thinking about clockwise movements around High-Pressure Systems and counterclockwise movements around Low-Pressure Systems provides a lot of information.


| Day 3 Above, 6 Below | Day 4 Above,7 Below | Day 5 Above. |
 |
 |
 |
 |
 |
 |
This graphic is about Atmospheric Rivers i.e. thick concentrated movements of water moisture. More explanation on Atmospheric Rivers can be found by clicking here or if you want more theoretical information by clicking here. The idea is that we have now concluded that moisture often moves via narrow but deep channels in the atmosphere (especially when the source of the moisture is over water) rather than being very spread out. This raises the potential for extreme precipitation events.

 https://econcurrents.com/wp-admin/_wp_link_placeholder
World Forecast
Forecast for Day 6 (Currently Set for Day 6 but the reader can change that)
World Weather Forecast produced by the Australian Bureau of Meteorology. Unfortunately, I do not know how to extract the control panel and embed it into my report so that you could use the tool within my report. But if you visit it Click Here and you will be able to use the tool to view temperature or many other things for THE WORLD. It can forecast out for a week. Pretty cool. Return to this report by using the “Back Arrow” usually found top left corner of your screen to the left of the URL Box. It may require hitting it a few times depending on how deep you are into the BOM tool.
Below are the current worldwide precipitation and temperature forecasts for six days out. They will auto-update and be current for Day 6 whenever you view them. If you want the forecast for a different day Click Here

Again, please remember this graphic updates every six hours so the diurnal pattern can confuse the reader.
Now Precipitation

Month to Date Information
Temperature

Precipitation

Month to date Temperature can be found at https://hprcc.unl.edu/products/maps/acis/MonthTDeptUS.png
Month to date Precipitation can be found at https://hprcc.unl.edu/products/maps/acis/MonthPNormUS.png