This is still an experimental article so it has some problems that need to be worked on especially the tropical section.
Here is what we are paying attention to this afternoon (Saturday) and the next two days from the Saturday afternoon NWS Forecast.:
...Tropical Storm Colin to track from the Southeast/southern Mid-Atlantic
Coast today before moving offshore on Sunday...

...Wet weather, isolated Flash Flooding and Severe thunderstorms possible
across the Southeast quarter of the nation and from the Central to
Northern Plains into the Northern Rockies, Northwest and from portions of
the Southwest into the Southern Rockies...

...Areas extending from the West Coast inland through the Great Basin and
Northern Rockies will have cooler than average temperature  while the
Plains into the Ohio and Tennessee Valleys and Great Lakes will be warmer
than average temperatures...

...Critical fire weather conditions to persist across the Great Basin this
weekend..

Short Range Forecast
The National Weather Service Weather Prediction Center Discussion can be found here. It is updated twice a day.
Now, the Day One and Two CONUS Forecasts: These Maps Update Daily.
| Day One CONUS Forecast | Day Two CONUS Forecast |
 |
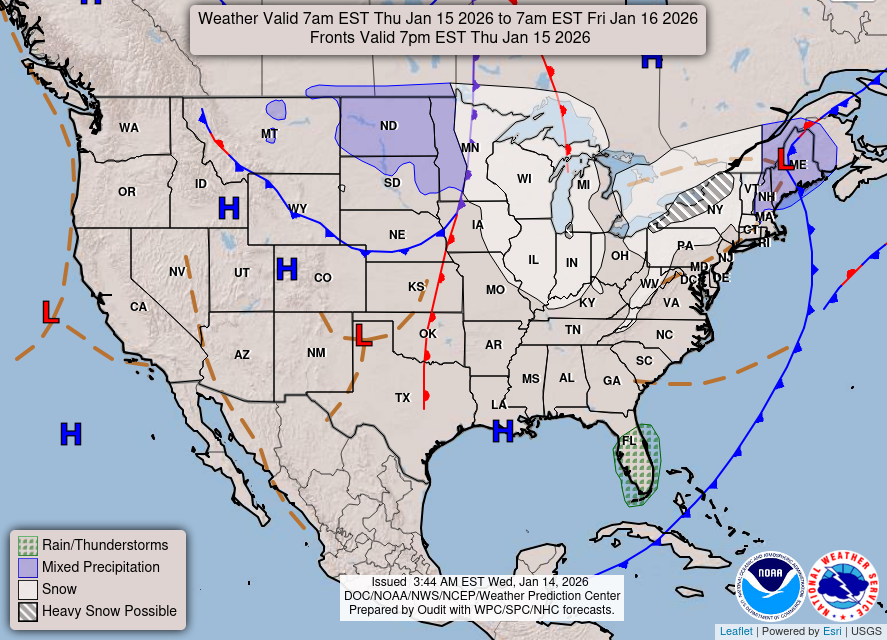 |
| These graphics update and can be clicked on to enlarge. You can see where the weather will be | |
The links for these two maps are https://origin.wpc.ncep.noaa.gov/NationalForecastChart/staticmaps/noaad1.png and https://origin.wpc.ncep.noaa.gov/NationalForecastChart/staticmaps/noaad2.png
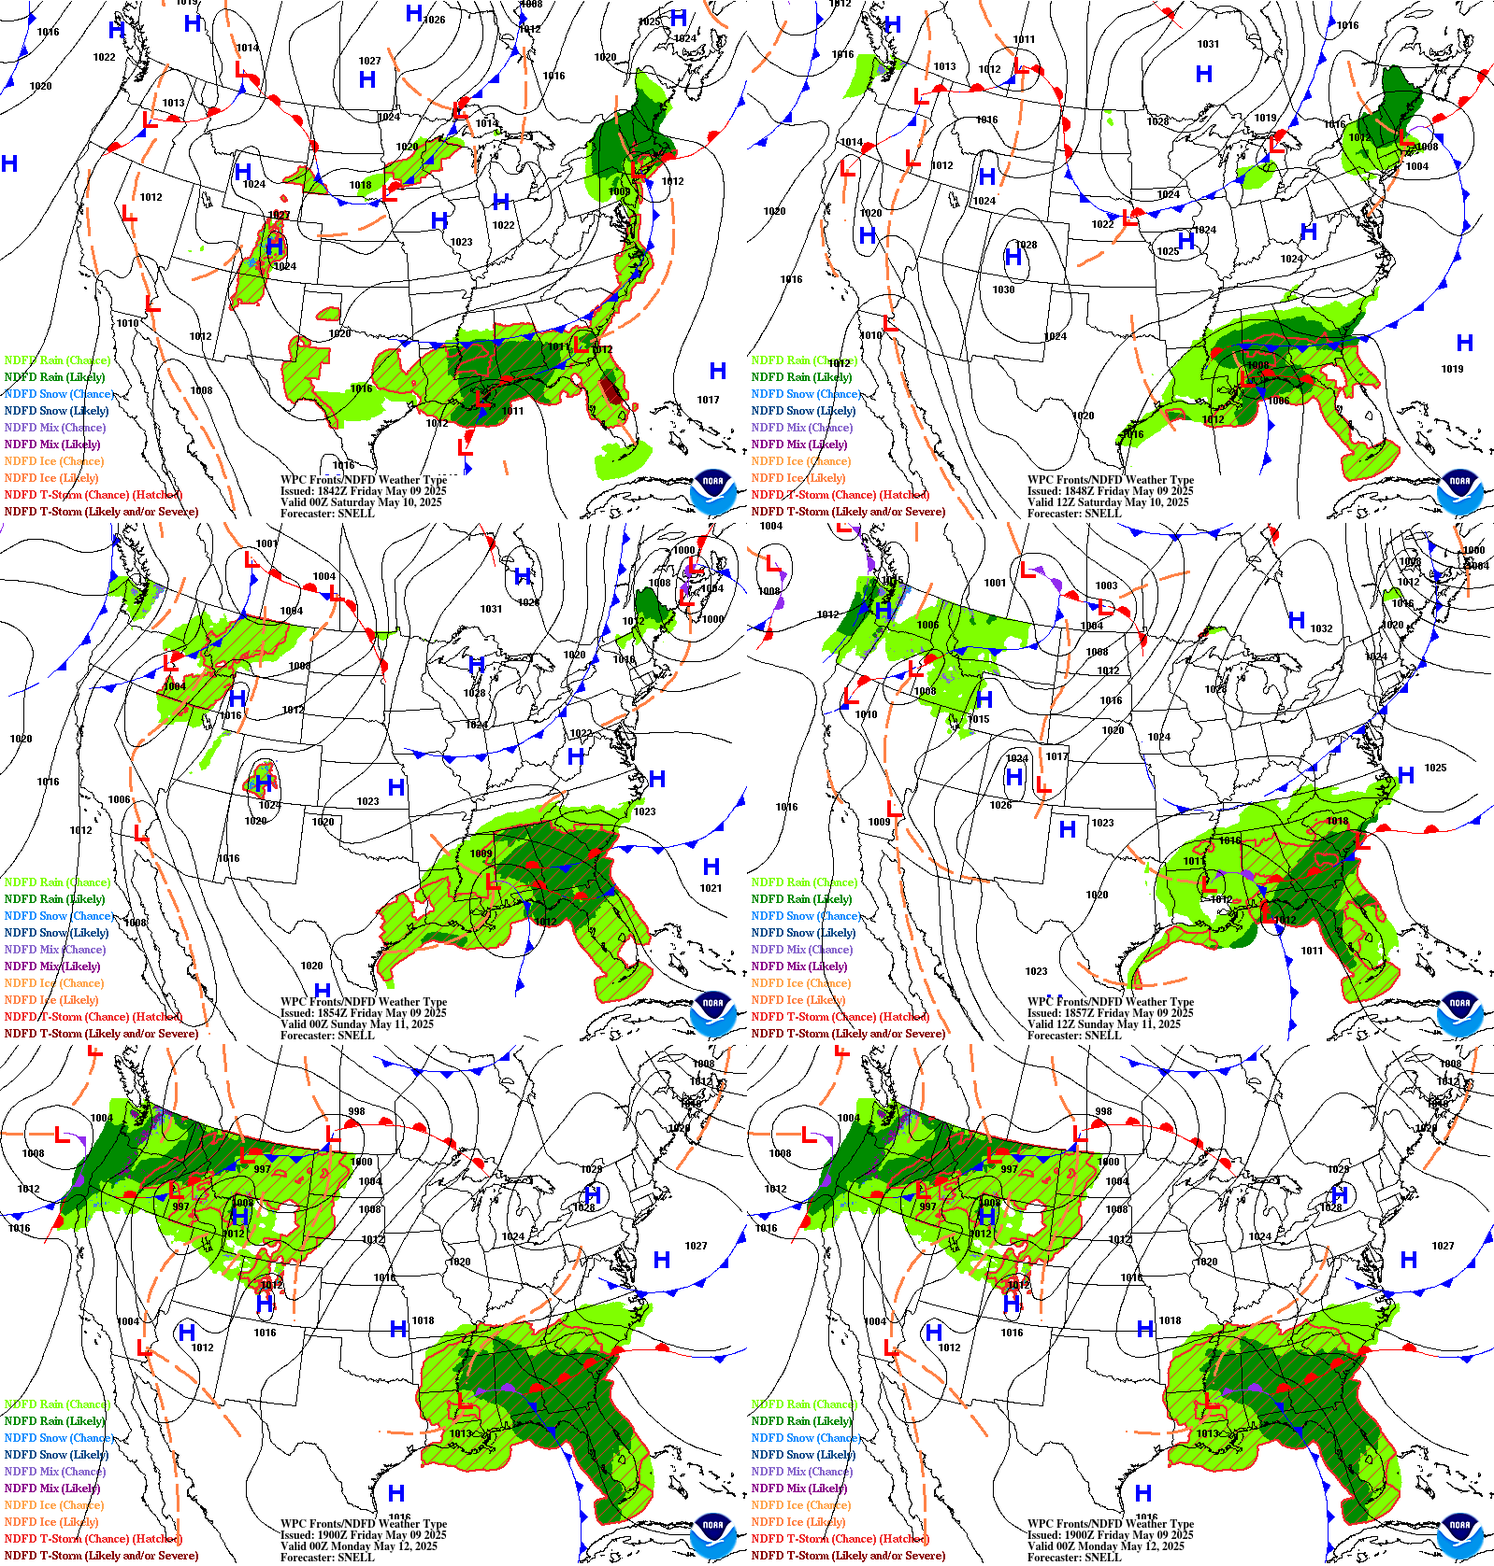
This should play out something like shown in this 60 Hour Forecast Animation
Here is a national animation of weather fronts and precipitation forecasts with four 6-hour projections of the conditions that will apply covering the next 24 hours and a second day of two 12-hour projections the second of which is the forecast for 48 hours out and to the extent it applies for 12 hours, this animation is intended to provide coverage out to 60 hours. Beyond 60 hours, additional maps are available at links provided below. The explanation for the coding used in these maps, i.e. the full legend, can be found here although it includes some symbols that are no longer shown in the graphic because they are implemented by color-coding.
Click here for the latest complete Day 3 -7 Hazards forecast which updates only on weekdays. It includes the full discussion which I do not update in this article but I only present the highlights.
HAZARDS OUTLOOKS
Now the Day 3 – 7 Hazards Outlook Maps
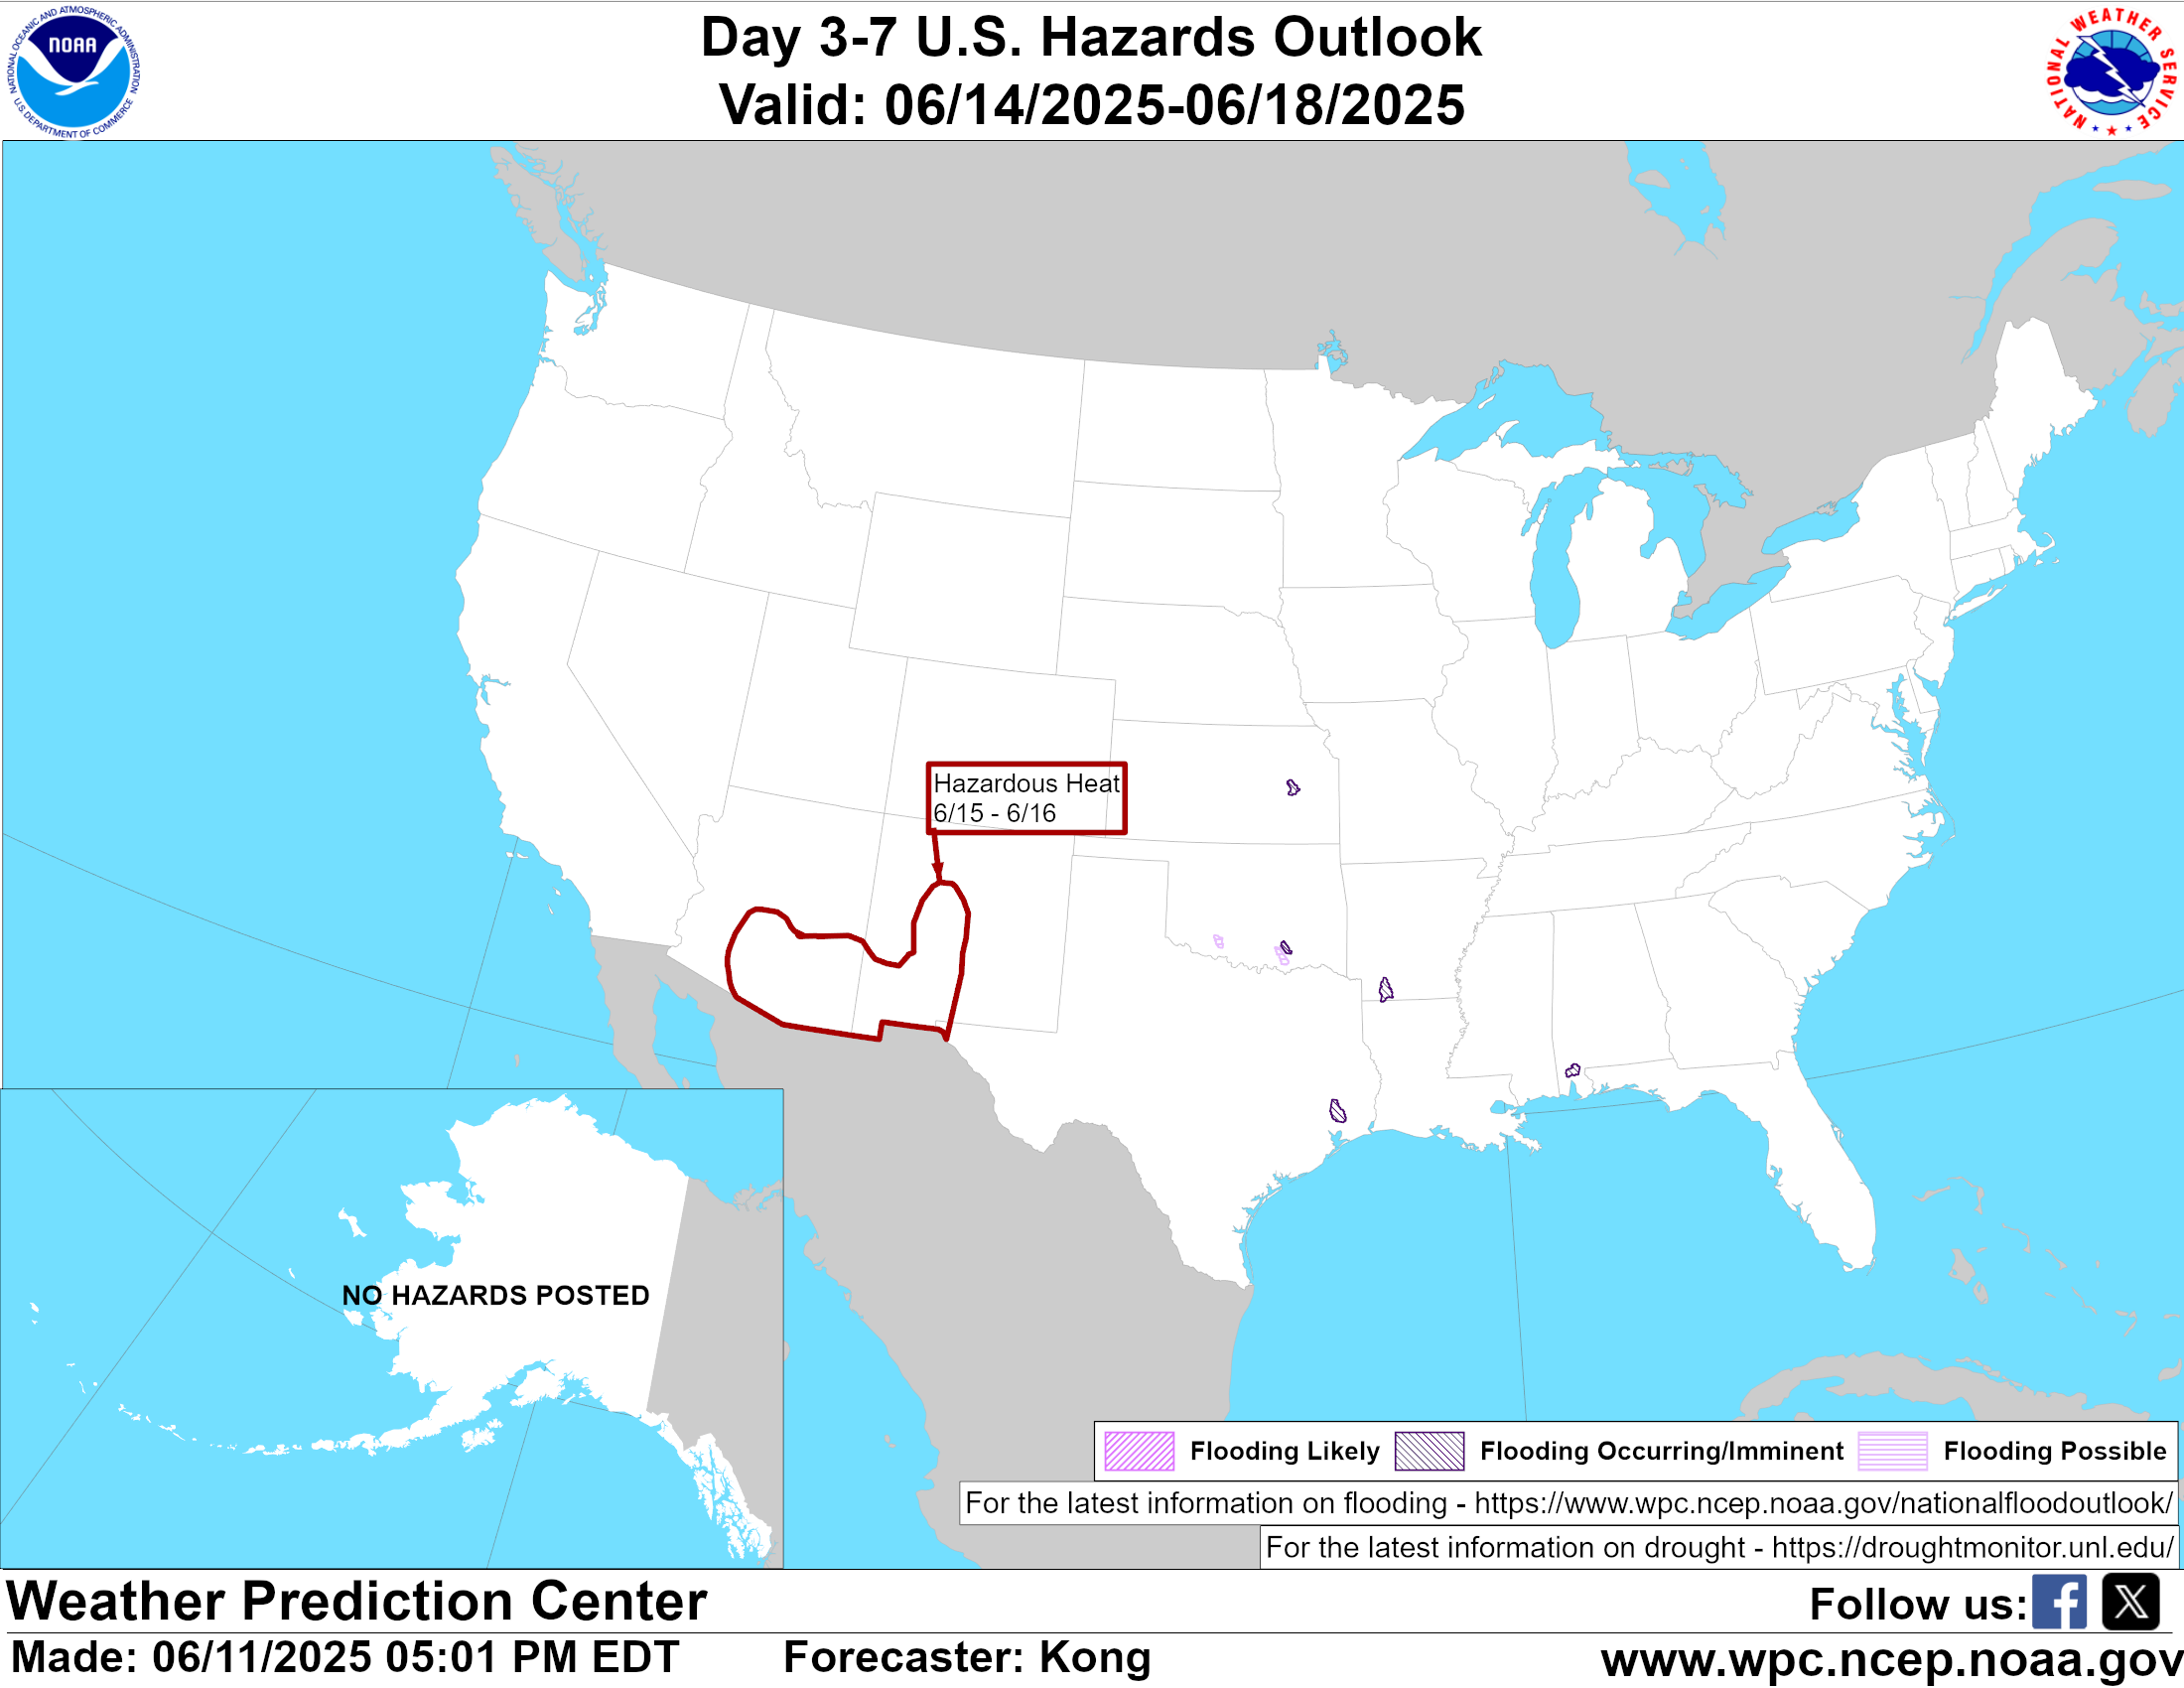
The orange and red outlined areas are what is most concerning of the forecasted Day 3 – 7 Hazards. This graphic does not update during the weekend. There is a discussion that goes with this graphic and you can access that discussion here.
Looking out one more week
 https://www.cpc.ncep.noaa.gov/products/predictions/threats/hazards_d8_14_contours.png
21 to 28 Day Forecast/Outlook (On Thursday it is a 22 day forecast and when the Week 3 – 4 Forecast Updates on Friday it becomes a 28 day forecast)
Very short-term forecasts (expressed as absolute values) and intermediate term outlooks (deviations from Normal and associated probabilities.
First Temperature
| Showing the forecasted Day 3 Max Temp and Day’s 6 – 10, Day’s 8 – 16 and Weeks 3 – 4 Outlooks |
Then precipitation
| Showing the forecasted Days 1 – 5 Cumulative precipitation and Day’s 6 – 10, Day’s 8 – 16 and Weeks 3 – 4 Outlooks |
Worldwide Tropical Forecast (This graphic updates on Tuesdays)

Now More Detail for the Western Atlantic and the Pacific Oceans
Below are three maps that summarize the situation for the Atlantic, Eastern and Central Pacific. Additional information can be accessed by clicking HERE
Atlantic and Gulf of Mexico

The Eastern Pacific

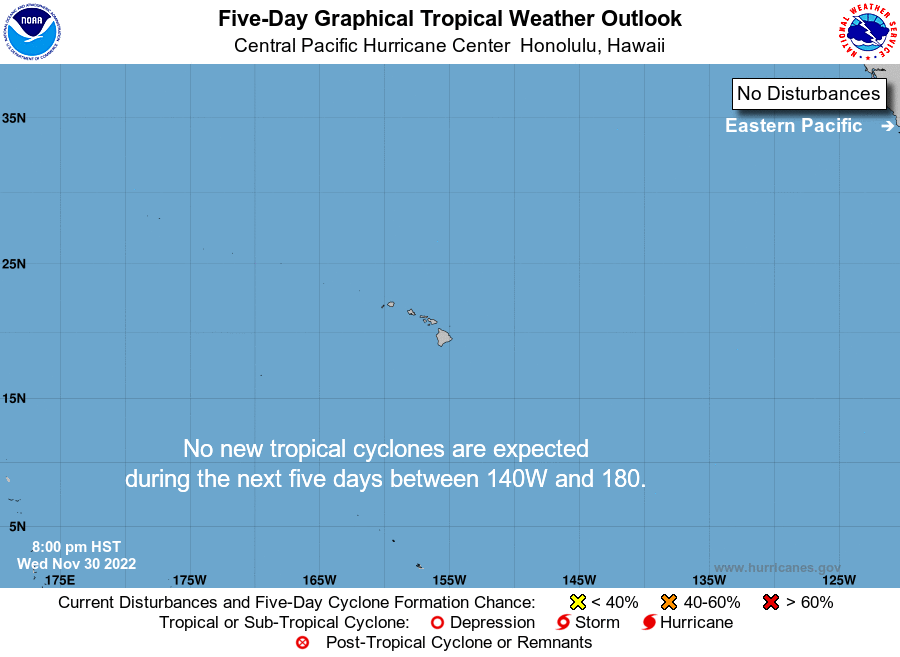
The Central Pacific
Repeating that updates on individual named storms can be obtained here.
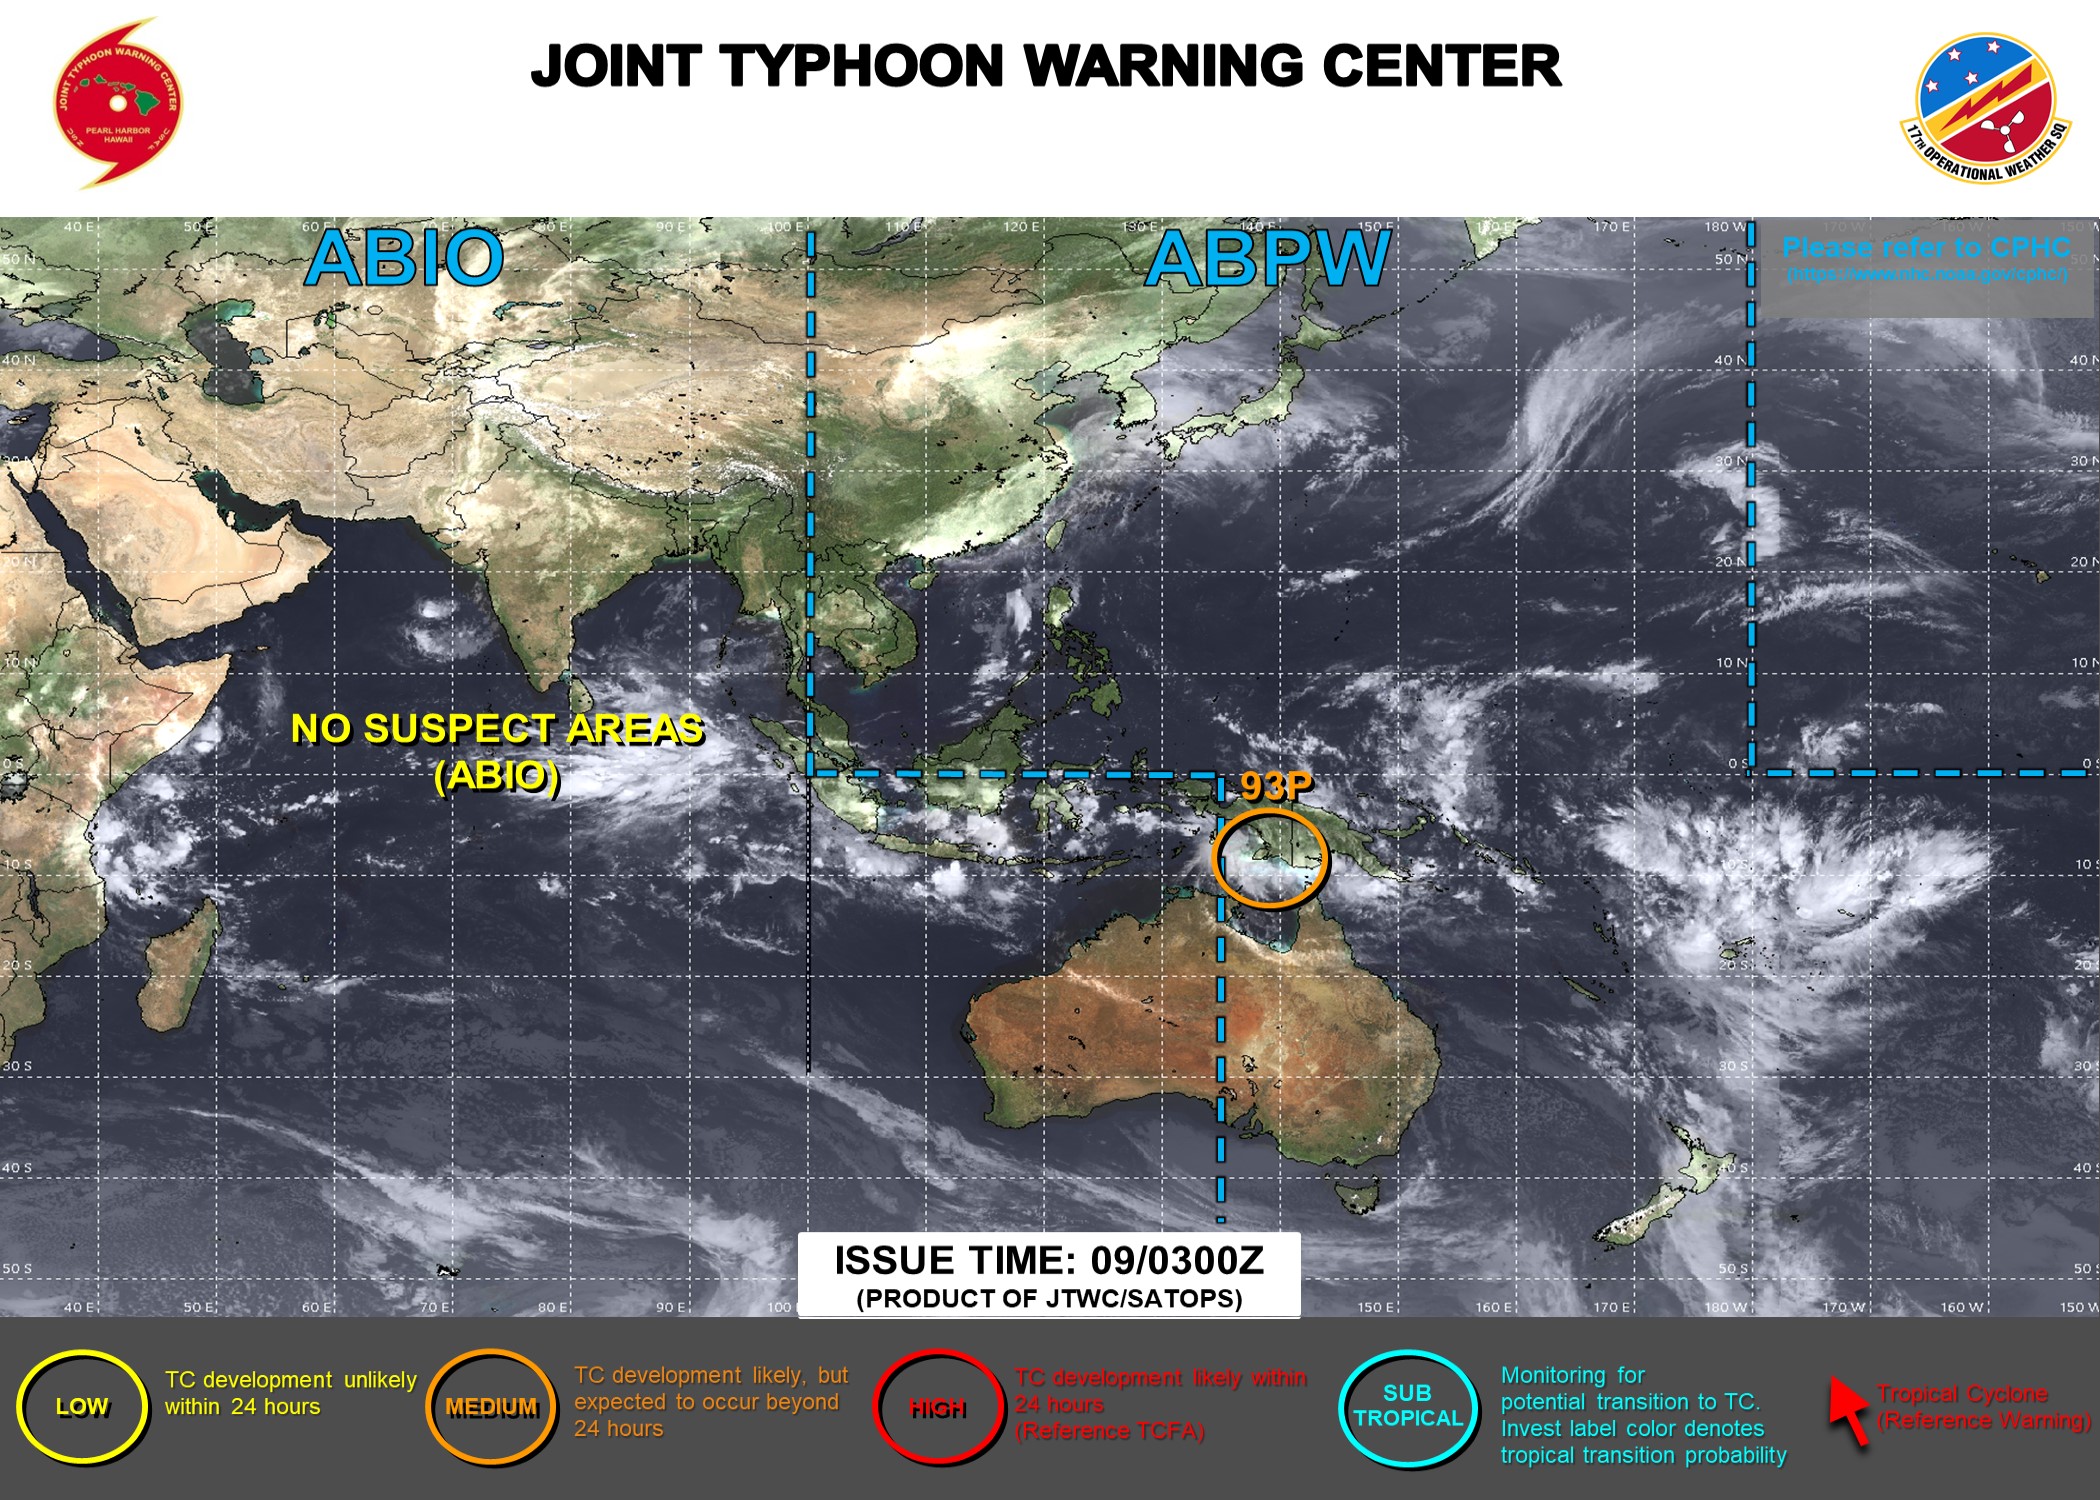
And the Western Pacific
500 MB Mid-Atmosphere View
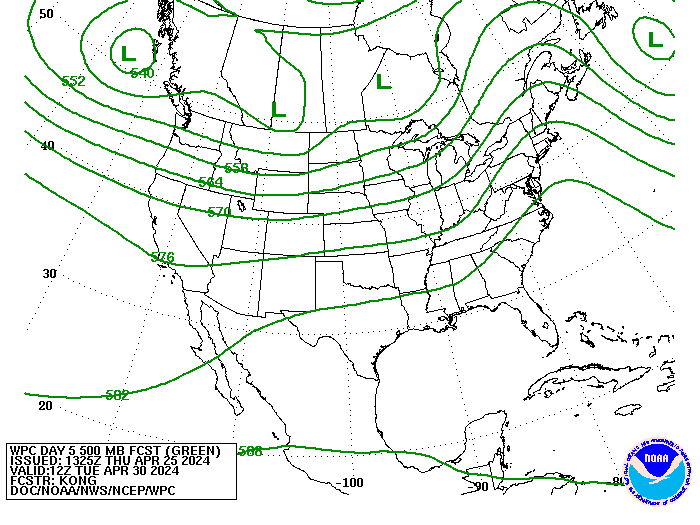
The map below is the mid-atmosphere 3-Day chart rather than the surface highs and lows and weather features. In some cases, it provides a clearer less confusing picture as it shows only the major pressure gradients. This graphic auto-updates so when you look at it you will see NOAA’s latest thinking. The speed at which these troughs and ridges travel across the nation will determine the timing of weather impacts. This graphic auto-updates I think every six hours and it changes a lot. Thinking about clockwise movements around High-Pressure Systems and counterclockwise movements around Low-Pressure Systems provides a lot of information.
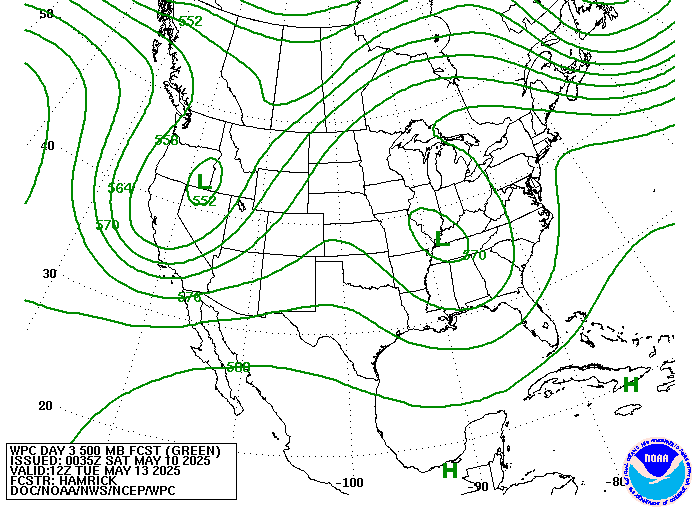
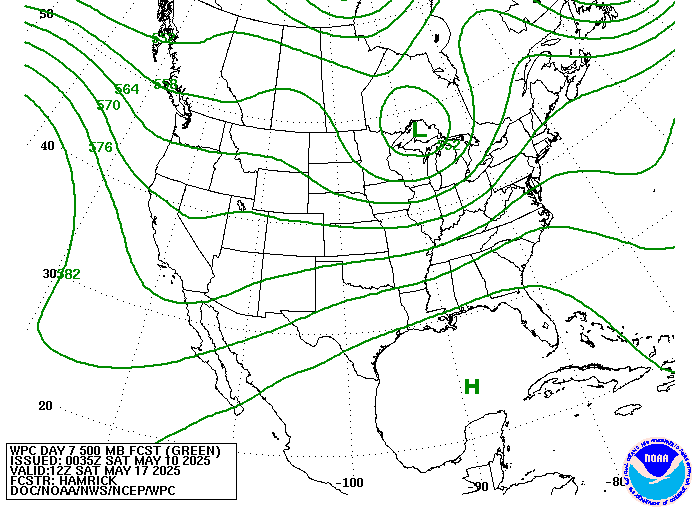
| Day 3 Above, 6 Below | Day 4 Above,7 Below | Day 5 Above. |
 |
 |
 |
 |
 |
 |
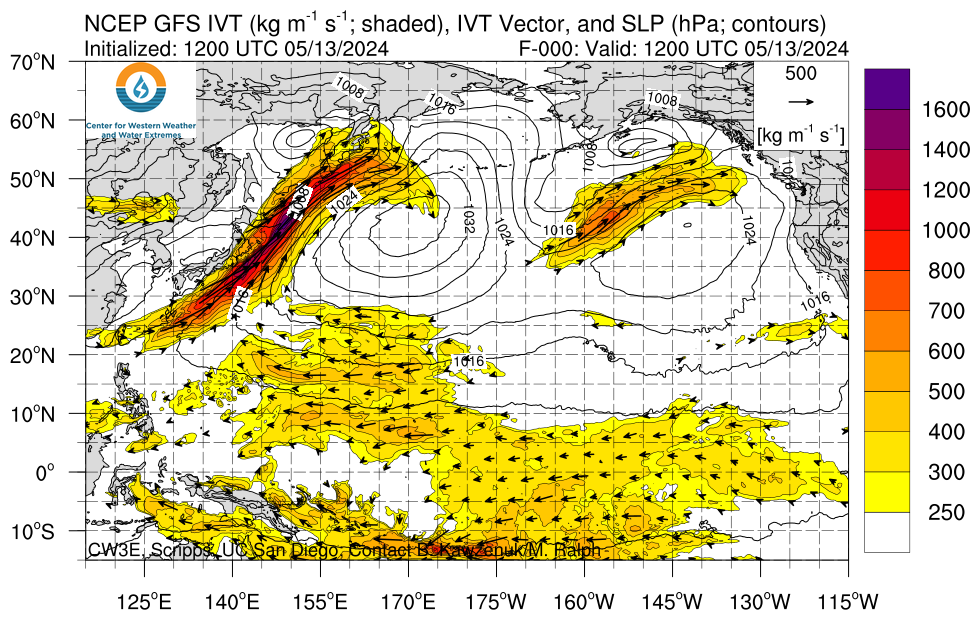
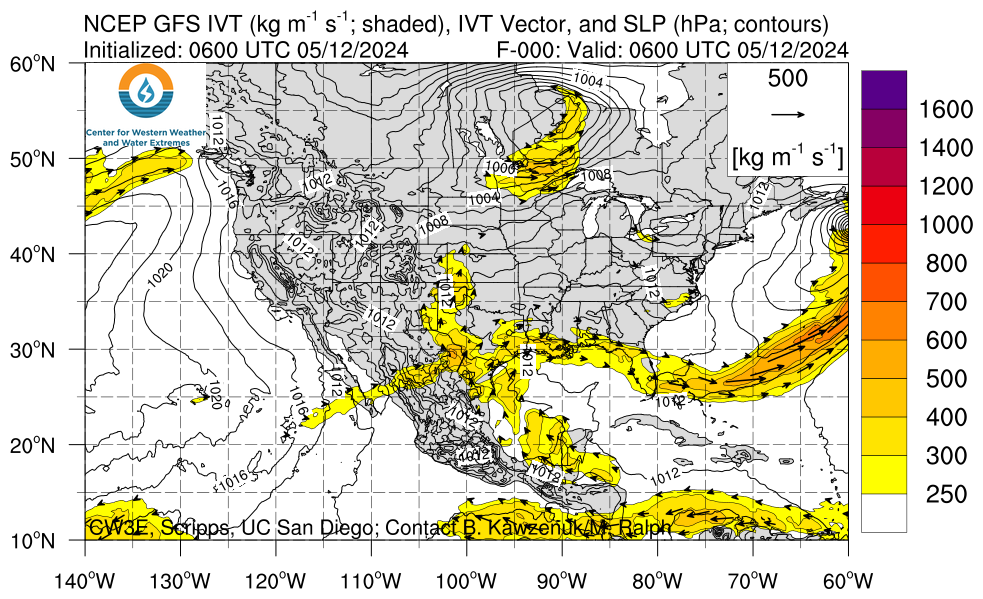
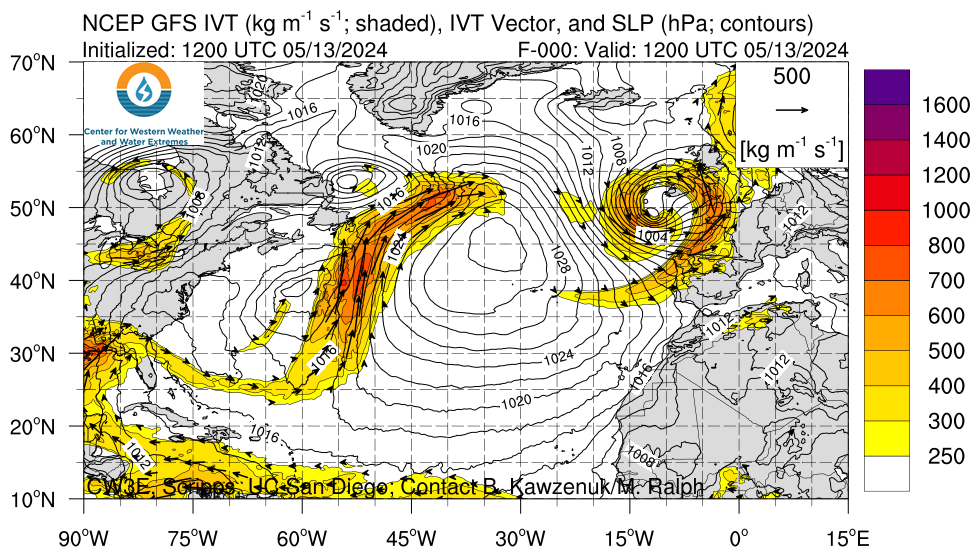
This graphic is about Atmospheric Rivers i.e. thick concentrated movements of water moisture. More explanation on Atmospheric Rivers can be found by clicking here or if you want more theoretical information by clicking here. The idea is that we have now concluded that moisture often moves via narrow but deep channels in the atmosphere (especially when the source of the moisture is over water) rather than being very spread out. This raises the potential for extreme precipitation events.
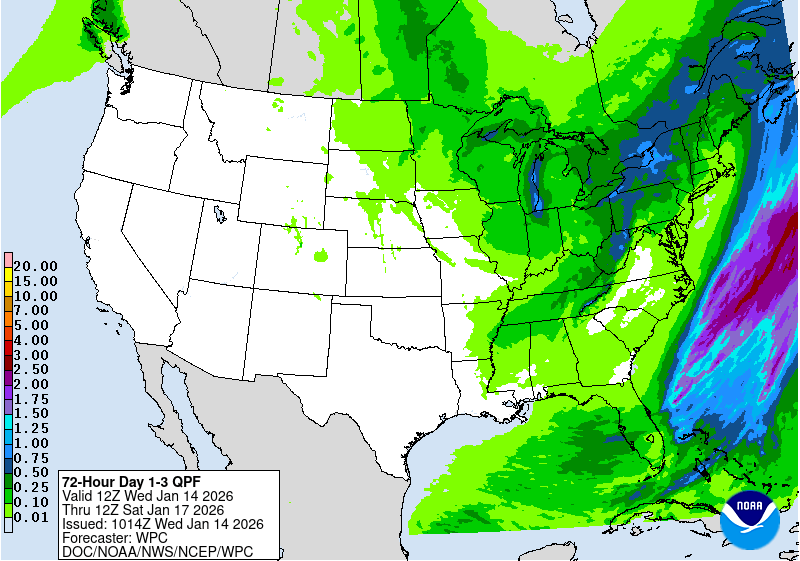
Here are the short-term precipitation forecasts. First the cumulative for Days 1 – 3
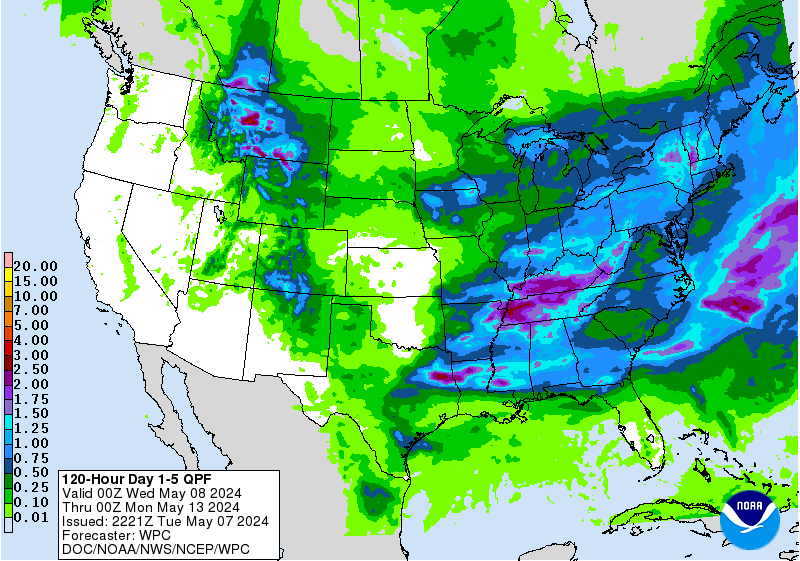
Then cumulative for Days 1 – 5
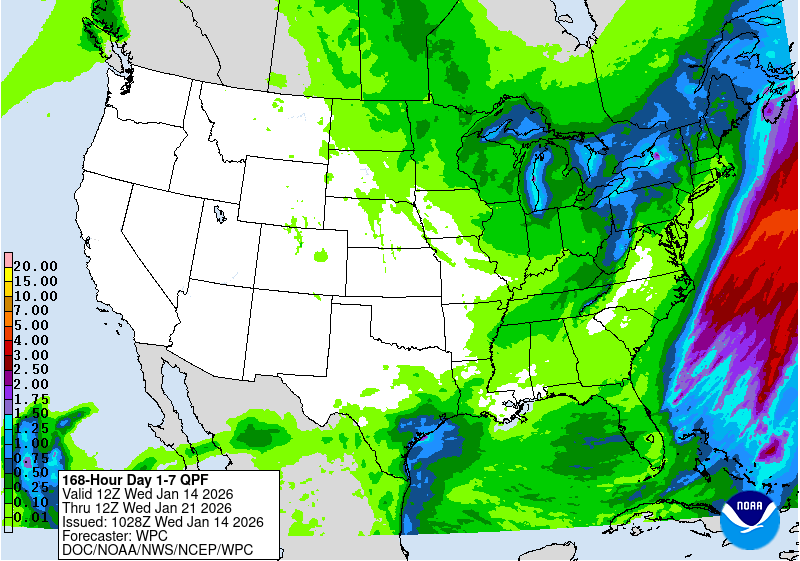
Then cumulative for Days 1 – 7
World Forecast
Forecast for Day 6 (Currently Set for Day 6 but the reader can change that)
World Weather Forecast produced by the Australian Bureau of Meteorology. Unfortunately, I do not know how to extract the control panel and embed it into my report so that you could use the tool within my report. But if you visit it Click Here and you will be able to use the tool to view temperature or many other things for THE WORLD. It can forecast out for a week. Pretty cool. Return to this report by using the “Back Arrow” usually found top left corner of your screen to the left of the URL Box. It may require hitting it a few times depending on how deep you are into the BOM tool. Below are the current worldwide precipitation and temperature forecasts for six days out. They will auto-update and be current for Day 6 whenever you view them. If you want the forecast for a different day Click Here
Again, please remember this graphic updates every six hours so the diurnal pattern can confuse the reader.
Now Precipitation

Month to Date Information
Temperature
Precipitation
Month to date Temperature can be found at https://hprcc.unl.edu/products/maps/acis/MonthTDeptUS.png
Month to date Precipitation can be found at https://hprcc.unl.edu/products/maps/acis/MonthPNormUS.png
