Updated at 0:15 AM EDT March 17, 2022 to include information on worldwide precipitation and the corresponding discussion.
Recently I published a podcast about February climate prepared by two meteorologists who work at CLIMAS. It focuses on why February was the way it was for the U.S. Southwest and West Coast.
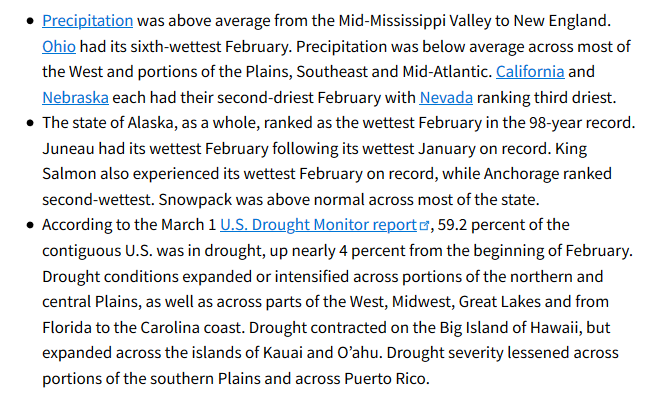
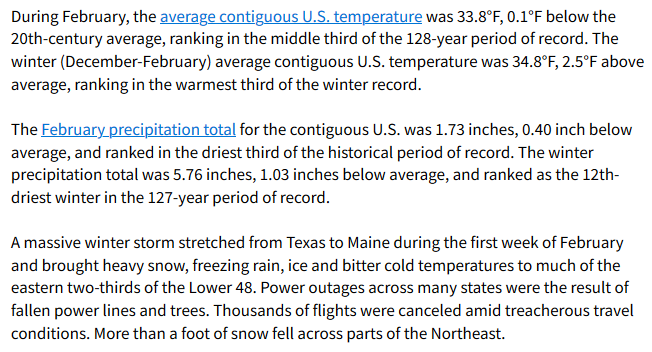
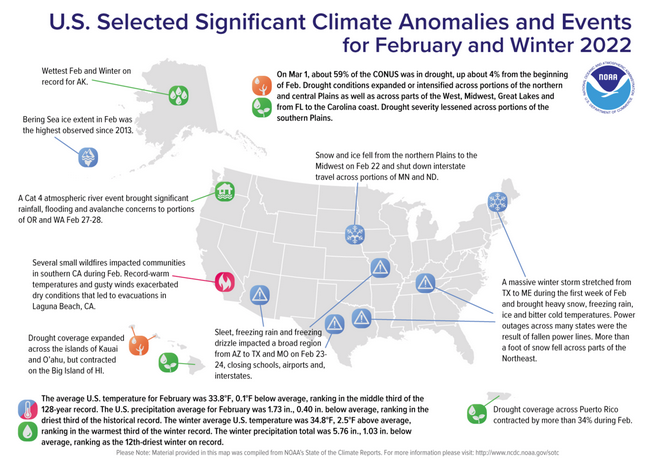
This is the official NCEI assessment of the U.S. Climate in February, 2022. it describes what it was not why it was. Sometimes I use an email that a PR person sends out on that report. This time I am working with the report itself. Plus there was some supplementary information provided and I am including some of that as well. The report is pretty complete so I only added a few comments to it. The main comment is that the last decade has been the warmest ever in modern times but that can be confusing if you say that this is the fifth warmest year ever (just an example). That could mean it is average for the last ten years. Although this article is mostly about CONUS plus Alaska, I have included the World temperature record for the last 128 Februaries.
The full report can be found at https://www.ncei.noaa.gov/news/national-climate-202202
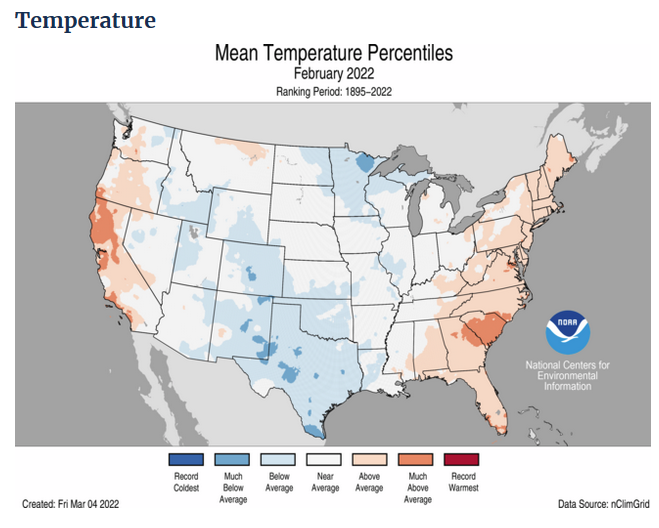
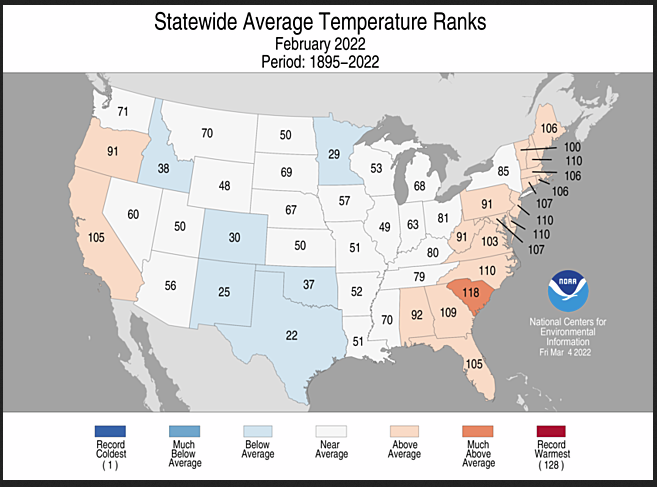
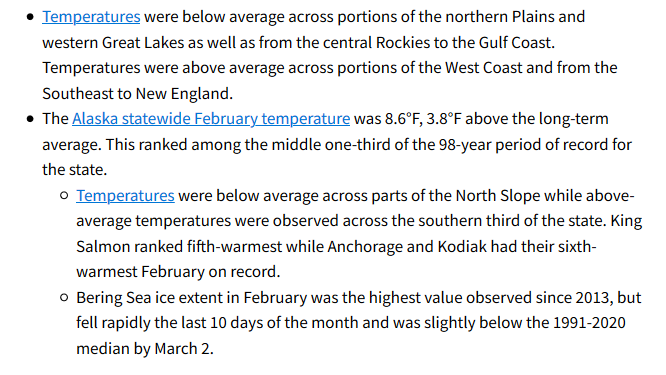 I prefer to use the state ranking map. Here it is:
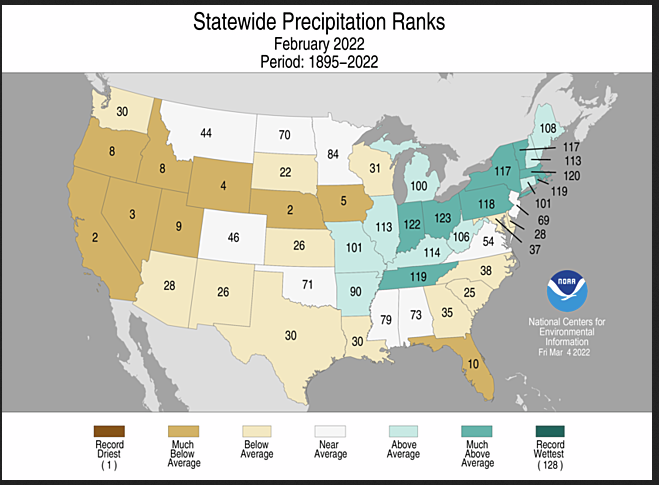
Now we will take a look at precipitation. It is the same data but shows the rankling for every state not just the ones that were mentioned in the NCEI discussion. There is a 128 years of data so 128 would mean the warmest February in the record and 1 would meant the coolest. Notice the Southwest was relatively cool. in the CLIMAS podcast I reported on a couple of days ago. Cool and dry is a lot better than warm and dry.
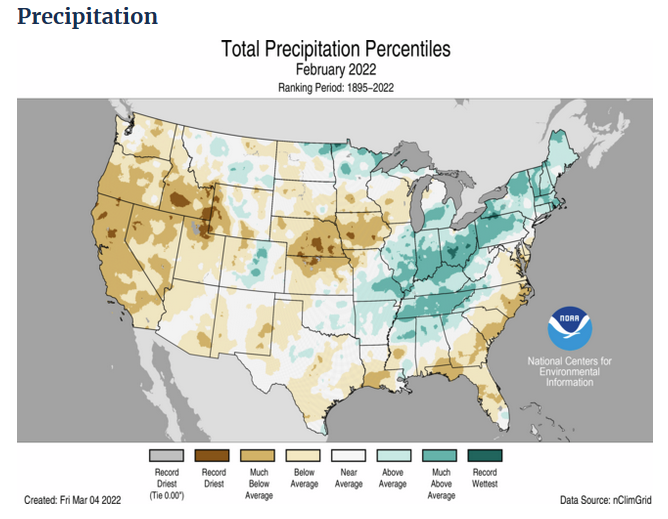
I prefer to use the state ranking maps. It is the same data but shows the rankling for every state not just the ones that were mentioned in the NCEI discussion.
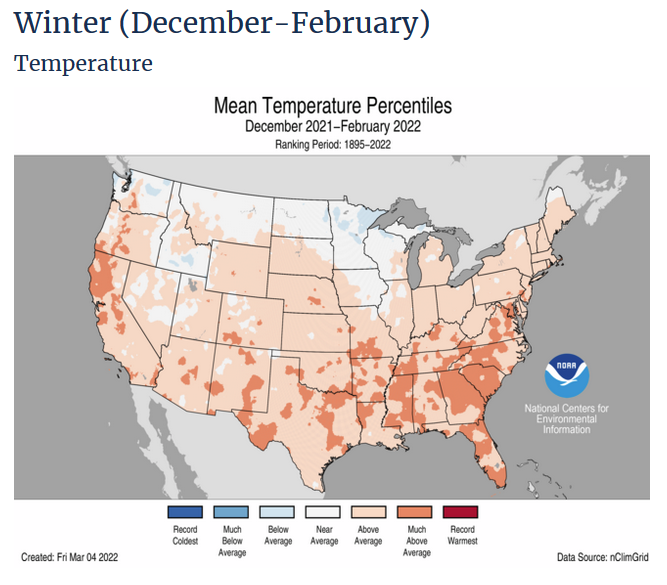
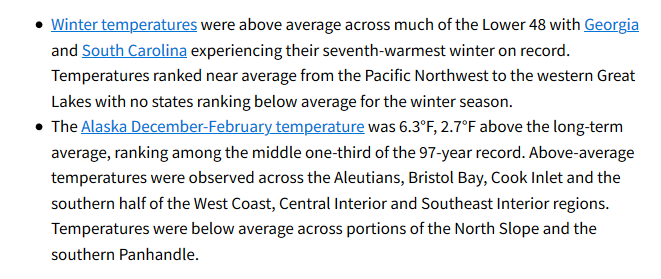
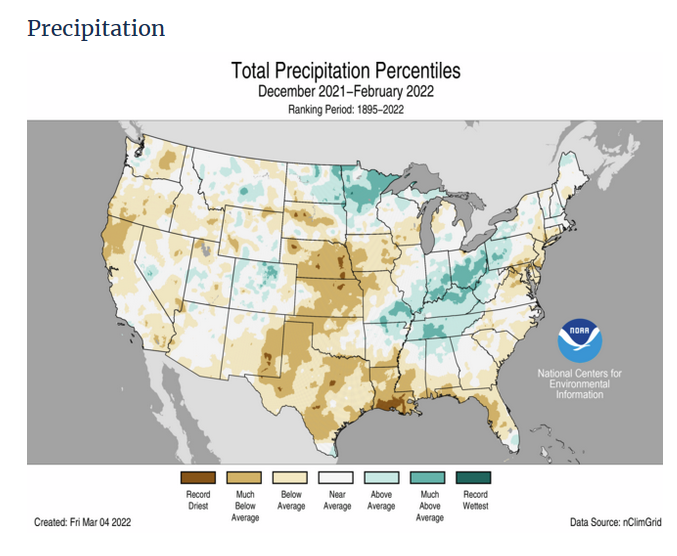
Now we are going to look at the three-month data. So this covers meteorological Winter.

Now we are going to take a long view but just for temperature. We are going to look at the trend in the anomalies over the entire period of what is considered to be good data.
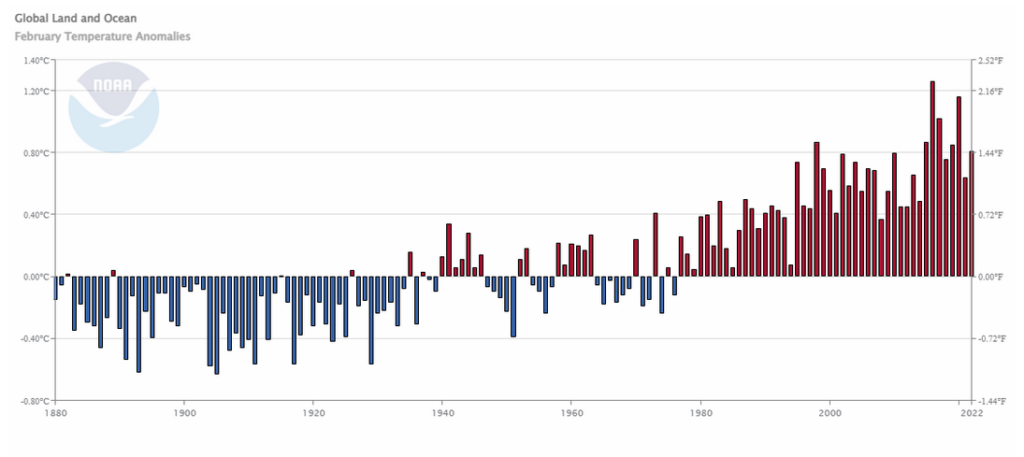 Notice this is World data not just CONUS plus Alaska data. The above is just for February but it shows that February 2022 was warm but not a record and not as warm as some recent years. So we can talk about how warm February was or we cold talk about how cool February was relative to the last eight years. Is not language interesting?
And we will also look at the Winter Period.
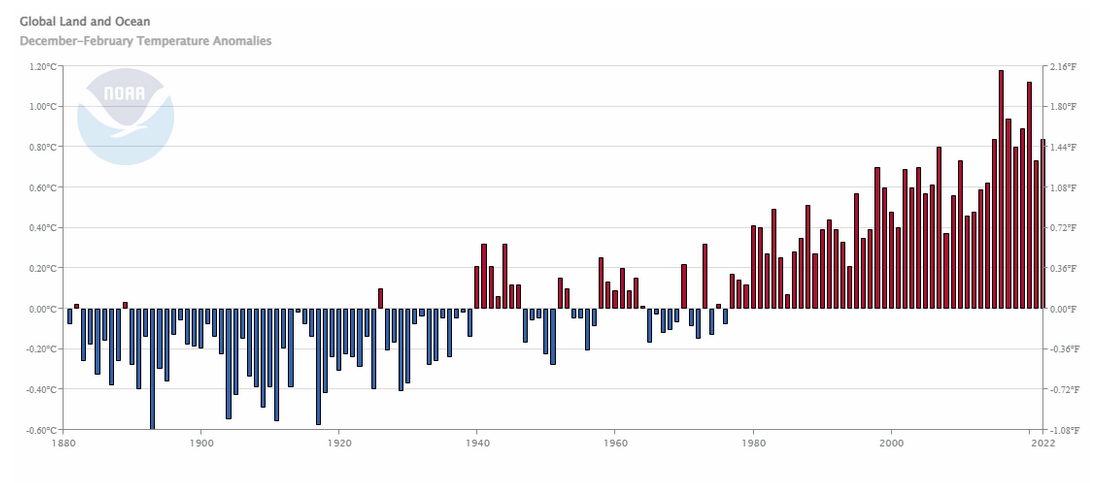
I do not see much difference between the February data and the three-month Winter Period.
The same data for precipitation does not seem to be available. The page where you would find it is not operational. One would not expect to see much change in World precipitation and it may be difficult to do this sort of analysis for precipitation but I was surprised that it was not available.
Adding a graphic on worldwide precipitation
I tried to find a similar graphic for precipitation. I know how to generate it myself but that part of the NCEI website was not working.
Using a search engine I found such a graphic which is not quite up to date and it is shown below. The graphic shows gross precipitation. And the graphic is not February or Winter but Annual precipitation.
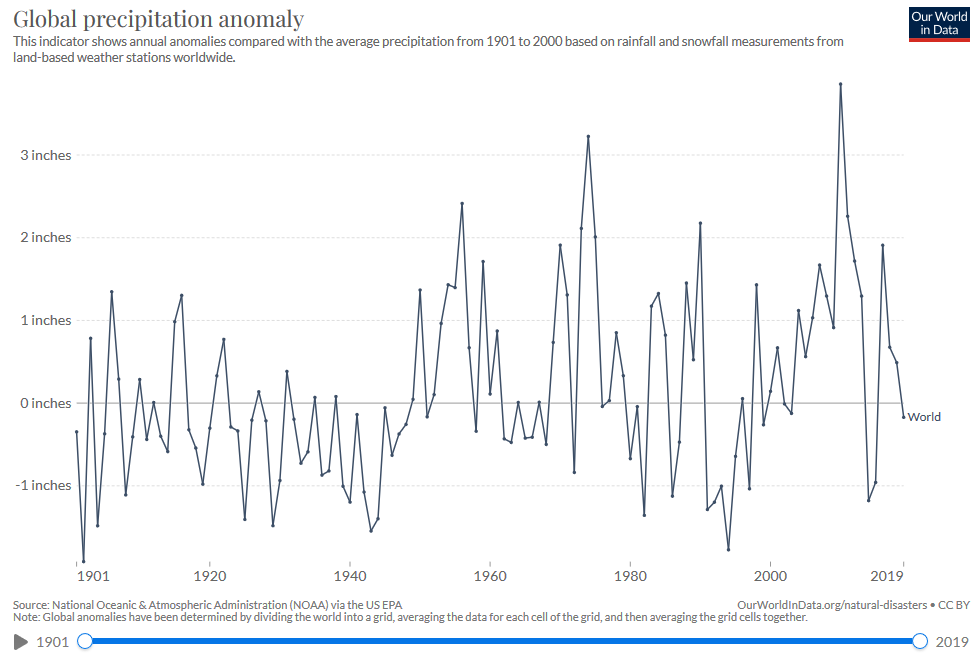
If I have not explained it before, it is obvious that with warmer oceans there is more evaporation which then results in increased precipitation. The increased precipitation does not stay entirely in the oceans because there are breezes and prevailing winds so there is more moisture over land. So for most areas it tends to be wetter but, because it is warmer, there is more evaporation. So the available amount of water may be reduced but flood control structures will be stressed. As a Nation, we are not prepared for that and Government seems to me to be lackadaisical about the problem. And of course it being wetter at the North and South poles does not help us very much in the mid-latitudes. So gross precipitation is hard to interpret until you factor in the higher levels of evaporation and the distribution pattern of the precipitation which is also changing.
Resources
https://www.ncei.noaa.gov/news/national-climate-202202
https://www.ncdc.noaa.gov/sotc/global/202202
https://ourworldindata.org/grapher/global-precipitation-anomaly?time=earliest..latest
