Written by Sig Silber
Here are the latest weather and drought forecasts for January 2022. Every month on the last day of the month NOAA updates the weather forecast for the following month – in this case, January of 2022. Also included is the summary from a recent USDA report on Irrigation by Frank Ward who is a professor at New Mexico State University.
New Forecast and comparison with the prior three-month forecast.
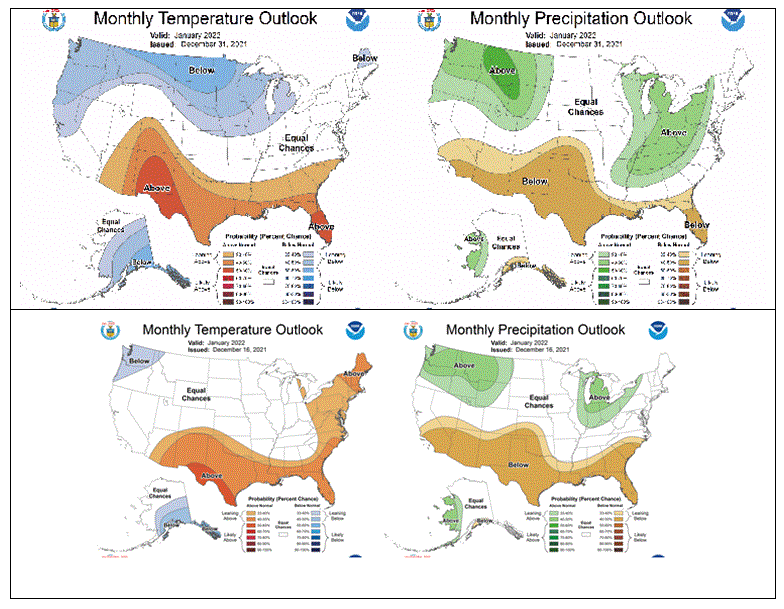
Here is the updated Weather Outlook with January shown in the first row and the prior three-month Outlook in the second row.

If the image above is not clear, it can be accessed HERE.
For Precipitation the January and three-month forecasts are almost identical. That is not the case for temperature. This raises questions as to the reliability of the three-month forecast. It is quite possible that the factors that make January different are particular to this January but it is possible that they may impact February and March as well. This is something to pay attention to when NOAA issues its next seasonal outlook on January 20, 2022. That is a long time from now so we may look for hints on this before January 20, 2022There are some changes the main one being the expansion of the Northern Tier cool anomaly. I think it had been shown in the Week 3-4 forecast soon after the Early Outlook was issued but I may not remember correctly. At any rate, it is now in the January forecast. Another change is the Northeast warm anomaly is no longer shown.
Those changes are shown in this graphic where the new forecast for January is in the first row and the prior forecast for the month is in the second row.

Drought Forecast
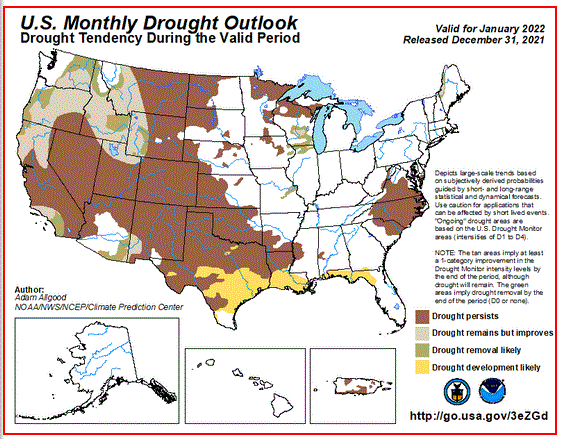
Here is the drought outlook for January:

Discussion for January 2022 30-Day Outlook
The updated temperature and precipitation outlooks for January 2022 reflect potential impacts associated with a predicted change in the PNA (Pacific-North America pattern) and lagged impacts from an active phase 8 (Western Pacific) MJO. Those two are typically associated with bouts of lower heights/cooler temperatures over much of the contiguous 48 states. Additionally, the precipitation signal associated with a positive PNA is counter to the seasonal signal from the ongoing La Nina.
The MJO signal is transient, almost by definition, while the sign of the PNA is likely to be less negative or even positive during Week-2. Many model predictions then shift the PNA back to negative through the later half of Jan 2022, resulting in a highly variable pattern. The flips in those patterns result in some increased uncertainty/lower probabilities.
The temperature outlook for Jan now indicates a broad area of below-normal temperatures favored from the Pacific Northwest to the Great Lakes and a small portion of New England. This represents a 2-class change, from the mid-December release, for portions of New England and a much cooler outlook for the Ohio Valley and mid-Atlantic, though uncertainty there is probably the highest in the domain for the temperature outlook.
Above normal temperatures remain most likely from the Southwest to the Gulf Coast and Florida. The odds for below normal temperatures were increased across much of Alaska, with the highest odds being across southeastern mainland Alaska and the Alaska Panhandle. There will be periods of variability there, but in balance, tools point toward colder than normal with a mean ridge to the west for the second half of the month.
The precipitation outlook reflects some of the more certain information in the first week. Some areas of the Lower Mississippi and Tennessee Valleys are likely to receive precipitation totaling more than the lower limit for below-normal precipitation. Thus the region where above-normal precipitation is favored has expanded as far south as Arkansas.
The early month precipitation, as well as some predicted later uncertainty, reduced the coverage of below-normal precipitation for the Southeast, in contrast to the seasonal signal typically imparted by La Nina. Additionally, portions of the Pacific Northwest and Northern Rockies are also forecast to receive continued high amounts, though that is likely to flip during Week-2. Then a negative PNA is predicted for the second half of the month, ushering in a second potential wet period.
The northern Plains are an area of uncertainty with short-term dryness, then potential wetness to end the month.
Ridging to the west of Alaska would steer storms away from the Alaska Panhandle, so despite some potential Week-2 wetness, dry conditions are likely to prevail in the net for southern mainland Alaska and the Alaska Panhandle.
Small reductions to the probabilities for below-normal precipitation were made across the Southwest and Southern California to account for the impacts of the potential negative PNA and lagged MJO impacts later in the month, though those are highly uncertain as indicated in the Week 3-4 outlooks EC.
Since the PNA was mentioned so often, Here is a good link that explains the PNA Pattern [NOAA does not say it but my interpretation is that La Nina is losing its grip and more variability is possible as the Winter unfolds.]
Irrigation Report
What Did the Study Find?
- Irrigated agriculture generates substantial value for the broader U.S. agricultural economy. In 2017, irrigated farms accounted for more than 54 percent of the total value of U.S. crop sales, while irrigated cropland constituted less than 17 percent of total harvested cropland.
- Irrigated acreage has expanded rapidly since the onset of the Federal reclamation era, which began with the passage of the Reclamation Act (P.L. 57-161) in 1902. Nationwide, irrigated acreage grew from less than 3 million acres in 1890 to more than 58 million acres in 2017.
- Between 1949 and 2017, the share of U.S. irrigated cropland located within the Mountain and Pacific regions decreased from 77 percent to 44 percent, while the share of irrigated cropland in the Mississippi Delta and Northern Plains regions increased from 8 percent to 34 percent.
- Total U.S. water withdrawals for irrigation decreased by 21 percent between 1980 and 2015, with slightly lesser declines (19 percent) in average withdrawals per acre irrigated. In 2015, irrigation accounted for approximately 64 percent of total U.S. water withdrawals, including both freshwater and treated wastewater, and excluding withdrawals for thermoelectric power.
- Since the mid–1900s, the relative predominance of surface and groundwater withdrawals for irrigation shifted. In the Pacific and Mountain regions, more than 60 percent and 72 percent, respectively, of irrigated cropland acres rely on surface water flows. However, reliance on surface water for irrigation is decreasing nationwide. Between 1950 and 2015, the share of irrigated acreage using surface water fell from 77 percent to 52 percent.
- Of crops irrigated in 2017, the largest allocation of irrigated acreage was in corn, with nearly 14 million irrigated acres harvested, or more than 25 percent of irrigated cropland harvested.
- While corn accounted for the largest acreage among irrigated crops during the 2017 growing season, these acres constitute less than 15 percent of total harvested corn acreage. Irrigation is more prevalent among other crops. In 2017, a majority of land planted in vegetables and orchards was irrigated, while 100 percent of land planted in rice was irrigated.
- Use of pressurized irrigation application systems, which are generally more water-use efficient than gravity-flow systems in most field settings, increased significantly in recent decades. Of the total U.S. cropland acres irrigated in 2018, 36 percent used gravity systems, while 67 percent used pressurized systems—including sprinklers and low-flow microsystems. Those systems account for 57 percent and 10 percent, respectively, of total irrigated acreage (approximately 3 percent of acres used some combination of gravity and pressurized systems).
- In the Pacific, Mountain, and Northern and Southern Plains regions,1 the share of irrigated acres using pressurized systems rose from 37 percent in 1984 to 72 percent in 2018—with innovations focused on improved precision of applied water, reduced pressurization requirements, and system automation.
- Improved irrigation water management practices (e.g., soil moisture sensors, weather tracking, irrigation scheduling tools, flow meters, plant condition monitoring technology, etc.) are essential in achieving maximum water-use efficiency. However, survey data of irrigated producers indicate relatively low adoption rates and potential for further expansion of these improved irrigation water management practices.
- Both surface water supply shortfalls under multi-year drought and a growing concern for groundwater depletion across major U.S. agricultural regions focus policy attention on vulnerabilities of the irrigation sector. Various Federal efforts have sought to strengthen the resilience of irrigated agriculture to water scarcity and the long-term sustainability of the sector.

One can track the updates to this forecast from the following links
https://www.wpc.ncep.noaa.gov/qpf/day1-5_new.shtml
https://www.cpc.ncep.noaa.gov/products/predictions/610day/index.php
https://www.cpc.ncep.noaa.gov/products/predictions/814day/index.php
https://www.cpc.ncep.noaa.gov/products/predictions/WK34/