NOAA Updates their Mid-Month Forecast for October 2024 on September 30, 2024 and this article was posted on October 1, 2024
At the end of every month, NOAA updates its Outlook for the following month which in this case is October of 2024. We are reporting on that tonight.
There have been some significant changes in the Outlook for October and these are addressed in the NOAA Discussion so it is well worth reading. We provided the prior Mid-Month Outlook for October for comparison. It is easy to see the substantial changes in the weather outlook by comparing the Mid-Month and Updated Maps.
The article includes the Drought Outlook for October. NOAA also adjusted the previously issued Seasonal (OND) Drought Outlook to reflect the changes in the October Drought Outlook. We also provide the Week 2/3 Tropical Outlook for the World.
The best way to understand the updated outlook for October is to view the maps and read the NOAA discussion. I have highlighted the key statements in the NOAA Discussion.
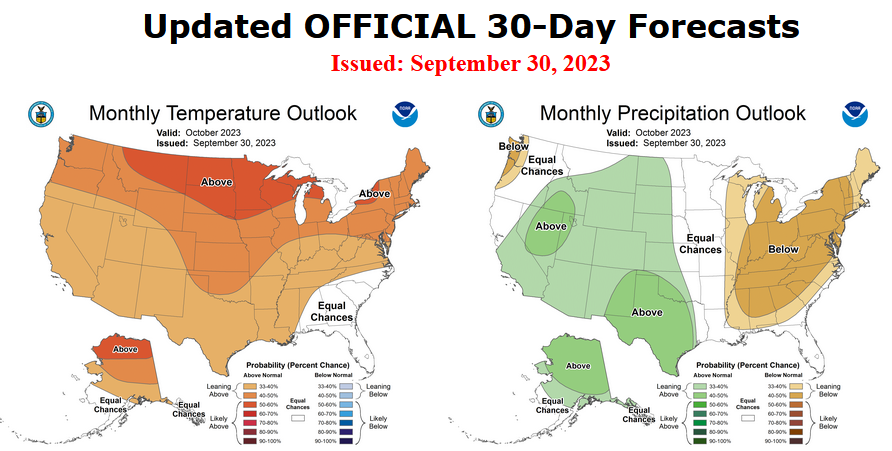
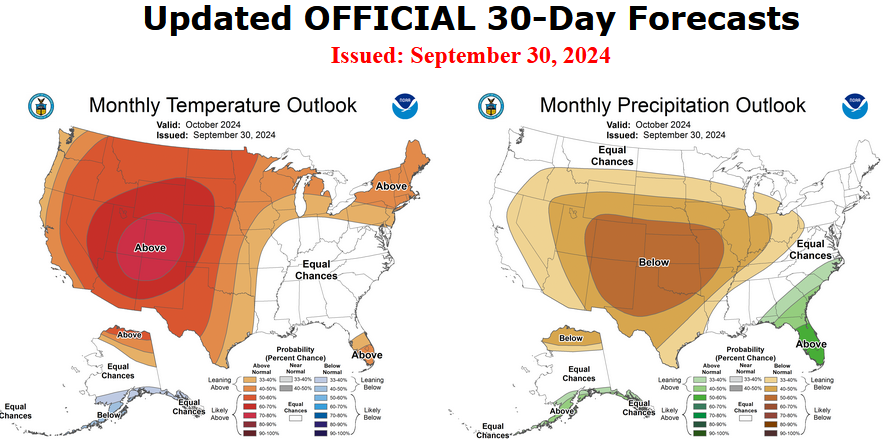
Here is the updated Outlook for October 2024.
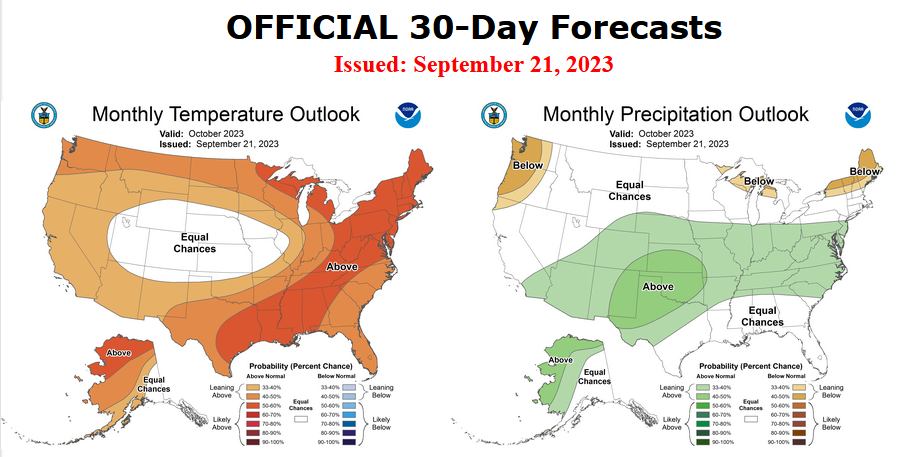
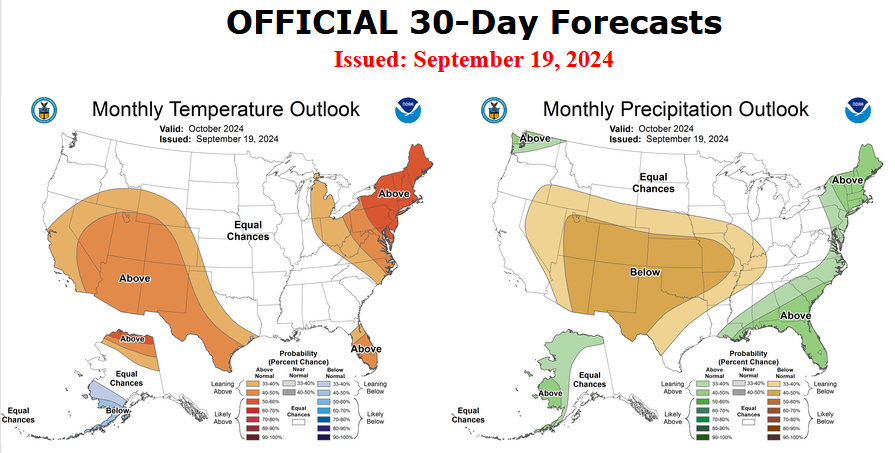
For Comparison Purposes, Here is the earlier Mid-Month Outlook for October
| It is important to remember that the maps show deviations from the current definition of normal which is the period 1991 through 2020. So this is not a forecast of the absolute value of temperature or precipitation but the change from what is defined as normal or to use the technical term climatology.
It is a substantial change from what was issued on September 19, 2024. Remember, it is the first set of maps that are the current outlook for October. One expects some changes 11 days later. However, the changes to the updated October Outlook are fairly significant. This then gives us some reason to question the (September 19, 2024) three-month OND temperature and precipitation Outlooks which are shown in the following graphic. |
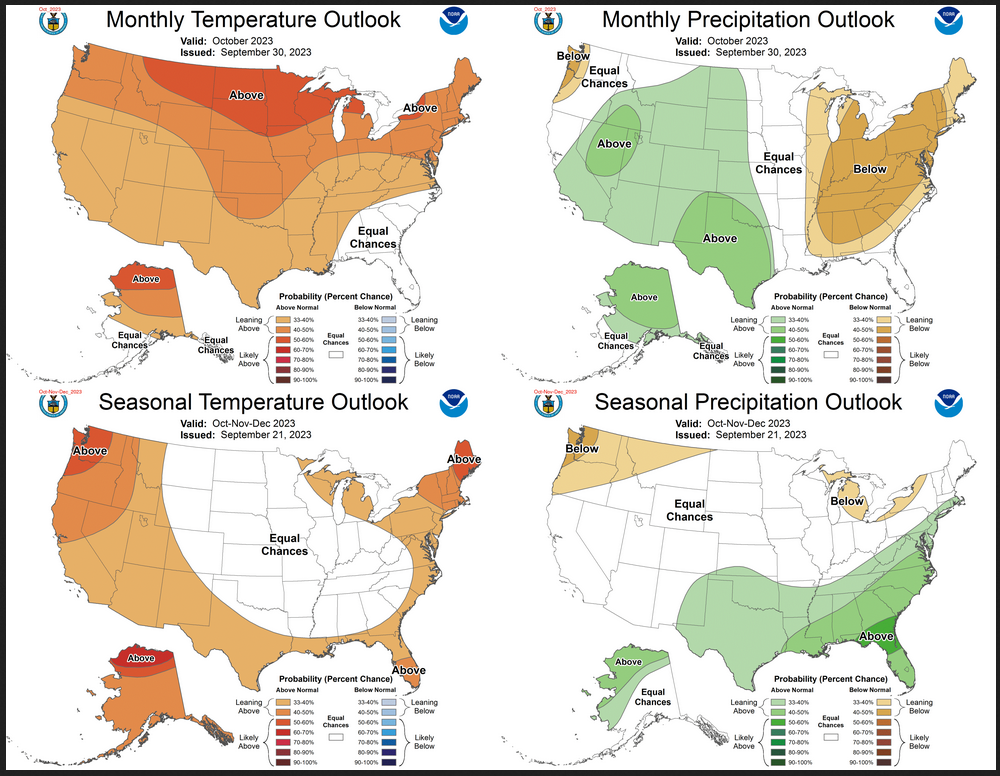
NOAA provided a combination of the Updated Outlook for October and the Three-Month Outlook.
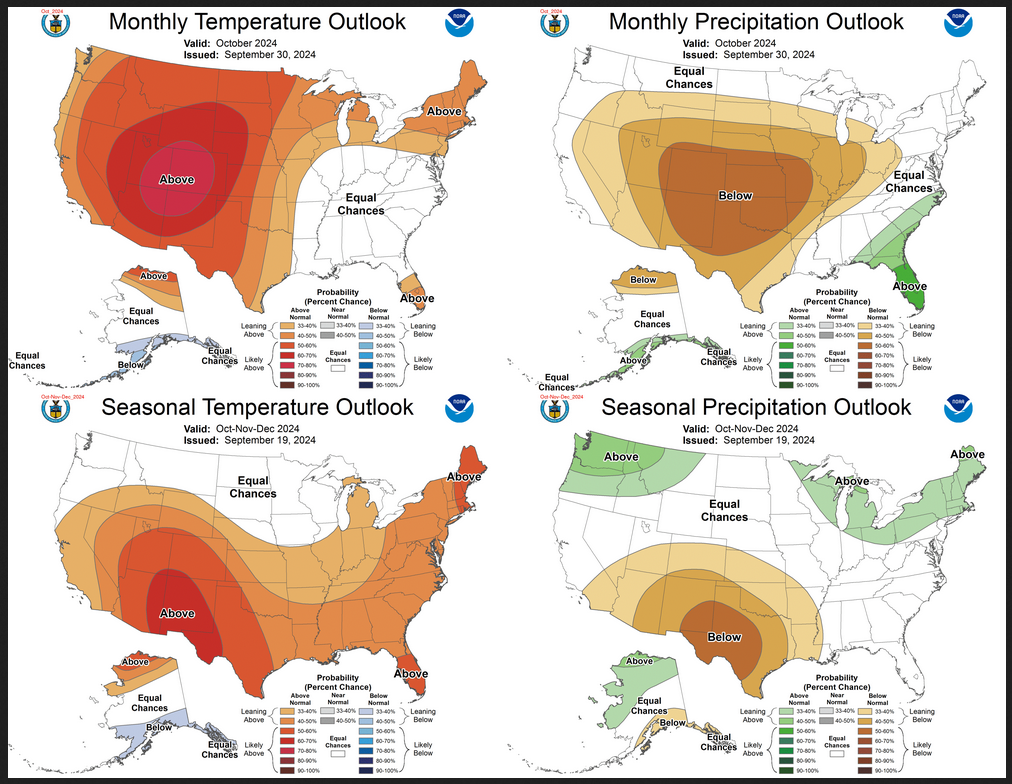
The top pair of maps are again the Updated Outlook for the new month. There is a temperature map and a precipitation map. The bottom row shows the three-month outlooks which includes August the new month. I think the outlook maps are self-explanatory.
To the extent that one can rely on a forecast, we would conclude that November and December will be very different than October. You can subtract October from the three-month Outlook and divide by two to get a combined November/December Outlook.However given the major change in the new Outlook outlook from what was issued on September 19, 2024, we might not trust the Seasonal Outlook issued on September 19, 2024. Something to think about. But the major factor is the projected slower onset of La Nina. Thus this change is consistent with the pattern the NOAA has been predicting although they have been playing catch-up. I am still not convinced that there will be a La Nina Winter. |