Looking Back at Weather for the U.S. and World in January 2024 Posted on February 20, 2024

Much of the information in this report comes from the monthly emails I receive from John Bateman. He does public outreach for NOAA and in particular NCEI. I could find the same information and more on the NCEI website but John Bateman produces a good summary so I use it or most of it. I also usually add additional information from NCEI or other NOAA websites. The full NCEI report can be accessed HERE.

Arctic air mass brought bitter cold and snow to much of the nation in mid-January
Powerful storms brought heavy rainfall and flooding to parts of the southern Plains

                                                                                           Contact
                                                                                                John Bateman, john.jones-bateman@noaa.gov, 202-424-0929

                                                                                           February 8, 2024


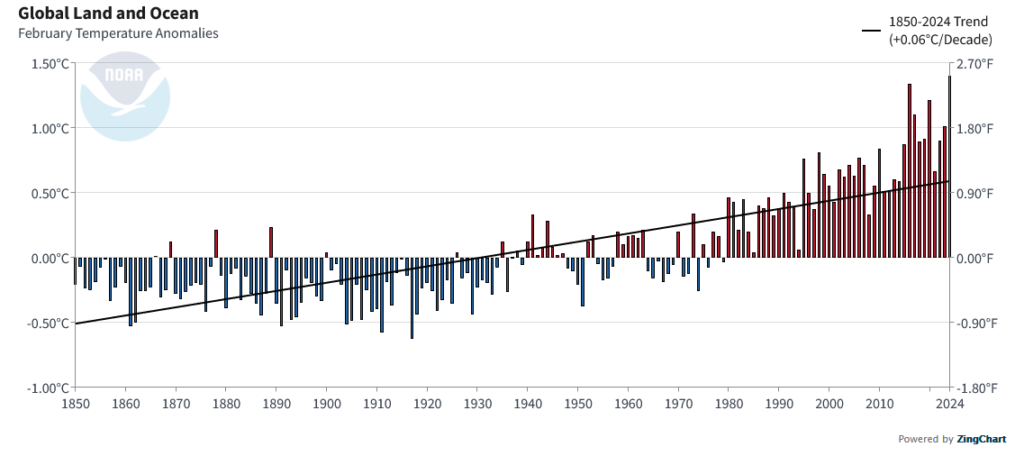
                                                                                          Earth had another record-warm month
                                                                                         It was also the second-wettest January on record Contact
                                                                                              John Bateman, john.jones-bateman@noaa.gov, 202-424-0929

                                                                                         February 14, 2024


I start with the U.S. Key Points

  • The arctic air mass from January 14–18 broke nearly 2,500 daily minimum temperatures county records from the Northwest to the Lower Mississippi Valley.

  • On January 22–25, heavy rainfall brought more than a month’s worth of rain and life-threatening flooding to parts of Texas and Louisiana.

  • January 2024 was the 10th-wettest January on record for the nation, and temperature ranked in the middle third of the historical record for the month.

And then the Global Key Points

  • Temperatures were above average over much of the globe, but the eastern United States, most of Europe and a few other areas were cooler than average.

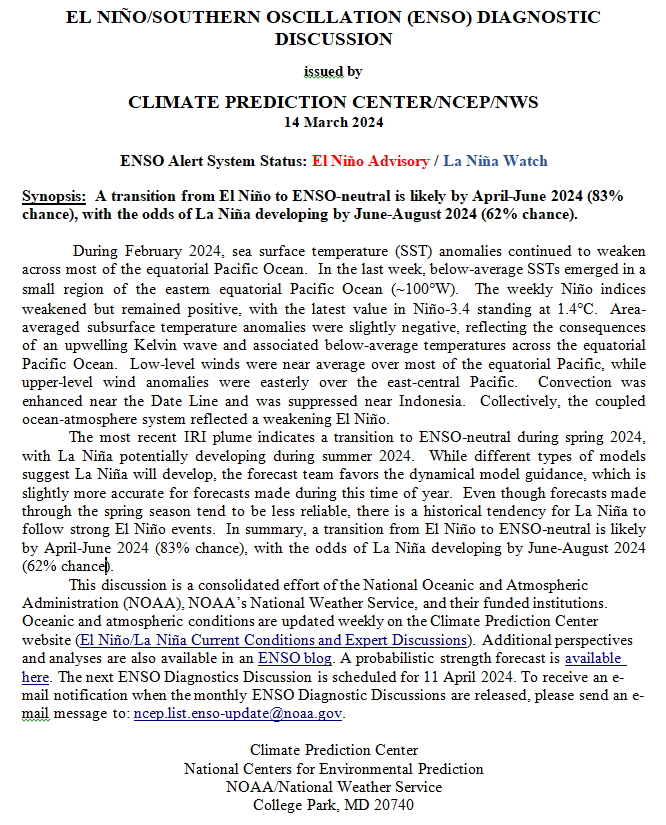
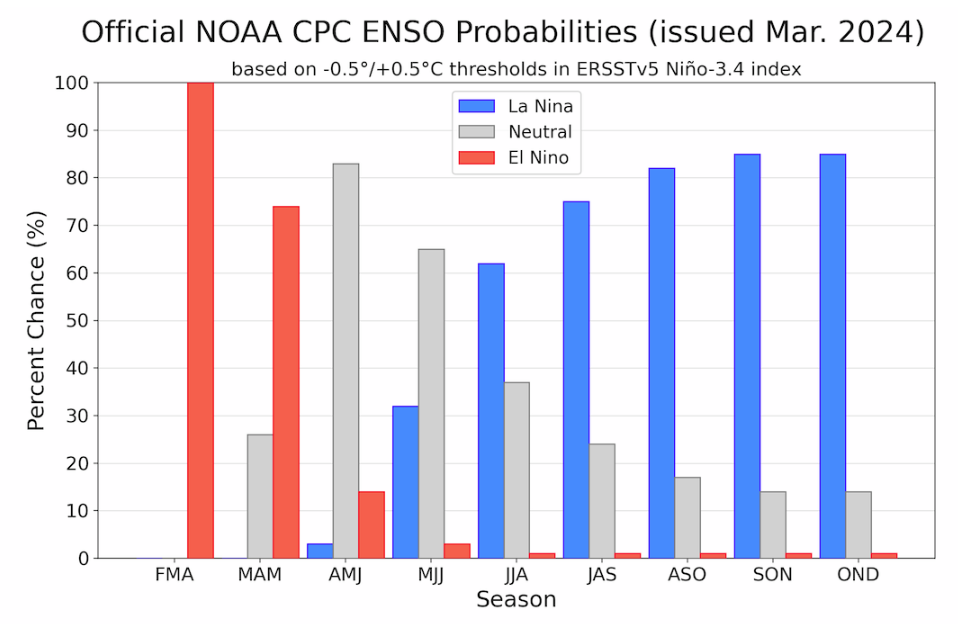
  • There is a 22% chance that 2024 will be the warmest year in NOAA’s 175-year record and a 79% chance that El Niño will transition to neutral conditions by mid-year.

  • Northern Hemisphere snow cover was near average, but Antarctic sea ice extent was fifth lowest on record for January.

  • Global precipitation was nearly record-high in January, following on the heels of a record-wet December.

I added the below to what John Bateman provided.


January 2024 was a busy month


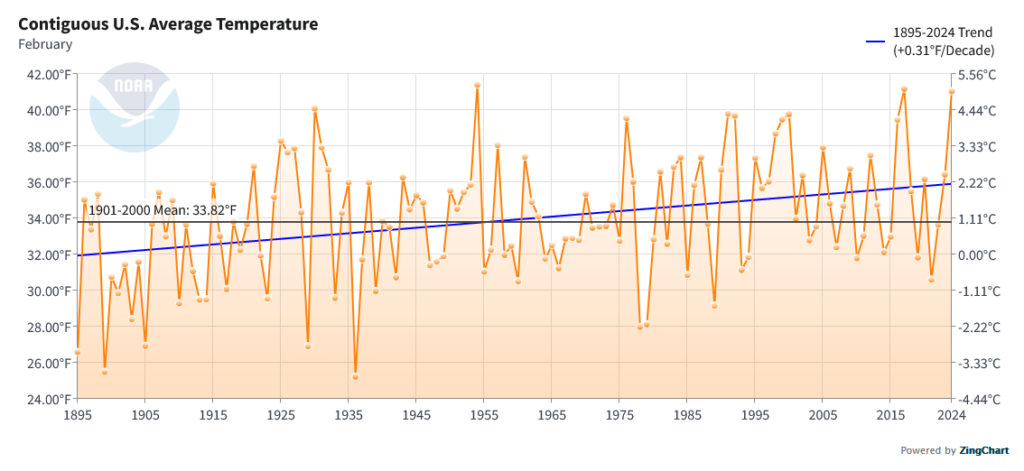
This is the temperature trend for CONUS. There was a decrease for January in 2024


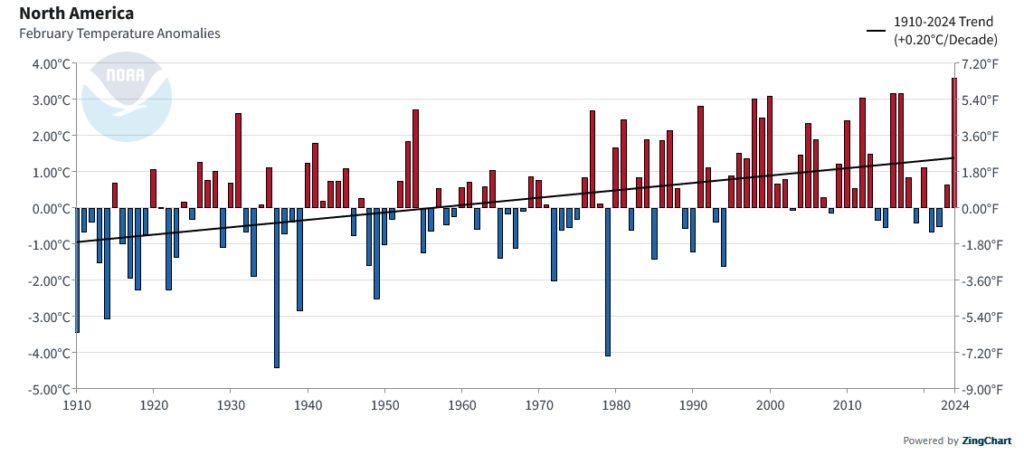
The temperature for the world, land and water hit a new record, but when looking at land alone it was not a new record.

To read the rest of this article some will have to click on “Read More”.

Today Through the Fourth Friday (22 to 28 days) Weather Outlook for the U.S. and a Six-Day Forecast for the World: posted February 20, 2024

It is difficult to find a more comprehensive Weather Outlook anywhere else with the ability to get a local 10-day Forecast also.

This article focuses on what we are paying attention to in the next 48 to 72 hours. The article also includes weather maps for longer-term U.S. outlooks and a six-day World weather outlook which can be very useful for travelers.

First the NWS Short Range Forecast. The afternoon update can be found here if I have not updated it.

Short Range Forecast Discussion
NWS Weather Prediction Center College Park MD
Tue Feb 20 2024
Valid 12Z Tue Feb 20 2024 – 12Z Thu Feb 22 2024

…Heavy rain and heavy mountain snow in California are expected to become
less intense…

…A Moderate Risk of Excessive Rainfall remains in effect along portions
of coastal southern California today…

…Warming trend expected to expand from the Great Plains into the Midwest
through midweek…

Heavy rain, snow, high winds and thunderstorm impacts will gradually
diminish across California today, as the upper trough supporting them
pushes farther inland. A quasi-stationary front will be the focus for
additional heavy rainfall over southern California today. A Moderate Risk
of Excessive Rainfall leading to Flash Flooding (level 3/4) is in effect
for portions of Los Angeles and Orange Counties where between 1-3 inches
of rain are possible. Higher totals are expected along the immediate coast
and favored terrain of the Transverse Ranges. A broader Slight Risk area
(level 2/4) is in effect from Humboldt County down to San Diego, as well
as the Sacramento Valley and adjacent upslope areas of the Sierra.
Additional accumulations of 6-12 inches of snow are expected for the
Sierra, while 1-2 feet are likely over the Shasta Siskiyous today.
Persistent troughing and upsloping will support moderate to heavy snow
over the Intermountain West where generally between 6-12 inches of snow
can be expected. This snowfall is likely to continue into Wednesday and
expand in coverage into the Central Rockies.

Elsewhere, the ongoing warming trend is expected to continue across the
Great Plains and Mississippi Valley through Wednesday before moderating a
bit and resurging once again heading into the weekend. High temperatures
will be 15-25 degrees above average today and Wednesday over the Great
Plains and Mississippi Valley while mild air shift slowly into the Midwest
and East Coast. The Florida Peninsula will remain below average
temperature-wise due to a deepening upper trough in the western Atlantic.
A developing low pressure system will bring showers and thunderstorms to
the Midwest on Thursday.

To get your local forecast plus active alerts and warnings click HERE and enter your city, state or zip code.

Above is a 72 hour animation of the forecast. Learn about wave patterns HERE.

Then, looking at the world and of course, the U.S. shows here also. Today we are looking at precipitation.

Please click on “Read More” below to access the full report issued today.

Today Through the Fourth Friday (22 to 28 days) Weather Outlook for the U.S. and a Six-Day Forecast for the World: posted February 19, 2024

It is difficult to find a more comprehensive Weather Outlook anywhere else with the ability to get a local 10-day Forecast also.

This article focuses on what we are paying attention to in the next 48 to 72 hours. The article also includes weather maps for longer-term U.S. outlooks and a six-day World weather outlook which can be very useful for travelers.

First the NWS Short Range Forecast. The afternoon update can be found here if I have not updated it.

Short Range Forecast Discussion
NWS Weather Prediction Center College Park MD
251 AM EST Mon Feb 19 2024

Valid 12Z Mon Feb 19 2024 – 12Z Wed Feb 21 2024

…There’s a Moderate risk of excessive rainfall along coastal southern
California today…

…Heavy Snow likely over Sierra Nevada and Shasta Siskiyous in
California…

…Warming trend expected to expand across the Great Plains through
midweek…

A potent upper-level low will continue directing subtropical moisture over
much of California today. Heavy coastal and low elevation rain,
thunderstorms, heavy mountain snow and high winds are all expected from
this Atmospheric River event. Excessive Rainfall leading to Flash Flooding
is possible for much of the state today. A Slight Risk of Excessive
Rainfall (level 2/4) is in effect from Humboldt to Orange County as well
as over parts of the Sacramento Valley and along upslope portions of the
Sierra. A Slight Risk of Severe Thunderstorms is in effect for parts of
the Sacramento Valley where an isolated tornado will be possible. A
targeted Moderate Risk of Excessive Rainfall is in effect for Santa
Barbara and Ventura where heavy rainfall will focus, especially over
elevated terrain. Heavy Snow will blanket the Sierra Nevada and Shasta
Siskiyous today as well, with those mountains forecast to receive 1-3 feet
(isolated higher) of snow by Tuesday morning.

The moisture feed into California will weaken considerably and sag south
on Tuesday, but the threat of Flash Flooding will persist across southern
California, in particular. Upslope flow into the Transverse ranges will
support a renewed threat of Flash Flooding. A Slight Risk of Excessive
Rainfall is in effect from Humboldt down through San Diego County on
Tuesday mainly due to sensitive soils from today’s heavy rain. Up to a
foot of additional snow accumulations with locally higher amounts are
possible over the Sierra and Shasta Siskiyous on Tuesday. Damaging wind
gusts should continue into Wednesday morning before gradually weakening.

Elsewhere, lake effect snow will come to an end this afternoon across the
Lower Great Lakes. Upper level ridging with embedded shortwave energy will
support a warming trend acrosss the Great Plains and Mississippi Valley
through midweek when anomalous temperatures are expected to reach their
peak for the week. High temperatures will be between 15-25 degrees above
average by Wednesday over much of the central U.S..

To get your local forecast plus active alerts and warnings click HERE and enter your city, state or zip code.

Above is a 72 hour animation of the forecast. Learn about wave patterns HERE.

Then, looking at the world and of course, the U.S. shows here also. Today we are looking at precipitation.

Please click on “Read More” below to access the full report issued today.

Today Through the Fourth Friday (22 to 28 days) Weather Outlook for the U.S. and a Six-Day Forecast for the World: posted February 18, 2024

It is difficult to find a more comprehensive Weather Outlook anywhere else with the ability to get a local 10-day Forecast also.

This article focuses on what we are paying attention to in the next 48 to 72 hours. The article also includes weather maps for longer-term U.S. outlooks and a six-day World weather outlook which can be very useful for travelers.

First the NWS Short Range Forecast. The afternoon update can be found here if I have not updated it.

Short Range Forecast Discussion
NWS Weather Prediction Center College Park MD
Sun Feb 18 2024
Valid 12Z Sun Feb 18 2024 – 12Z Tue Feb 20 2024

…There’s a Moderate Risk of Excessive Rainfall leading to Flash Flooding
over portions of Southern California…

…Heavy Snow likely over Sierra Nevada and Shasta Siskiyous…

…Warming trend continues across Central U.S. through midweek…

A closed upper-level low will direct a plume of subtropical moisture into
California over the next few days. A low pressure system at the surface
will focus the moisture along its attendant surface fronts as it makes
it’s way into the state. Heavy Rainfall is expected for the coastal areas
as well as much of the inland valleys of northern/central California and
into the windward foothills of the Sierra beginning this evening. Some
instability will work it’s way into portions of southern California
tonight and continue into Monday morning, which will lead to the chance
for thunderstorms and increased rain rates. Thus, a Moderate Risk of
Excessive Rainfall leading to Flash Flooding (level 3/4) is in effect for
portions of Santa Barbara County tonight and expanding into Ventura on
Monday as the heavy rain drifts southward along a cold front. Slight Risks
(level 2/4) are in effect for Humboldt down to Ventura today and then
expanding down to Orange through Tuesday.

Meanwhile, heavy snow will develop over the Sierra and Shasta Siskiyous
tonight. This snowfall is expected to continue into Tuesday when the
Pacific moisture feed is likely to end. Between 2-4 feet of snow are
forecast for the Sierra and Shasta by Tuesday morning with locally higher
amounts possible. Elsewhere, a stalled out surface front will focus
showers and thunderstorms across the Florida Peninsula today. A stripe of
1-2 inches of rain is probable across central/southern portions of the
peninsula. Lake effect snow showers continue downwind of the Great Lakes
through Sunday night. An upper ridge with embedded shortwave energy will
support a warming trend across the Great Plains, Mississippi Valley and
Midwest over the next several days.

To get your local forecast plus active alerts and warnings click HERE and enter your city, state or zip code.

Above is a 72 hour animation of the forecast. Learn about wave patterns HERE.

Then, looking at the world and of course, the U.S. shows here also. Today we are looking at precipitation.

Please click on “Read More” below to access the full report issued today.

Our Report on the JAMSTEC Three-Season Forecast – Posted on February 17, 2024

The Japan Agency for Marine-Earth Science and Technology, or JAMSTEC, is a Japanese national research institute for marine-earth science and technology

From the JAMSTEC Discussion:

“The recent observation suggests that the El Niño started to decay. The SINTEX-F ensemble mean predicts that the El Niño will decay and an El Niño Modoki will develop and persist at least until the next boreal spring. The model also predicts that a La Niña Modoki will occur in the boreal summer. However, there is a large uncertainty in the predicted amplitude.”

Although it is a World forecast, it includes a forecast for North America since North America is part of the World. One might try to compare it to the NOAA Outlook we published yesterday which can be accessed HERE.

First, we take a look at the forecasted sea surface temperature anomalies (SSTA). JAMSTEC starts by forecasting the SSTA and Nino 3.4 Index on the first day of the month and from there it usually takes their models about two weeks to produce their seasonal forecast. I received it from JAMSTEC on February 15 the same day as NOAA issued their Seasonal Update this month.  The JAMSTEC model runs are based on conditions as of February 1, 2024. The NOAA Seasonal Outlook is based on conditions closer to the time when it is issued.

We have a full three-season forecast from JAMSTEC this month. We also have single-month forecasts for March, April and May 2024.

Let’s take a look.

This shows their forecast of sea surface temperature anomalies at three points in time. Red is warm and is associated with El Nino if it occurs in the Nino 3.4 measurement areas.  You can see the El Nino tongue of warm water extending from Peru to the west in the MAM image but look at that blob of warm water to the west i.e. by this point in time this has Modoki characteristics which impact the Walker circulation. JJA and SON show ENSO Neutral or La Nina.

JAMSTEC (and also NOAA) are showing very warm oceans in many parts of the world.  I have written about that before. It raises questions about the reliability of our current approach to thinking about the ENSO Cycle. This is covered in another article that can be accessed HERE. But JAMSTEC is showing a relatively normal ocean off the coast of much of the U.S. which probably explains their strange forecast.

JAMSTEC uses the same definition of Normal (climatology) as NOAA. JAMSTEC does a better job at characterizing La Ninas and El Ninos than NOAA. JAMSTEC provides me with a lot of other information that I do not include in my articles to keep them to a manageable size for readers.

JAMSTEC has been having some computational issues with its model. From the email I received from them: “Because of changes to the library in our computer, this time we could not complete all members”. Two months ago they were not able to publish at all. I do not know how to assess their message to me. In November they upgraded their model from 12 members to 36. Their goal is to go to 108. On the website, the images indicate that all members were included. It is not possible to accurately estimate the current conditions. So the technique in ensemble models is to perturb the assumptions slightly for multiple model runs (or use different physics models for some runs) and take the average (mean) of the solutions. Each solution is called a member of the group of solutions for which the mean was taken.  I am intrigued by the coincidence of this “change to the library in our computer” with their publication of this article. Based on the Japanese Culture they would not have released this forecast if they did not have confidence in it.

Some Readers will have to click on “Read More” to read the rest of the article which you need to read to see the forecasts. I can only include a certain amount of material in the lede.

Today Through the Fourth Friday (22 to 28 days) Weather Outlook for the U.S. and a Six-Day Forecast for the World: posted February 17, 2024

It is difficult to find a more comprehensive Weather Outlook anywhere else with the ability to get a local 10-day Forecast also.

This article focuses on what we are paying attention to in the next 48 to 72 hours. The article also includes weather maps for longer-term U.S. outlooks and a six-day World weather outlook which can be very useful for travelers.

First the highlights from the NWS.

Short Range Forecast Discussion
NWS Weather Prediction Center College Park MD
Sat Feb 17 2024
Valid 12Z Sat Feb 17 2024 – 12Z Mon Feb 19 2024

…Heavy to Excessive Rainfall leading to Flash Flooding possible across
much of coastal California…

…Heavy Rainfall likely over much of the Florida Peninsula this weekend…

…Warming trend ensues across midsection of the country…

To get your local forecast plus active alerts and warnings click HERE and enter your city, state or zip code.

Above is a 72 hour animation of the forecast.

Then, looking at the world and of course, the U.S. shows here also. Today we are looking at precipitation.

Please click on “Read More” below to access the full report issued today.

NOAA Updates its Seasonal Outlook on February 15, 2024 – MJO, Neg AO, Possible SSW Make the March Outlook Quite Interesting

On the third Thursday of the month right on schedule NOAA issued their updated Seasonal Outlook which I describe as their Four-Season Outlook because it extends a bit more than one year into the future. The information released also included the Mid-Month Outlook for the following month plus the weather and drought outlook for the next three months.  I present the information issued by NOAA and try to add context to it. It is quite a challenge for NOAA to address the subsequent month, the subsequent three-month period as well as the twelve successive three-month periods for a year or a bit more.

With respect to the long-term part of the Outlook which I call the Four-Season Outlook, there is a fairly rapid transition from El Nino to ENSO Neutral to LaNina. So getting the timing right is very challenging.

First, Let’s Take a Look at the (mid-month) Outlook for March.

It will be updated on the last day of February

The top row is what is now called the Mid-Month Outlook for next month which will be updated at the end of this month. There is a temperature map and a precipitation map. The second row is a three-month outlook that includes next month.  I think the outlook maps are self-explanatory. What is important to remember is that they show deviations from the current definition of normal which is the period 1991 through 2020.  So this is not a forecast of the absolute value of temperature or precipitation but the change from what is defined as normal or to use the technical term “climatology”.

Notice that the Outlook for next month and the three-month Outlook are somewhat different.  This tells us that April and May will be different than March to some extent.

The full NOAA Seasonal Outlook extends through March/April/May of 2025. All of these maps are in the body of the article. Large maps are provided for March and the three-month period Mar/Apr/May.  Small maps are provided beyond that through May of 2025 with a link to get larger versions of these maps.

NOAA provides an excellent discussion to support the maps. It is included in the body of this article. In some cases, one will need to click on “read more” to read the full article.  For those on my email list where I have sent the url of the article, that will not be necessary.

Today Through the Fourth Friday (22 to 28 days) Weather Outlook for the U.S. and a Six-Day Forecast for the World: posted February 16, 2024

It is difficult to find a more comprehensive Weather Outlook anywhere else with the ability to get a local 10-day Forecast also.

This article focuses on what we are paying attention to in the next 48 to 72 hours. The article also includes weather maps for longer-term U.S. outlooks and a six-day World weather outlook which can be very useful for travelers.

First the highlights from the NWS.

Short Range Forecast Discussion
NWS Weather Prediction Center College Park MD
Fri Feb 16 2024
Valid 12Z Fri Feb 16 2024 – 12Z Sun Feb 18 2024

…Swath of accumulating snow will spread from Midwest today to Mid
Atlantic tonight…

…Heavy Rain and mountain snow to impact California this weekend…

…Chilly air sweeps across much of the central and southern parts of the
country this weekend..

To get your local forecast plus active alerts and warnings click HERE and enter your city, state or zip code.

Above is a 72 hour animation of the forecast.

Then, looking at the world and of course, the U.S. shows here also. Today we are looking at precipitation.

Please click on “Read More” below to access the full report issued today.

Today Through the Fourth Friday (22 to 28 days) Weather Outlook for the U.S. and a Six-Day Forecast for the World: posted February 15, 2024

It is difficult to find a more comprehensive Weather Outlook anywhere else with the ability to get a local 10-day Forecast also.

This article focuses on what we are paying attention to in the next 48 to 72 hours. The article also includes weather maps for longer-term U.S. outlooks and a six-day World weather outlook which can be very useful for travelers.

First the highlights from the NWS.

Short Range Forecast Discussion
NWS Weather Prediction Center College Park MD
Thu Feb 15 2024
Valid 12Z Thu Feb 15 2024 – 12Z Sat Feb 17 2024

…A Pacific storm system pushing into the West Coast will bring locally
heavy rain near the coast, and heavy high elevation snowfall into the
Intermountain West over the next couple of days…

…Quick-hitting storm system to produce accumulating snowfall across the
Great Lakes today and into the Interior Northeast Thursday night and
Friday morning…

…Next round of snow expected to quickly spread from the central Plains
and Ohio Valley on Friday, then into the Central Appalachians and
Mid-Atlantic Friday night into Saturday morning…

To get your local forecast plus active alerts and warnings click HERE and enter your city, state or zip code.

Above is a 72 hour animation of the forecast.

Then, looking at the world and of course, the U.S. shows here also. Today we are looking at precipitation.

Please click on “Read More” below to access the full report issued today.

Two Unsolved Saint Valentine’s Day Massacres – February 14, 2024

What do the two massacres that occurred on Saint Valentine’s Day have in common and how do they differ?

We start with the one which took place in Chicago Illinois and which is the most famous.

https://upload.wikimedia.org/wikipedia/commons/2/24/Al_Capone-around_1935.jpg

Credit

I can’t show you the photos since they are so valuable that they remain under copywrite protection due to a series of laws that have extended the copywrite provisions (wouldn’t you know how that works LOL) but you may be able to see great photos HERE or  HERE.   I have exceeded my limit of free reads.

HERE is a very good resource that has photos.
From Simple English Wikipedia, the free encyclopedia LINK  tells the story pretty well.

Al Capone was the most powerful bootlegger in Chicago. By 1929 he had eliminated several of his rival crime bosses.[2] The last one on his “list” was Bugs Moran. Capone was trying to appear as if he was retired to Florida.[3] So Capone didn’t want to be seen as starting another gang war.[3] Instead, Capone gave the order to one of his associates, Jack McGurn, to eliminate Bugs Moran.[2]

Massacre

On the morning of 14 February, McGurn lured Moran and his men to a warehouse on Clark street. The bait was a stolen truckload of whisky they could buy cheap.[4] Seven of Moran’s men were there to inspect the load. A police car pulled up outside the building and several of Capone’s men dressed in Chicago police uniforms went in and pretended to arrest Moran’s men.[4] When they were lined up against a wall the killers pulled out Thompson submachine guns and opened fire. Six of the seven men were killed.[5] Moran himself was just arriving when he saw the police car and escaped.[4]

At this time murder was not a federal offense.[6] Most of the killers McGurn hired were from out of town. Police departments from different cities rarely could work together to solve crimes at that time. So the killers knew if they simply left Chicago after the massacre nobody could touch them.[6]

Results

Newspapers ran stories of the gangster shootings and prohibition lawlessness in Chicago.[7] These were complete with detailed photographs of the murders. At first many thought the Chicago police had committed the massacre.[b] But most people in Chicago thought Al Capone was behind the murders.[7] Capone had an alibi. He was at his winter home in Palm Beach, Florida when the murders took place. The suspicions finally resulted in the arrests of Vincenzio Damora and John Scalise. These were two of Capone’s known henchmen. Scalise was charged with the murders after Damora came up with an alibi. But Capone murdered Scalise himself before he could stand trial.[7] Public opinion also put pressure on the FBI to arrest Capone with any charge they could. In 1931 they finally charged him with tax evasion and sent him to prison.[9] Capone was sent to Alcatraz for eleven years. When he was finally released he was too sick to continue his crime career. He died in 1947.[9] Prohibition was repealed in 1933 which almost stopped bootlegging.[7]

The struggle by the FBI to come to grips with what happened is documented HERE and HERE. Let’s just say that the FBI had a great deal of difficulty with this case and the direct participants were not brought to justice but the possible leader Al Capone showed above was never charged let alone convicted of this crime. He had created a perfect alibi.  But the FBI got him for tax evasion.
 Why am I telling you this story today?  Certainly, it is appropriate to discuss what happened on  Saint Valentine’s Day in the past and this day has a lot of history including in the distant past a celebration of Christian Martyrs and later a celebration of love due to a poem by Chaucer.

But today I am using this occasion to remember the Mob Killing in Chicago and another Massacre or near Massacre in the state where I live which is New Mexico. More importantly, the chances of what happened here in New Mexico happening again seem to me to be substantial. Accidents can happen at LANL, the WIPP facility southeast of Carlsbad Caverns in New Mexico or somewhere along the route from Los Alamos National Labs (LANL) to WIPP (Waste Isolation Pilot Plant – which appears to be planned now as the sole storage facility in the U.S) or somewhere on the route from LANL to Savannah and Savannah back to WIPP which is a long trip with many opportunities for the radioactive materials being conveyed to have an accident or be stolen by saboteurs.

It is a complicated topic but today we will mostly talk about the accident on February 14, 2014 at the WIPP facility southeast of Carlsbad Caverns National Park. You can learn more about WIPP HERE.

Let us now talk about this other Saint Valentine’s Day massacre or an accident that was almost a massacre (we do not really know the full impact on those involved) and one that likely will be repeated. Most of these images were provided to me by Cynthia Weehler.  They are based on U.S. Government Documents so they should be considered accurate.


What happened? From Wikipedia  (LINK)

Incidents at the WIPP

On February 14, 2014, radioactive materials leaked from a damaged storage drum. Analysis of accidents at the WIPP, by DOE, have shown lack of a “safety culture” at the facility.[19]

On February 5, 2014 at around 11:00 a.m., a salt haul truck caught fire, prompting an evacuation of the underground facility.[20] Six workers were taken to a local hospital with smoke inhalation and were released by the next day. Lab tests after the fire confirmed that there was zero release of radiological material during, or as a result of, the fire.[21] Underground air-monitoring equipment was out of commission after the truck fire.[22]

On February 15, 2014, authorities ordered workers to shelter in place at the facility after air monitors had detected unusually high radiation levels at 11:30 p.m. the previous day. None of the facility’s 139 workers were underground at the time of the incident.[23][24] Later, trace amounts of airborne radiation consisting of americium and plutonium particles were discovered above ground, 0.5 mi (0.80 km) from the facility.[23] In total, 22 workers were exposed to radioactive contaminants equaling that of a standard chest x-ray.[25] The Carlsbad Current-Argus wrote: “the radiation leak occurred on the evening of February 14, according to new information made public at a news conference [on February 20]. Joe Franco, manager of the DOE Carlsbad Field Office, said an underground air monitor detected high levels of alpha and beta radiation activity consistent [sic] the waste buried at WIPP.”[26] Regarding the elevated levels of plutonium and americium detected outside the nuclear waste repository, Ryan Flynn, New Mexico Environment Secretary stated during a news conference: “Events like this simply should never occur. From the state’s perspective, one event is far too many.”[27]

On February 26, 2014, the DOE announced that 13 WIPP above-ground workers had tested positive for exposure to radioactive material. Other employees were in the process of being tested. On Thursday, February 27, DOE announced that it sent out “a letter to tell people in two counties what they do know so far. Officials said it is too early to know what that means for the workers’ health.”[28] Additional testing would be done on employees who were working at the site the day after the leak. Above ground, 182 employees continued to work. A February 27 update included comments on plans to discover what occurred below ground first by using unmanned probes and then people.[29][30]

The Southwest Research and Information Center released a report on April 15, 2014[31] that one or more of 258 contact-handled radioactive waste containers located in room 7, panel 7 of the underground repository released radioactive and toxic chemicals.[32] The location of the leak was estimated to be approximately 1,500 feet (460 m) from the air monitor that triggered the contaminants in the filtration system. The contaminants were spread through more than 3,000 feet (910 m) of tunnels, leading to the 2,150-foot (660 m) exhaust shaft into the surrounding above-ground environment. Air-monitoring station #107, located 0.5 miles (0.8 km) away, detected the radiotoxins. The filter from station #107 was analyzed by the Carlsbad Environmental Monitoring and Research Center (CEMRC) and found to contain 0.64 becquerels (Bq) per cubic meter of air of americium-241 and 0.014 Bq of plutonium-239 and plutonium-240 per cubic meter of air (equivalent to 0.64 and 0.014 radioactive decay events per second per cubic meter of air).[33] The DOE agreed that there was a release of radioactivity from the repository and confirmed that “The event took place starting at 14 February 2014 at 23:14 and continued to 15 February 2014 14:45.”[34] The DOE also confirmed that “A large shift in wind direction can be seen to occur around 8:30 AM on 2/15/14.”[35][36] The EPA reported on the radiological release on their WIPP News page.[37]

After analysis by CEMRC, the station A filter was found on February 15, 2014 to be contaminated with 4,335.71 Bq of Am-241 per every 35 cubic feet (1 m3), and 671.61 Bq of plutonium-239 and plutonium-240 per every 35 cubic feet (1 m3).[38] Bob Alvarez, former DOE official, stated that the long-term ramifications of the WIPP issue are grounded in the fact that the DOE has 66,000 m3 (2,300,000 cu ft) of transuranic waste that has not been disposed of due to the fact that there are no long-term disposition plans for transuranic waste, including 5 tons of plutonium that are in-situ at the Savannah River Site, as well as water from the Hanford Nuclear Reservation in Washington State.[39] In an article in the Bulletin of the Atomic Scientists, Alvarez wrote that “Wastes containing plutonium blew through the WIPP ventilation system, traveling 2,150 feet to the surface, contaminating at least 17 workers, and spreading small amounts of radioactive material into the environment.”[40] The URS Corporation, who oversees WIPP, removed and demoted the contracted manager of the repository. Alvarez ponders the notion of “contract handling” of radioactive waste because it deploys conventional processing practices that do not take into consideration the tens of thousands of containers buried before 1970 at several Department of Energy sites. Alvarez states that the quantity of this pre-1970 plutonium waste is 1,300 times more than the amount permitted to “leak” into the environment at WIPP; however, much of this waste is simply buried a few feet underground at DOE sites.[41]

The source of contamination was later found to be a barrel that exploded on February 14 because contractors at Los Alamos National Laboratory packed it with organic cat litter instead of clay cat litter. Other barrels with the same problem were then sealed in larger containers.[42] Anthropologist Vincent Ialenti has examined the political, social, and financial triggers to this organic kitty litter error in detail, linking it to the accelerated pace of the Department of Energy’s and State of New Mexico’s 3706 nuclear waste cleanup campaign, which ran from 2011 to 2014. Ialenti’s study was published in The Bulletin of the Atomic Scientists in July 2018.[43]

The 2014 incidents raised the question of whether or not WIPP would be a safe replacement for the Yucca Mountain nuclear waste repository in Nevada, as a destination for all waste generated at U.S. commercial nuclear power plants.[5] The cost of the 2014 accident was expected to exceed $2 billion and disrupted other programs in various nuclear industry sites.[44] On January 9, 2017, the plant was formally reopened after three years of cleanup costing $500 million, which is significantly less than forecasted.[45] On April 10, the plant received its first shipment of waste since reopening.46]

Readers who found this article on the EconCurrents.com website may have to click “Read More” to read the rest of the article.  Please do that as this is very important. If you have received a link to the article it will not be necessary to click “Read More”.