NOAA Updates its Seasonal Outlook on November 21, 2024 – Still based on a weak La Nina starting very soon – Posted on November 22, 2024
On the third Thursday of the month right on schedule NOAA issued their updated Seasonal Outlook which I describe as their Four-Season Outlook because it extends a bit more than one year into the future. The information released also included the Mid-Month Outlook for the following month plus the weather and drought outlook for the next three months. I present the information issued by NOAA and try to add context to it. It is quite a challenge for NOAA to address the subsequent month, the subsequent three-month period as well as the twelve successive three-month periods for a year or a bit more.
With respect to the long-term part of the Outlook which I call the Four-Season Outlook, the timing of the transition from Neutral to LaNina has been challenging to predict. We are still in ENSO Neutral. La Nina is the likely scenario soon, but the strength of the La Nina may be fairly weak.
From the NOAA discussion:
“Taken collectively, statistical and dynamical model forecast guidance of the Niño3.4 index favor the development of a weak and most likely short duration La Niña event. Some statistical model forecasts do favor a continuation of ENSO-neutral into and through winter 2024-2025. Dynamical model guidance predictions tend to support weak La Niña conditions to develop, including the majority of participant models from the NMME and C3S forecast suites. Most recent observations and the forecast guidance noted above favor La Niña to emerge during OND 2024 (57% chance) and it is expected to persist through JFM 2025. After JFM 2025, ENSO-neutral is the most likely category into the northern hemisphere summer of 2025.”
“Based on a weak La Nina and models overdoing trends, observed trends become more of the signal. Furthermore, higher frequency patterns (AO, MJO, and stratospheric variability) that result in increased uncertainty can also play a larger role. Those modes are largely not predictable on seasonal timescales,”
I personally would not have total confidence in this outlook given the uncertainty about there actually being a La Nina and its strength if it does happen. I forecasted the JAMSTEC three-season forecast last Saturday LINK. I do not have a lot of confidence that NOAA knows how to deal with a La Nina Modoki. The number of El Nino and La Nina events since 1950 is a fairly small number. When you further segment them by strength you end up with a very small number of events in each category (El Nino v La Nina and three or four categories of strength within each of perhaps 8 to 10 subcategories. This makes both statistical methods and dynamical models have a large error range. We are pretty confident now that we will have either a weak La Nina or Neutral with a La Nina bias meaning it will be in the Neutral Range but closer to a La Nina than an El Nino. This suggests that there is value in this forecast. The maps show the level of confidence that NOAA (really the NOAA Climate Prediction Center) has for the outlook shown when they show a part of the U.S. or Alaska differing from normal.
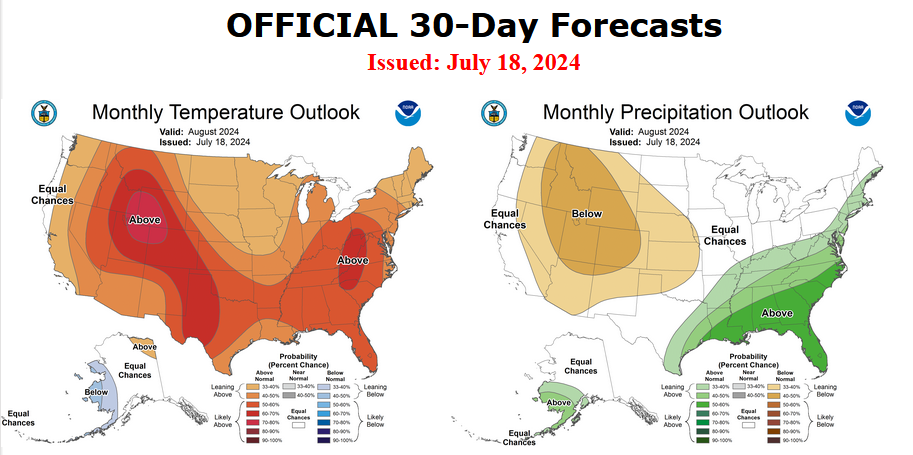
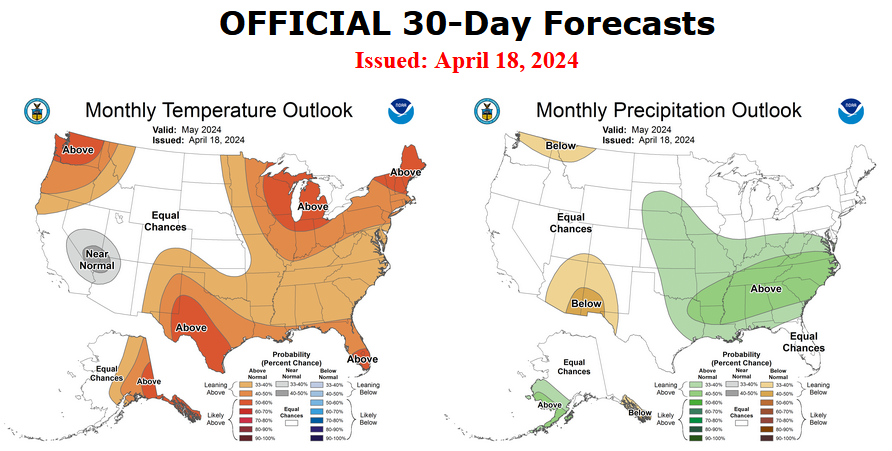
Let’s Take a Look at the (mid-month) Outlook for December.
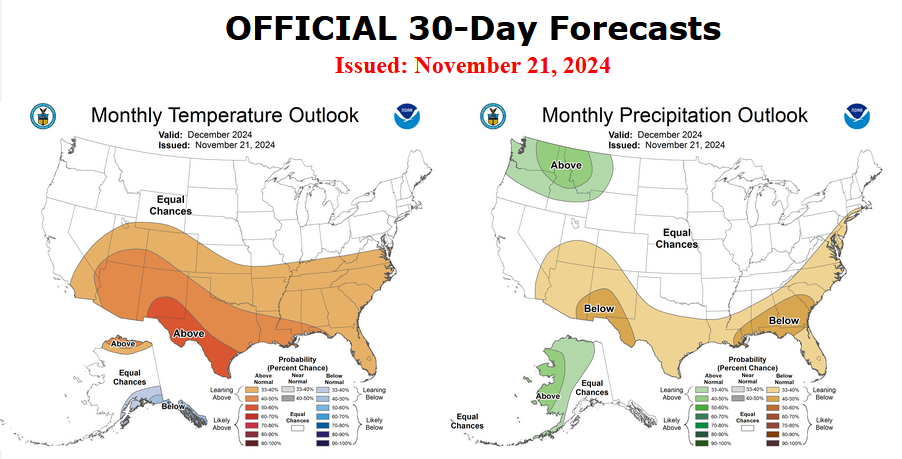
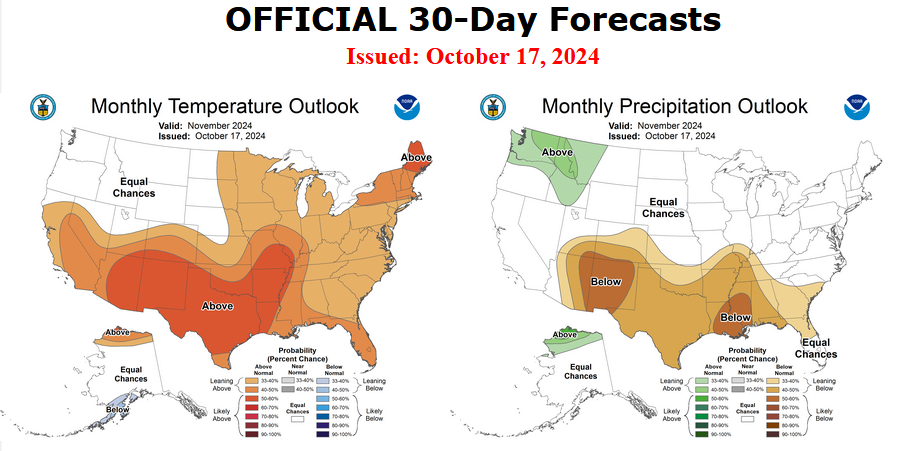
It will be updated on the last day of November.
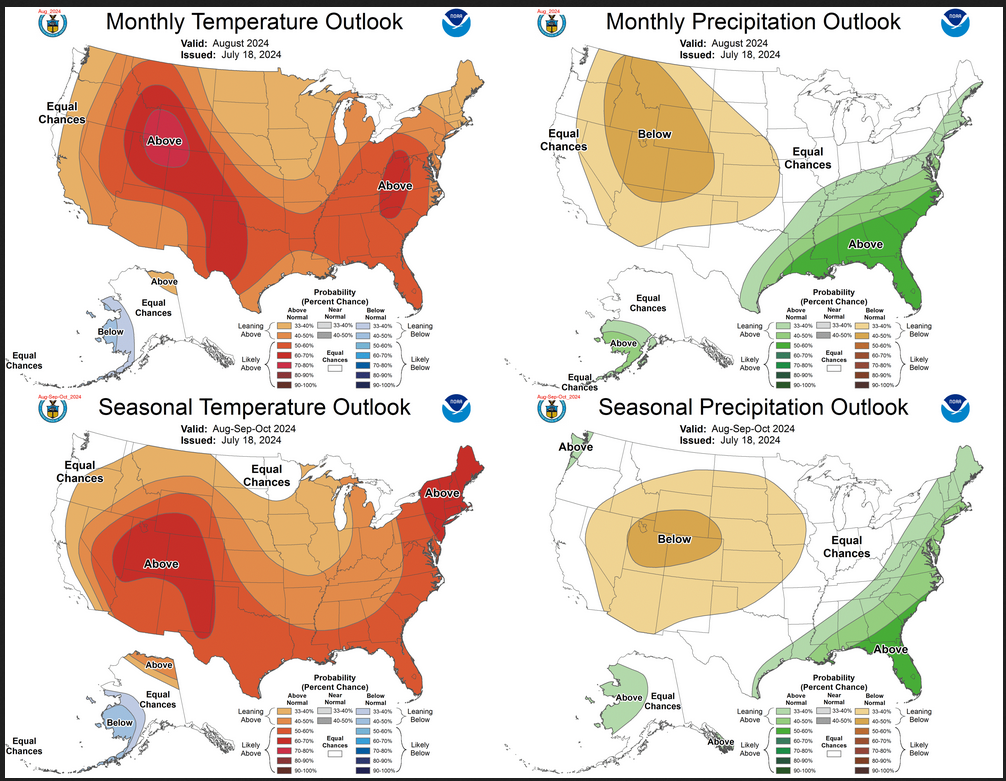
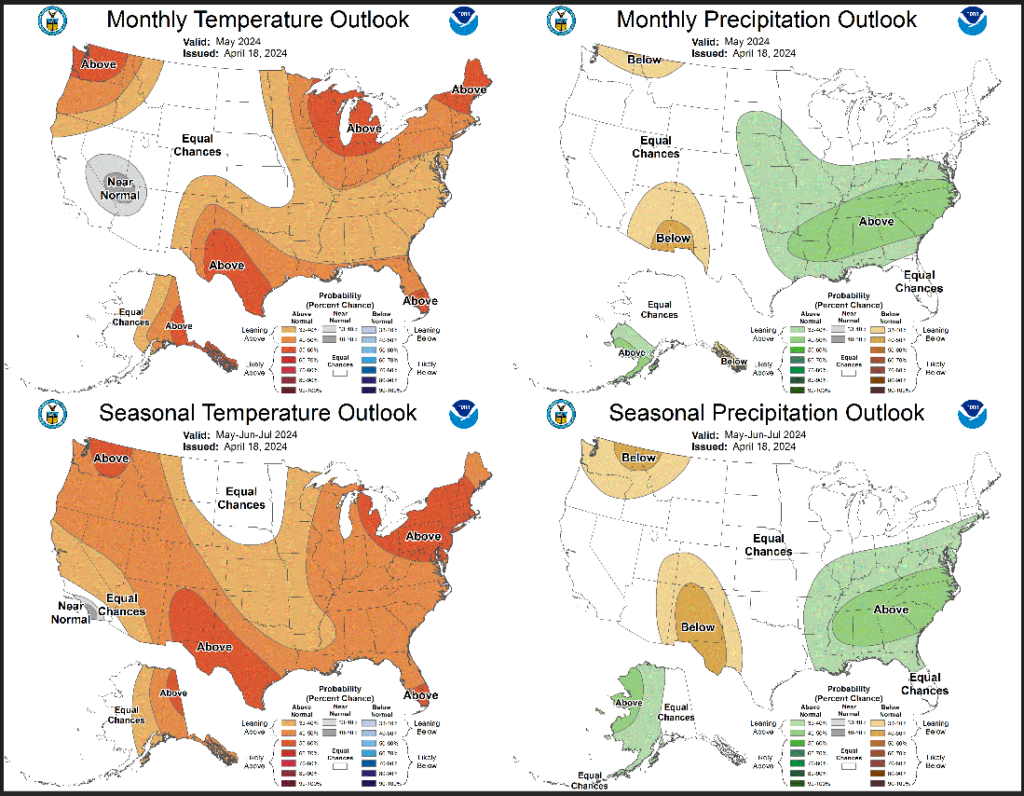
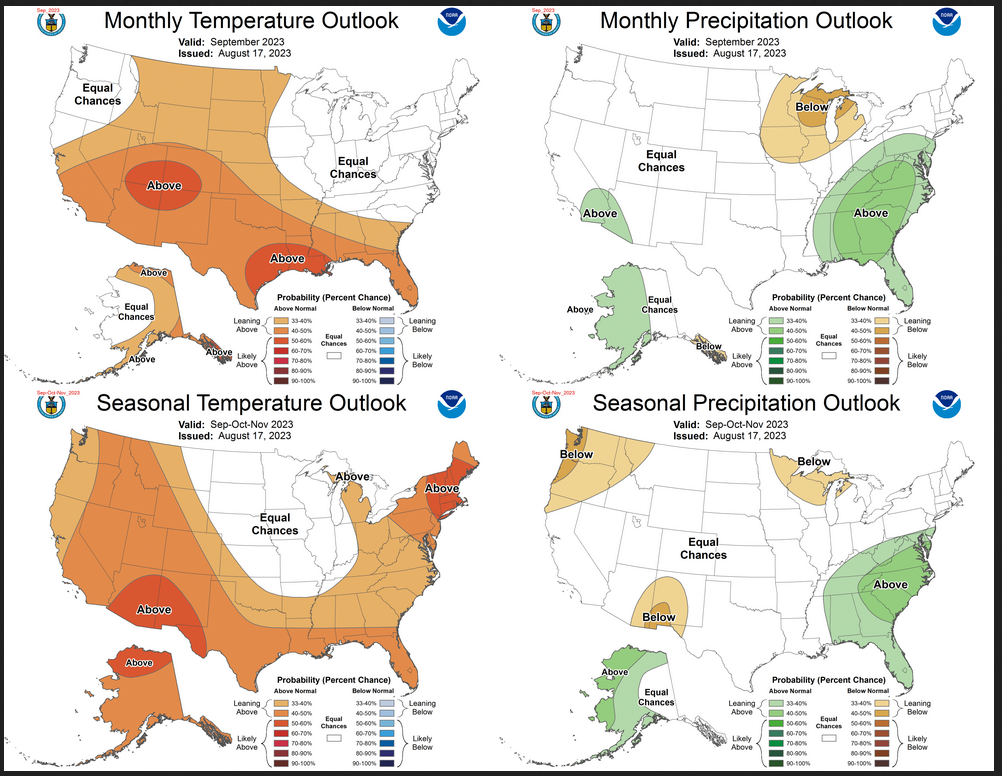
Then we look at a graphic that shows both the next month and the next three months.
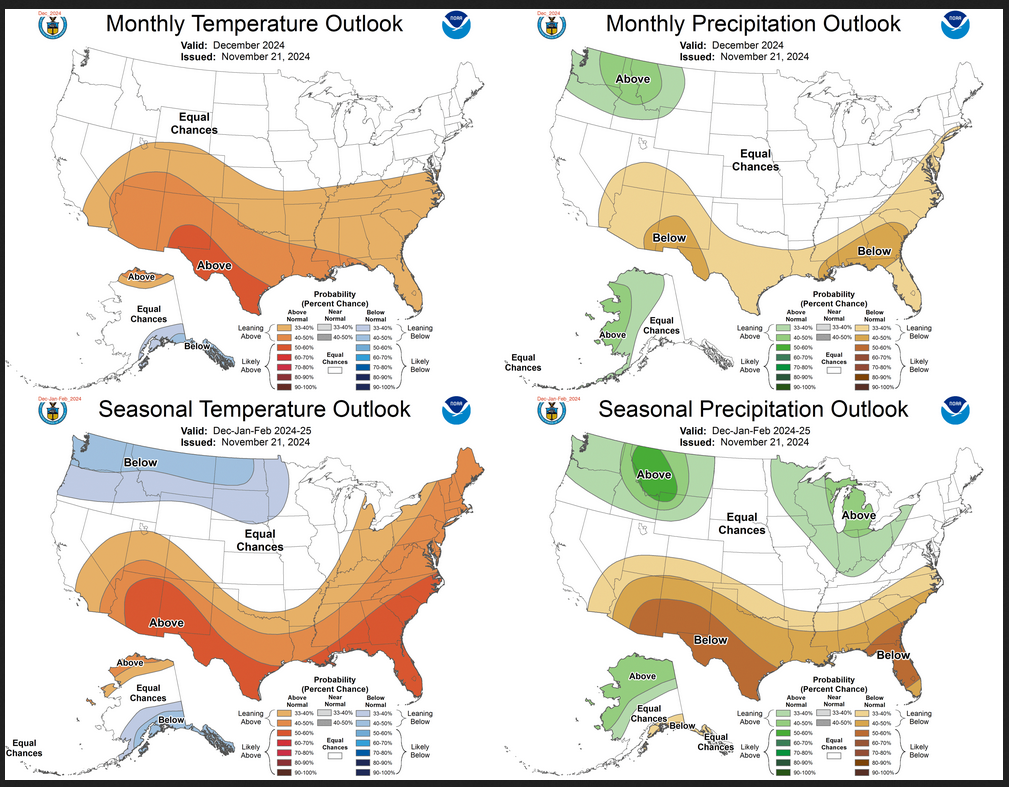
| Notice that the Outlook for next month and the three-month Outlook are fairly similar except in two places. This tells us that January and February will be substantially the same as December for most of CONUS and Alaska. Part of the explanation for this is that NOAA expects La Nina to impact all three months. |
–