You can read this post on the ENSO Blog HERE but you might find it convenient to read it here.
It is a great article and very worthwhile reading.
I have not added any comments to it in the body of this article. Any comments I have are here in the lede.
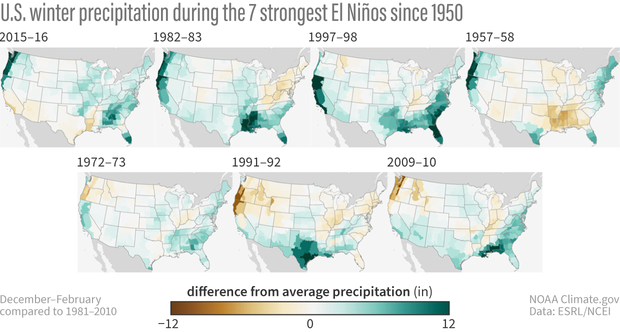
A. I question some of the graphics. re the La Nina part of the graphic since -1 is not stronger than -2
B. I was shocked at how poor the performance of the models is. I think how much of a coat our animals grow may be a better predictor.
It is an excellent article, you should read it.
Perhaps I should publish my analysis tool which I used to do. But I would have to update it and that is a lot like work. I think I have the information to do the analysis now

Please click below to read the full article and the comments to the article that show up as footnotes.