Looking Back at October 2024 Weather for the U.S. and the World – Posted on November 19, 2024
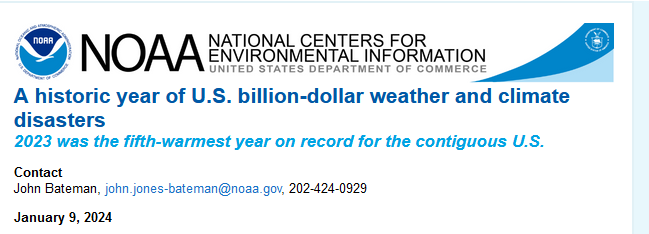
Much of the information in this report comes from the monthly emails I receive from John Bateman. He does public outreach for NOAA and in particular NCEI. I could find the same information and more on the NCEI website but John Bateman produces a good summary so I use it or most of it. I also add additional information from NCEI or other NOAA websites. At the end of the article, I provide links that will get you to the full reports and much additional information.

| My comments if any are in boxes like this one. |

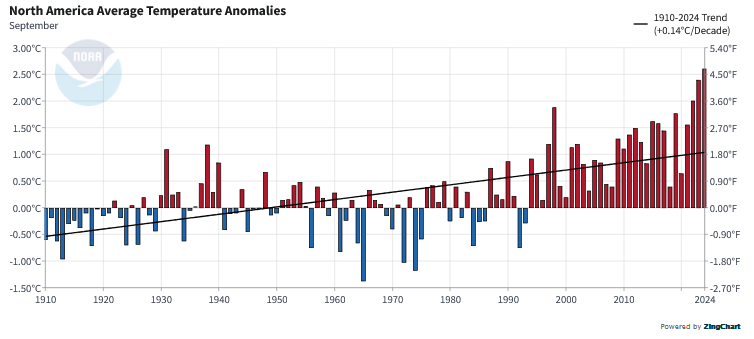
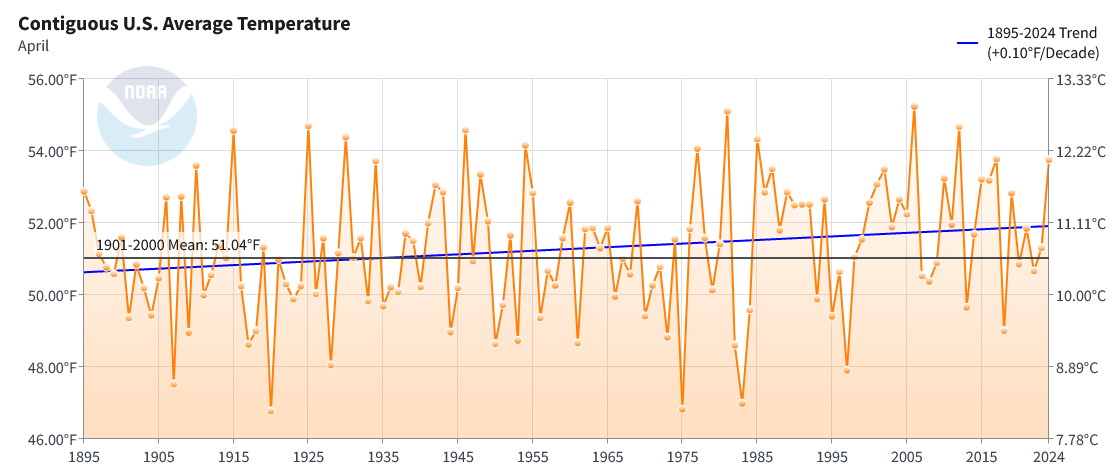
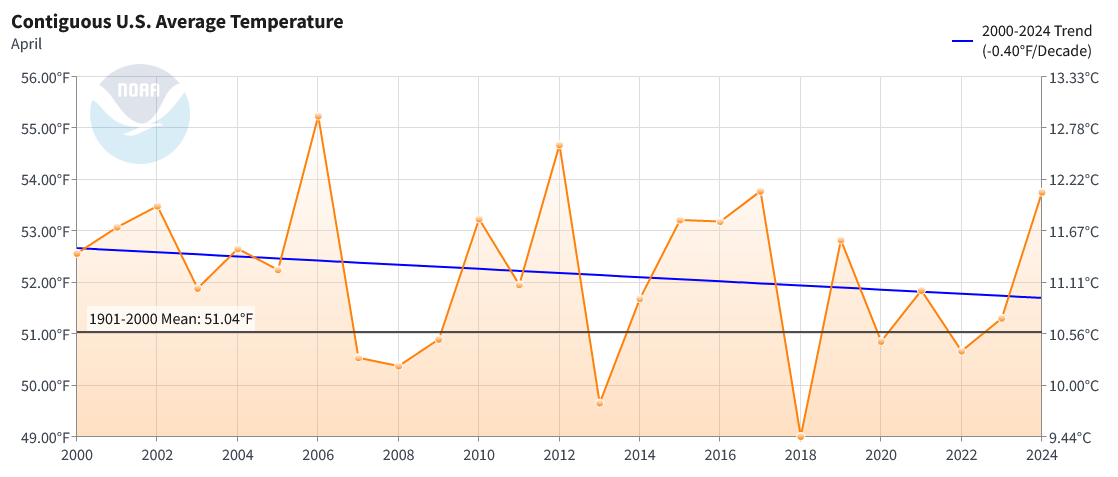
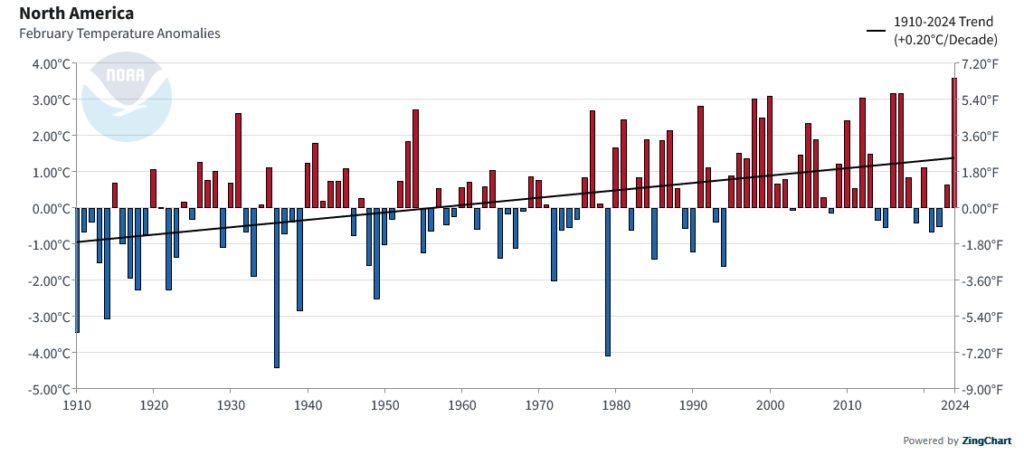
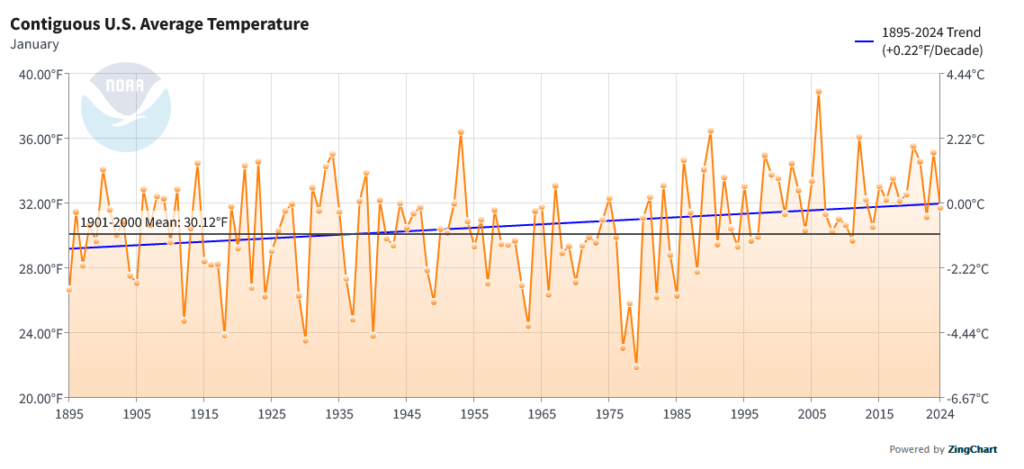
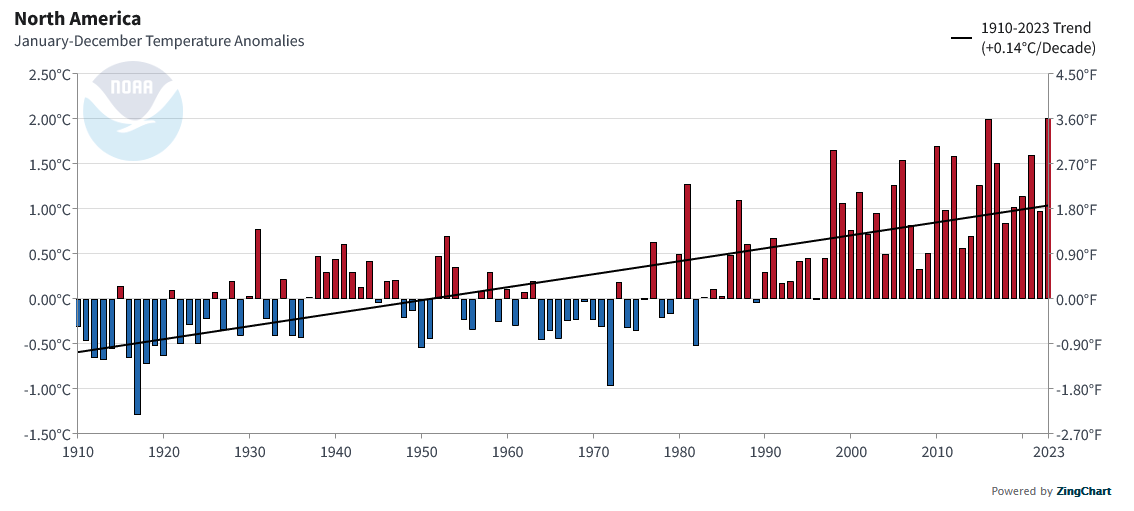
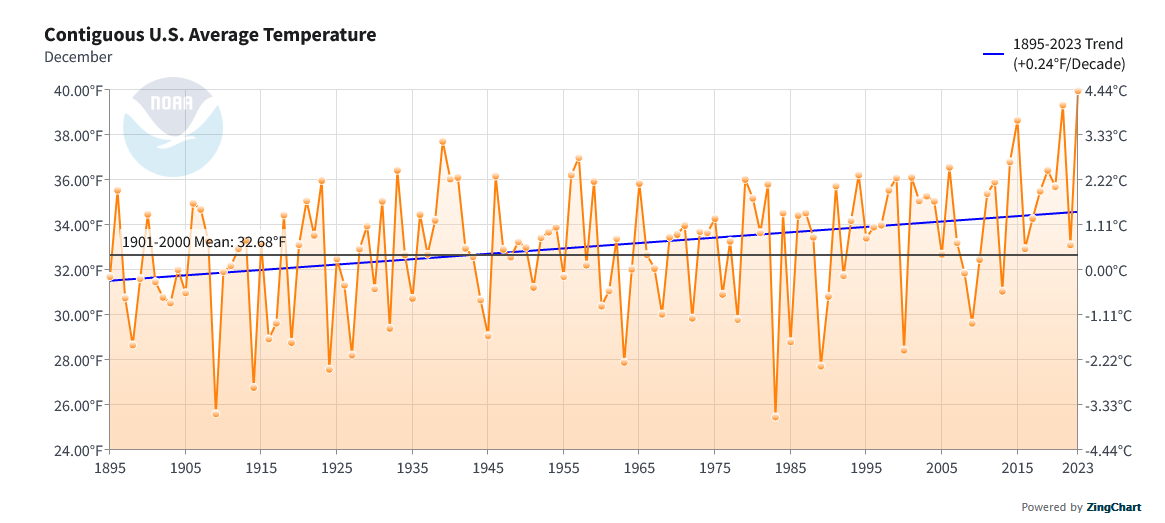
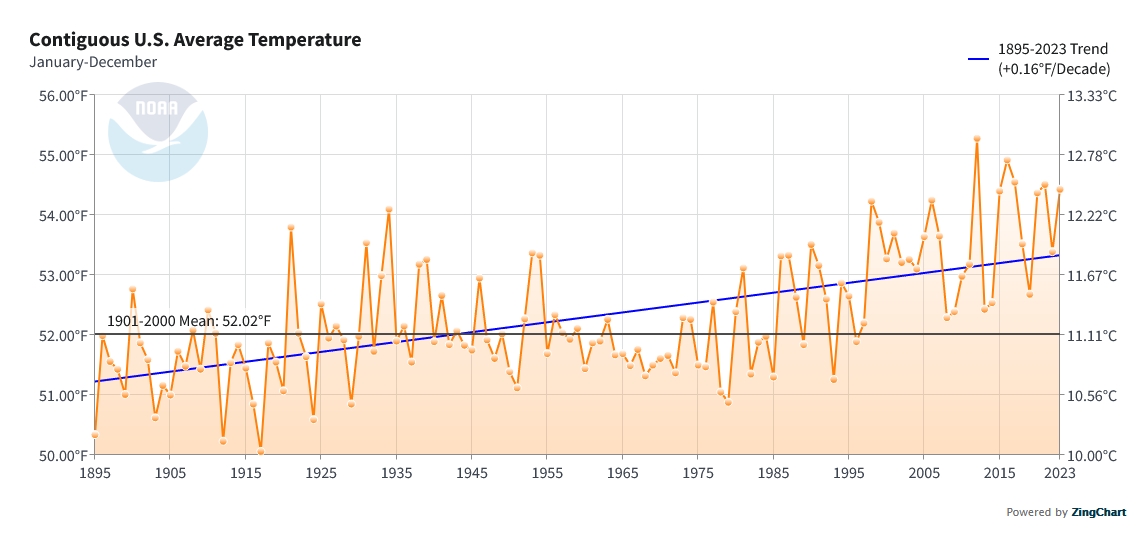
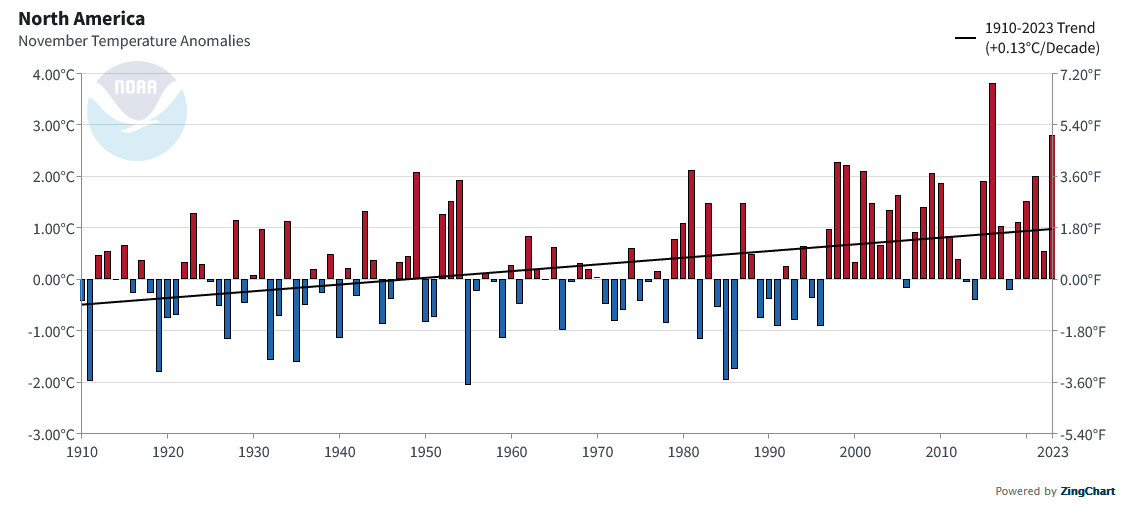
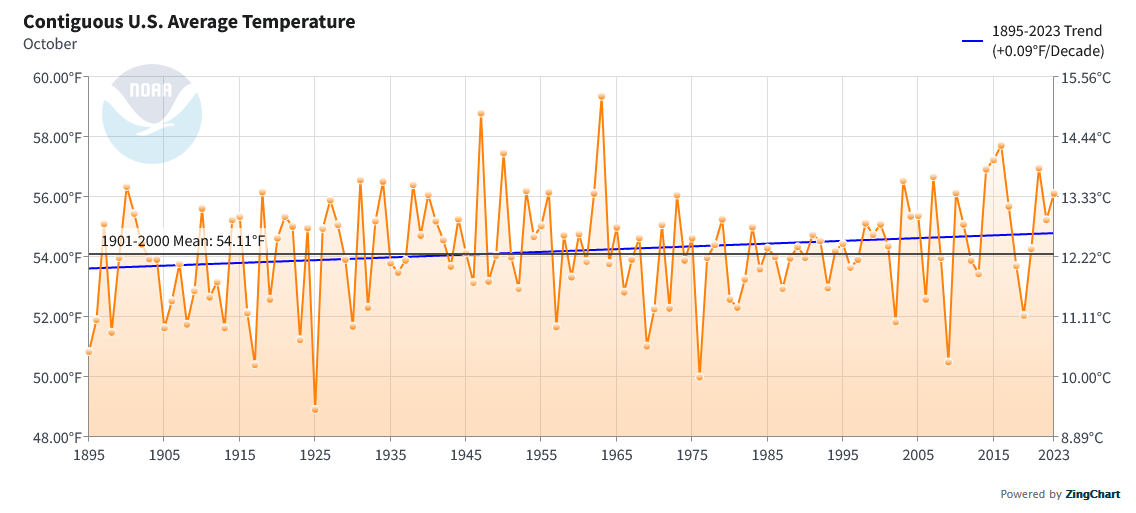
I start with the trends of October 2024 Temperature looking at North America and then the World both land and water and land only. There is a graphic for just CONUS but the format is different and it is not as easy to read.
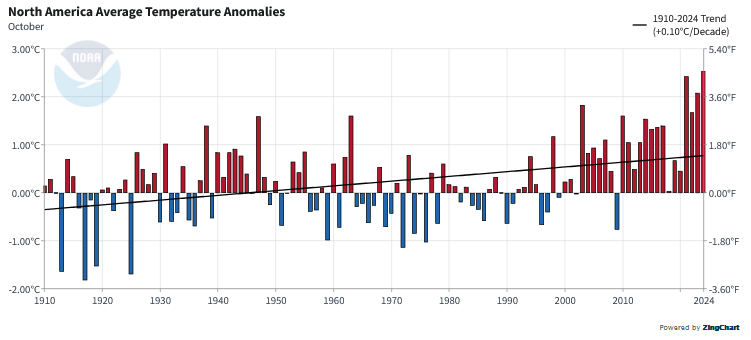
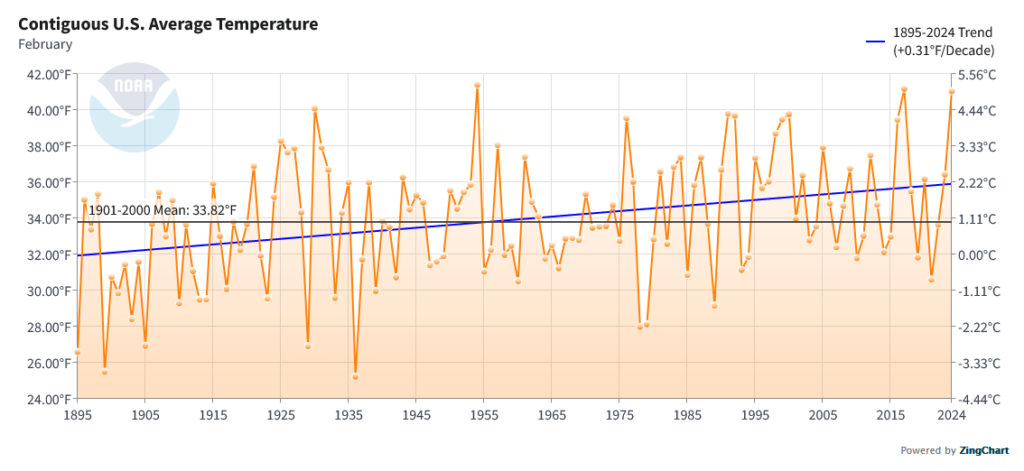
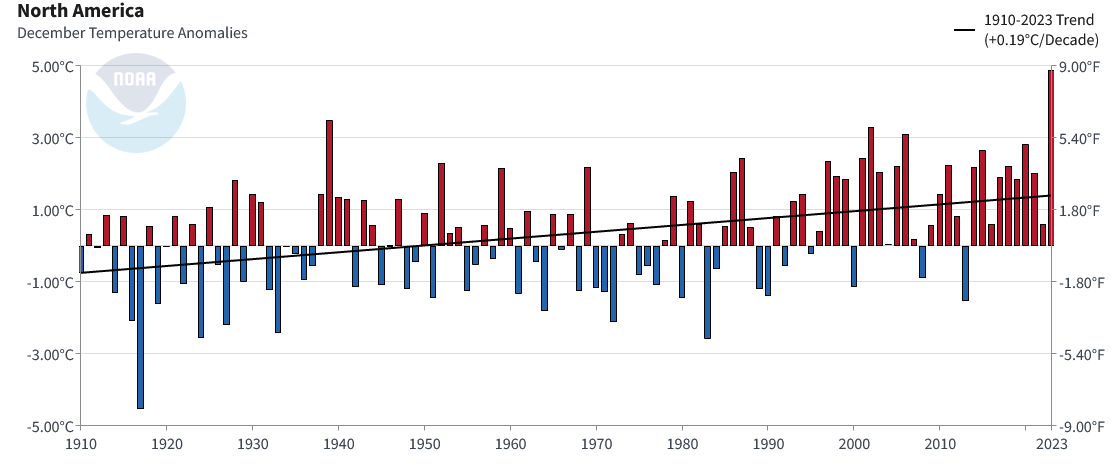
| This is the temperature trend for the month of October in North America. It covers a larger geographical area than just CONUS but I find it easier to read. It looks like the October temperature was a record for the month of October. |
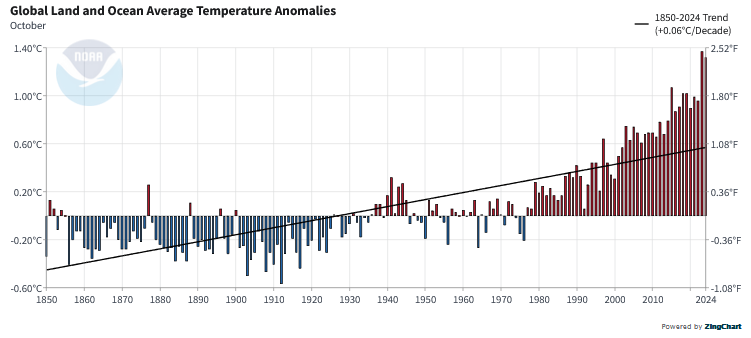
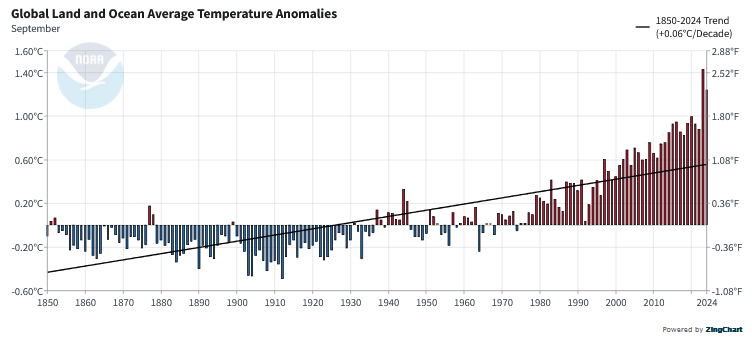
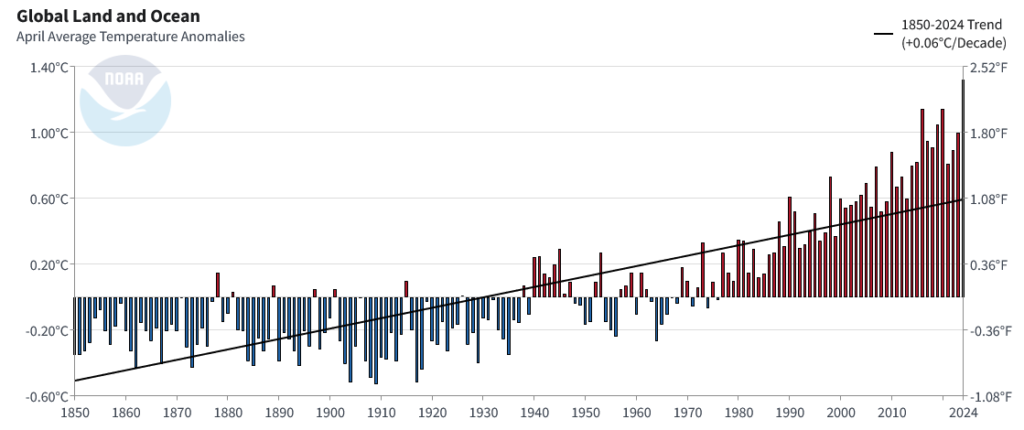
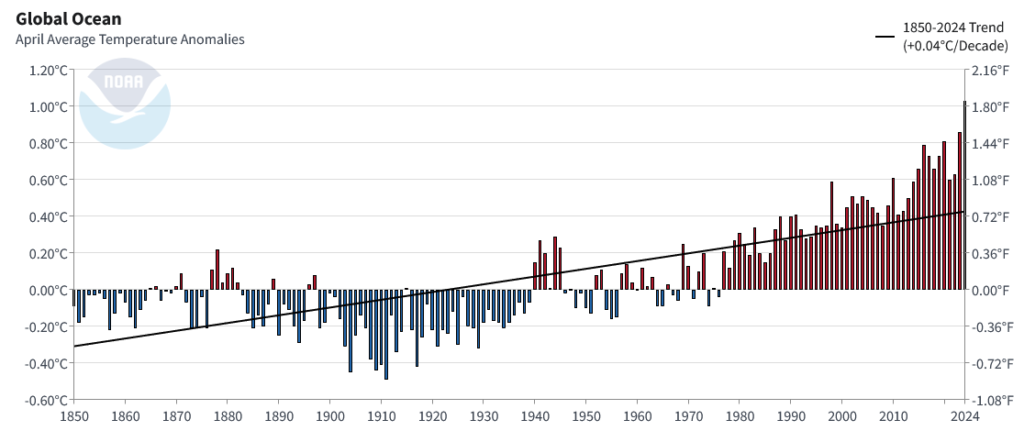
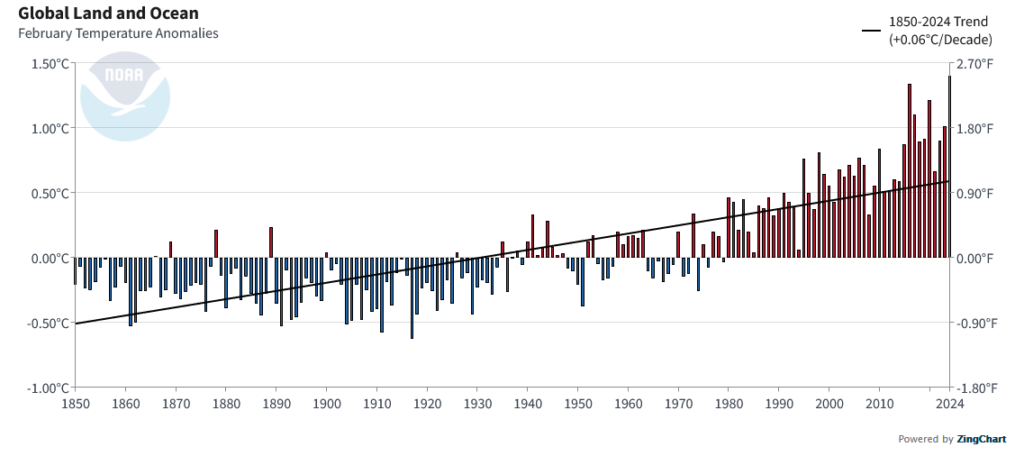
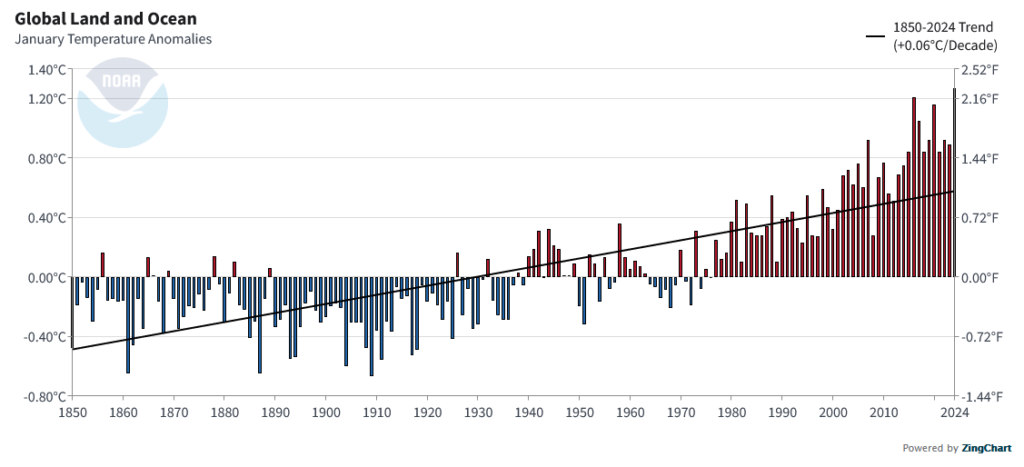
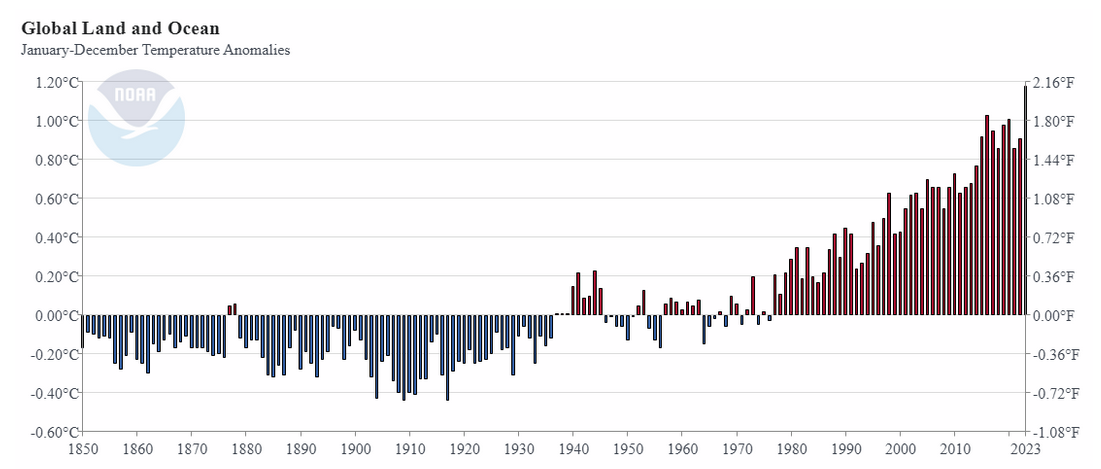
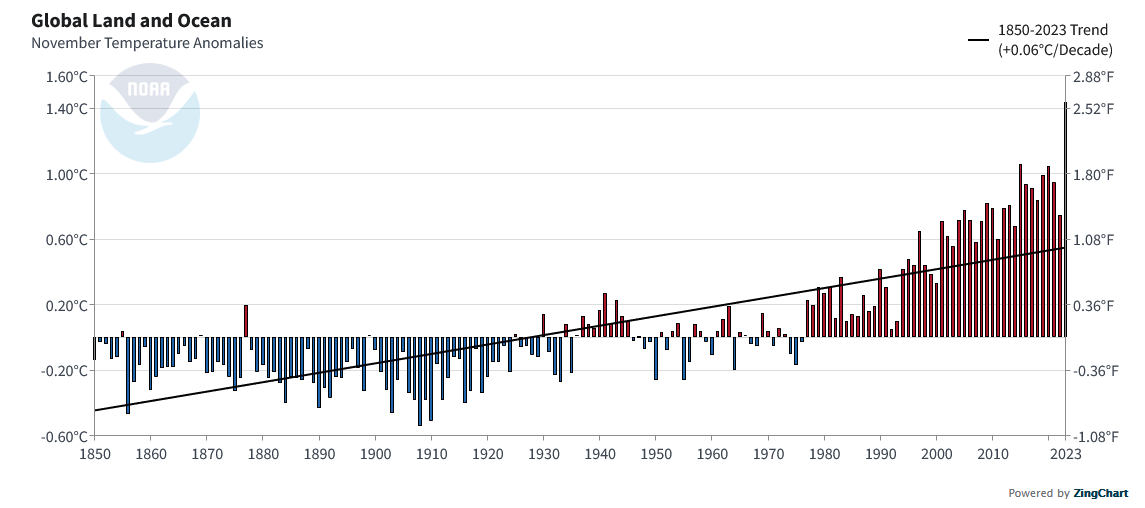
| The temperature for the world, land and ocean did not hit a new record. But the temperature for October this year and last was a lot higher than the trend. |
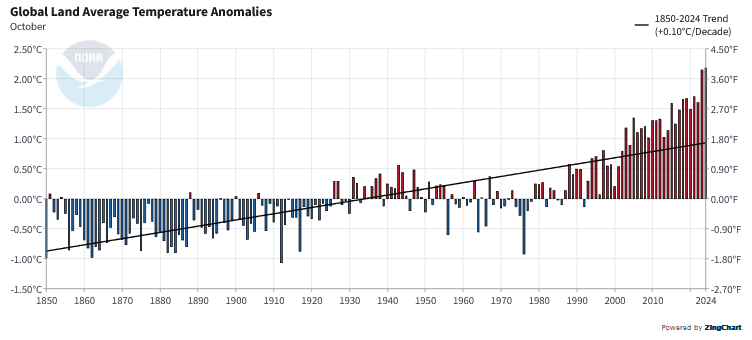
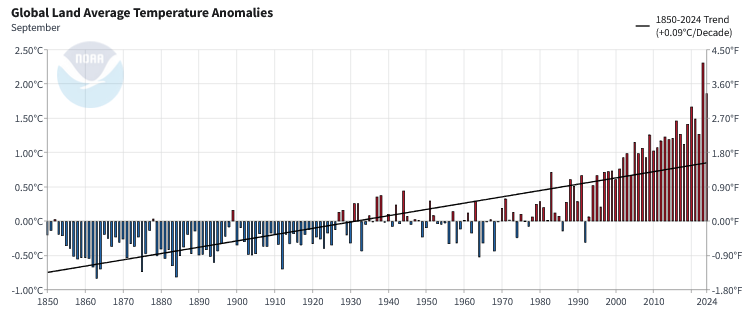
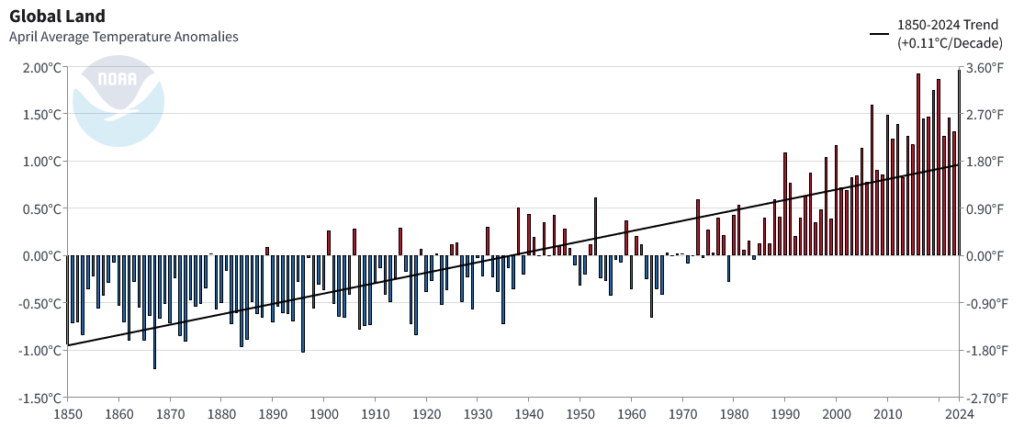
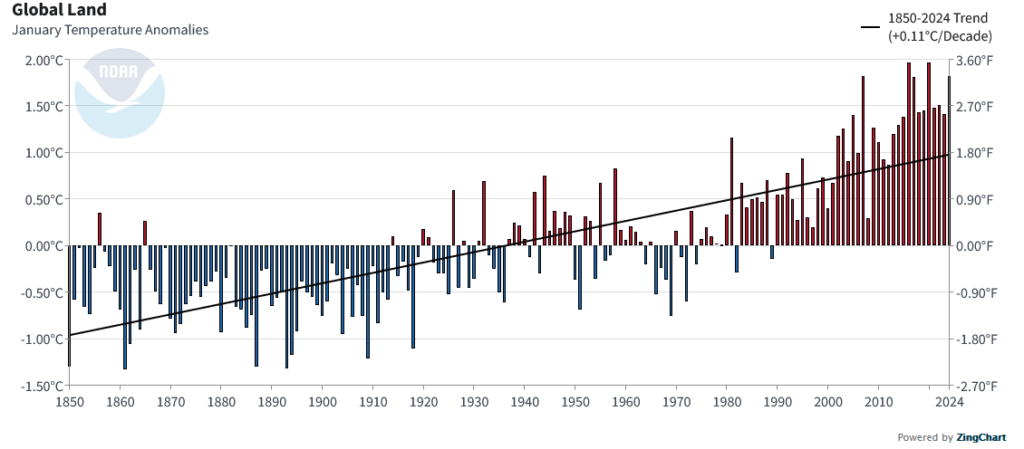
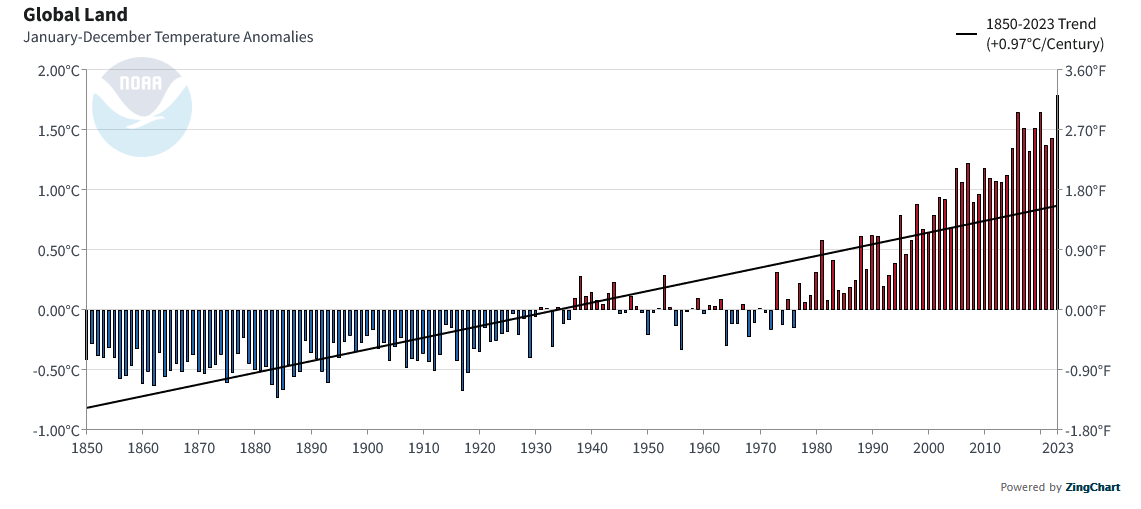
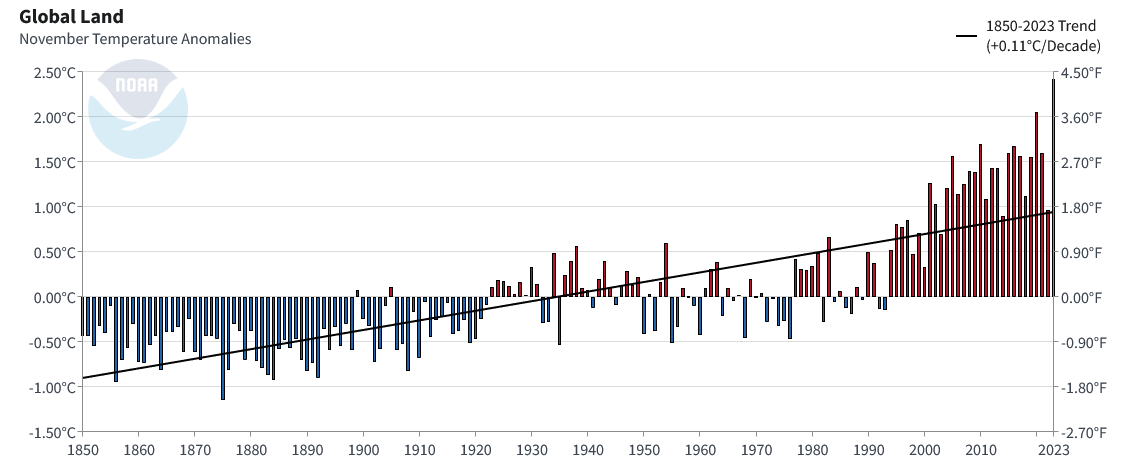
| The temperature for the world, (land only) may have hit a new record but was mostly tied with October of last year. Notice that land temperatures increase faster than land and ocean as water takes more energy. |