NOAA Updates its Seasonal Outlook on January 18, 2024 – Winners and Losers. Rapid Changes in ENSO Phases
Lightly Edited at 7:38 pm EST January 20, 2024
On the third Thursday of the month right on schedule NOAA issued their updated Seasonal Outlook which I describe as their Four-Season Outlook because it extends a bit more than one year into the future. The information released also included the Mid-Month Outlook for the following month plus the weather and drought outlook for the next three months. I present the information issued by NOAA and try to add context to it. It is quite a challenge for NOAA to address the subsequent month, the subsequent three-month period as well as the twelve successive three-month periods for a year or a bit more.
With respect to the long-term part of the Outlook which I call the Four-Season Outlook, there is a fairly rapid transition from El Nino to ENSO Neutral to LaNina. Thus there are some changes from what was issued last month.
First, Let’s Take a Look at the (mid-month) Outlook for February.
It will be updated on the last day of January.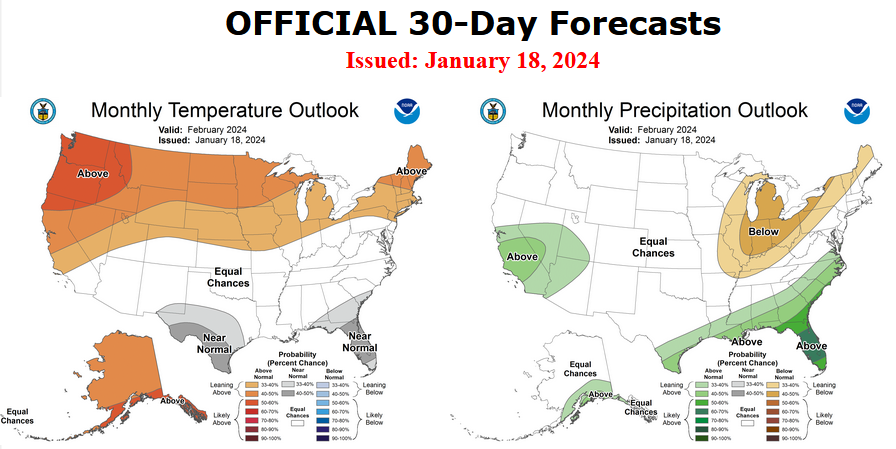
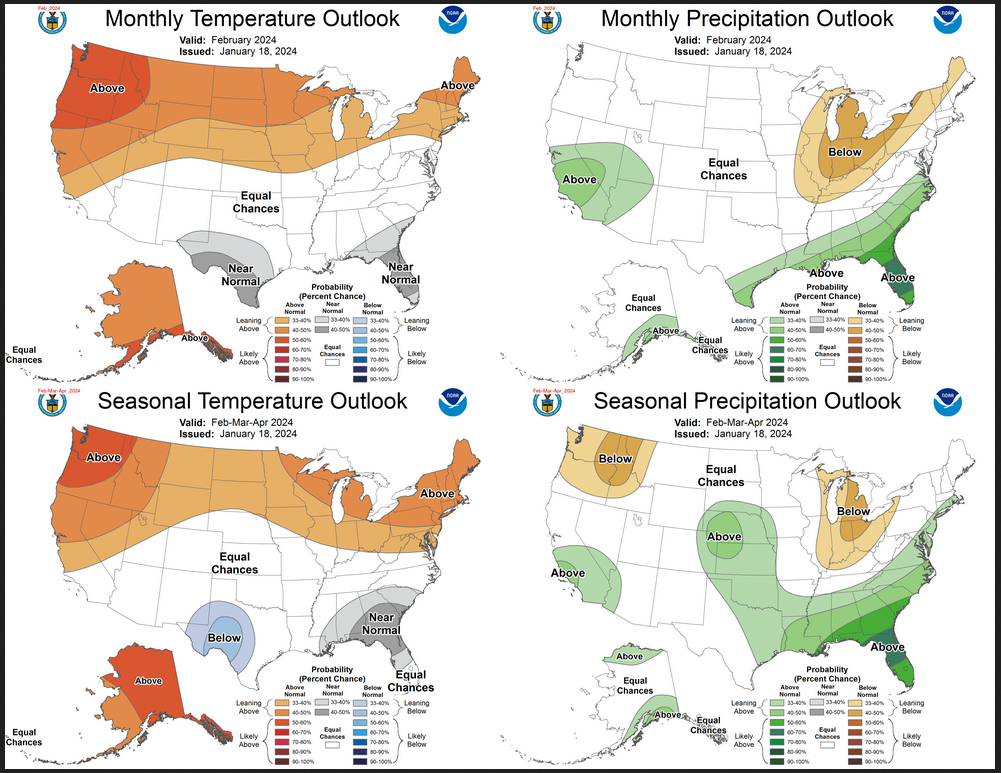
The top row is what is now called the Mid-Month Outlook for next month which will be updated at the end of this month. There is a temperature map and a precipitation map. The second row is a three-month outlook that includes next month. I think the outlook maps are self-explanatory. What is important to remember is that they show deviations from the current definition of normal which is the period 1991 through 2020. So this is not a forecast of the absolute value of temperature or precipitation but the change from what is defined as normal or to use the technical term “climatology”.
| Notice that the outlook for next month and the three-month outlooks are somewhat different, particularly with respect to precipitation. This tells us that March and April will be different than February to some extent. |
