NOAA Updates its December 2023 Weather Outlook on November 30, 2023 – There have been some significant changes from the Mid-Month Outlook.
Slightly modified at 6 pm EST December 1, 2023, to add additional clarity to the author’s comments.
At the end of every month, NOAA updates its Outlook for the following month which in this case is December of 2023. We are reporting on that tonight.
There have been some significant changes in the Outlook for December and these are addressed in the NOAA Discussion so it is well worth reading. We provided the prior Mid-Month Outlook for December for comparison. It is easy to see the changes by comparing the Mid-Month and Updated Maps.
The article includes the Drought Outlook for December. NOAA also adjusted the previously issued Seasonal Drought Outlook to reflect the changes in the December Drought Outlook. We have included a map showing the water-year-to-date precipitation. We also provide the Week 2/3 Tropical Outlook for the World.
The best way to understand the updated outlook for December is to view the maps and read the NOAA discussion. I have highlighted the key statements in the NOAA Discussion.
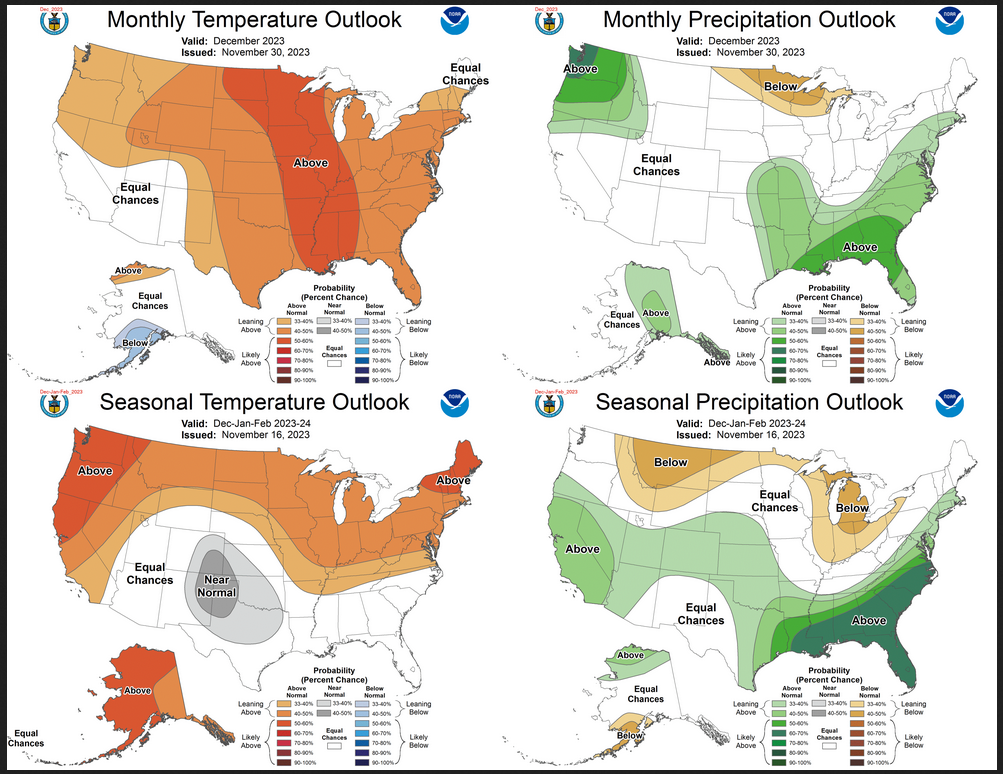
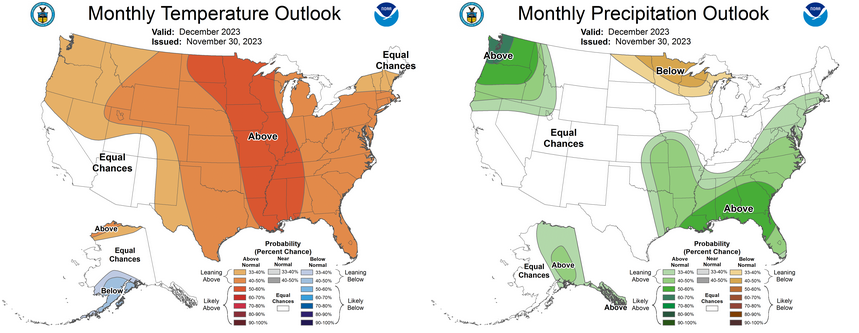
Here is the updated Outlook for December 2023
For Comparison Purposes, Here is the Mid-Month Outlook for December.
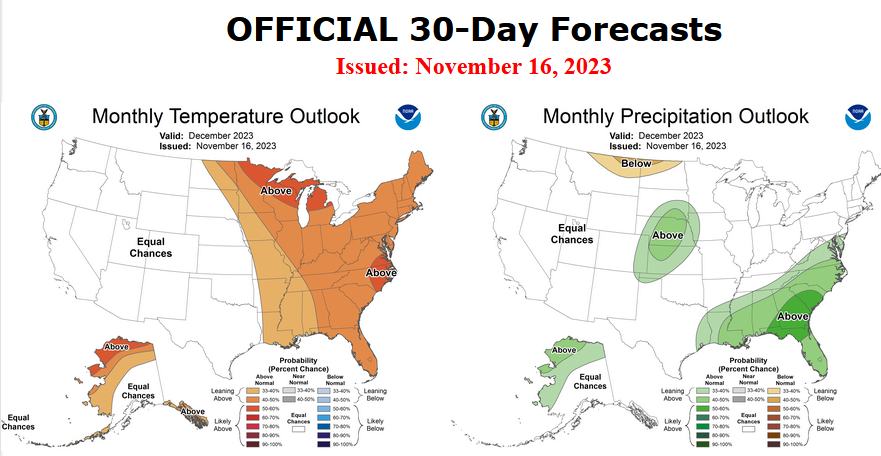
| There have been some significant changes especially related to Temperature. Remember, it is the top set of maps that are the current outlook for December. We are not sure that NOAA (actually their CPC Divison) has moved the storm track sufficiently south given the strength of this El Nino as measured by the Nino 3.4 Index. But it takes time for the impacts of an El Nino to be fully felt and there are conflicting factors. The sample size of very strong El Nino’s is very small so this complicates the forecasting process. The probability that his El Nino will record as being historically strong is less than 50% but well above zero. The atmosphere has not responded to the extent one might expect by just looking at the Nino 3.4 Index. The El Ninos with the highest level of the Nino 3.4 Index are not always the wettest but sometimes are. So we are dealing with a fair amount of uncertainty. You can track the changes in our Daily Weather Article. |