NOAA Updates It’s August, 2023 Outlook on July 31, 2023- There Have Been Some but not Dramatic Changes from the Mid-Month Outlook
At the end of every month, NOAA updates its Outlook for the following month which in this case is August of 2023. We are reporting on that tonight.
There have been some changes in the Outlook for August but they are not dramatic and these are addressed in the NOAA Discussion so it is well worth reading. We provided the prior Mid-Month Outlook for August for comparison. It is easy to see the changes by comparing the Mid-Month and Updated Maps.
The article includes the Drought Outlook for August. NOAA also adjusted the previously issued Seasonal Drought Outlook to reflect the changes in the August Outlook. We have also included the current fire incidents and a map showing the water-year-to-date precipitation. We also provide the Week 2/3 Tropical Outlook for the World.
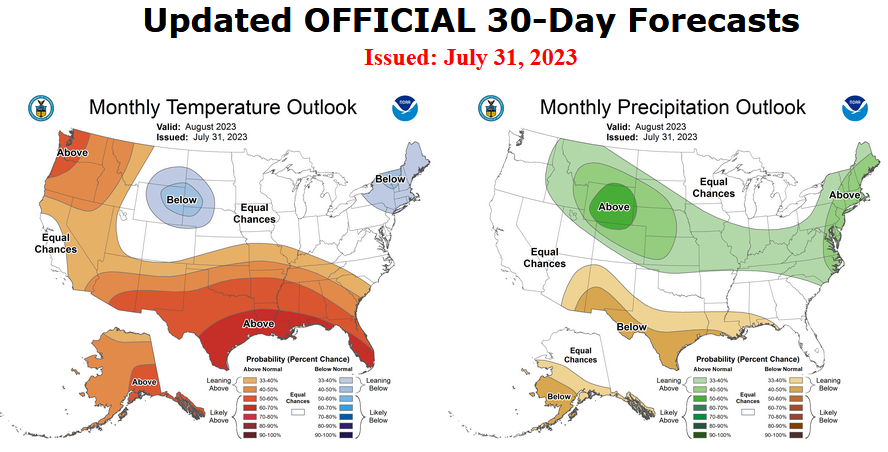
The best way to understand the updated outlook for August is to view the maps and read the NOAA discussion. But here are some of the highlights:
- El Niño conditions are present in observations of the equatorial Pacific atmospheric and ocean, and are likely to continue through the month of August and into later seasons.
- The updated August temperature outlook favors above normal temperatures across Alaska with more likely above normal temperatures for southeastern Alaska,
- Above normal temperatures continue to be favored for much of the West, as in the prior outlook. However, probabilities of above normal have decreased substantially across the Great Basin, and there are now equal chances (EC) of above, near or below normal temperatures for much of California,
- Below normal temperatures are favored for a small area of the northern High Plains,
- Probabilities of above normal temperatures are further enhanced from the Southern Plains into the Southeast,
- Average below normal temperatures are slightly favored for parts of the Northeast for the month of August,
- The updated August precipitation outlook favors below normal precipitation for southwestern areas of the Alaska Mainland eastward along the coast into southeast Alaska,
- Above normal precipitation is favored in a swath from the northern Rockies across parts of the High Plains, the Central Plains, and Ohio Valley,
- Above normal precipitation is likely for August, probabilities exceeding 50 percent, for a small area of the northern High Plains,
- Above normal precipitation is favored for the East Coast from parts of the Carolinas to New England, with much above average sea surface temperatures offshore and the influx of moisture.
- Below normal precipitation is favored from parts of the Southwest, the Rio Grande Valley, and the Gulf Coast, to the Florida Panhandle,
Here is the updated Outlook for August 2023
For Comparison Purposes, Here is the Mid-Month Outlook for August.
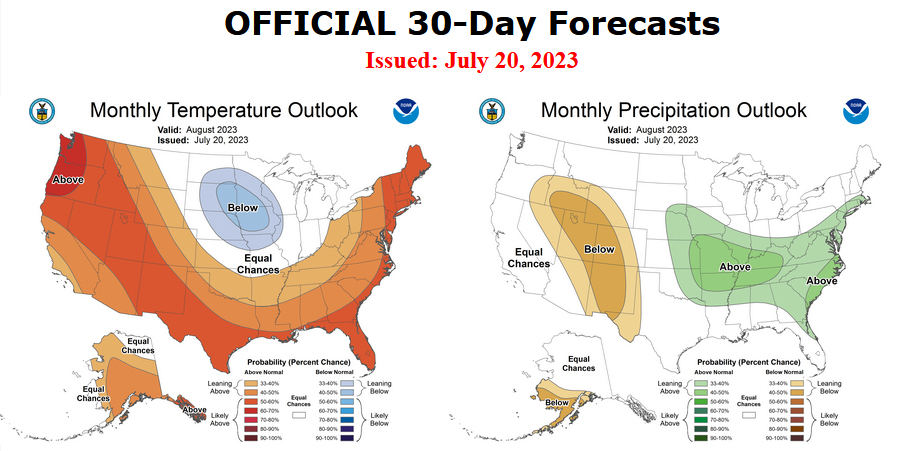
| There has been some change but not dramatic. Remember, it is the top set of maps that are the current outlook for August. |
Combination of the Updated Outlook for August and the Three-Month Outlook
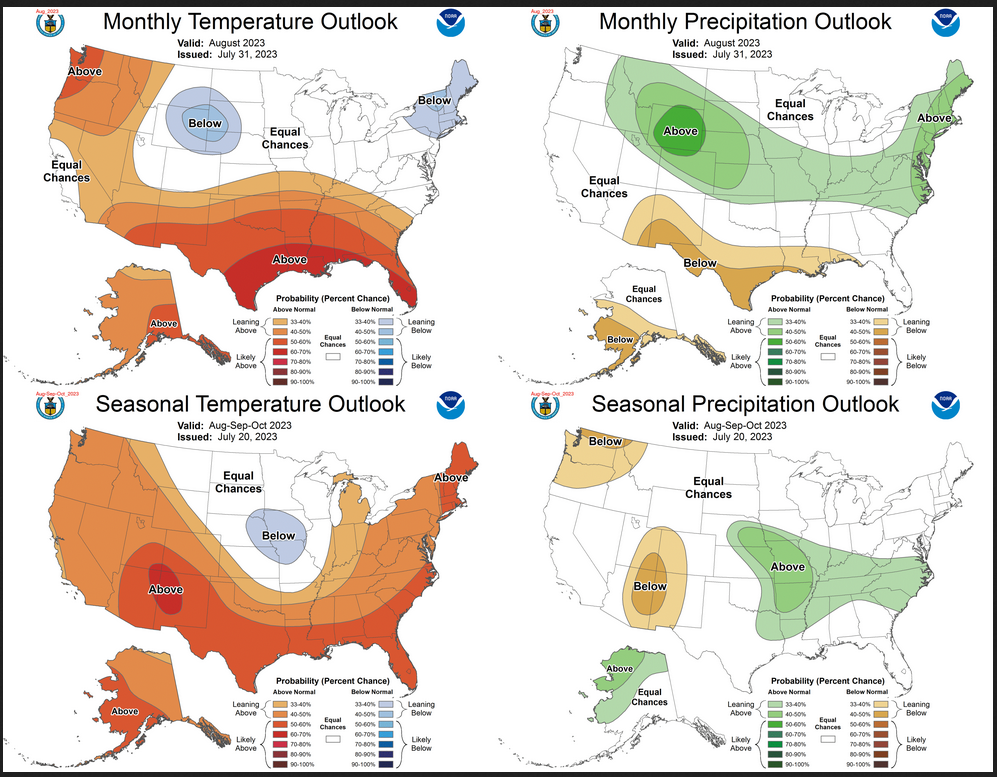
| Not much difference between August and the three-month period that includes August. I am too tired to figure it out right now but there is some similarity between the one-month and three-month and the mid-month for August and the updated outlook for August. There is no reason for that but if I am not dreaming it there is some pattern there which I will look at again the next time I am coherent and have the time to do it. |
ANALYSIS
Notice that for both temperature and precipitation, the one-month Outlook and three-month Outlook are not similar. This suggests that the Outlook for the combined second and third months if shown would be different than either the Outlook for the First (next) Month or the Three-Month Outlook. The formula for calculating the combined second and third-month outlook is:
For both temperature and precipitation, if you assume the colors in the maps are assigned correctly, it is a simple algebra equation to solve the month two/three anomaly probability for a given location = (3XThree-Month Probability – Month One Probability)/2*. So you can derive the month two/three outlook this way. You can do that calculation easily for where you live or for the entire map.
It is important to remember that the Outlook for next month was updated on the last day of the current month and the three-month Outlook was issued on the third Thursday. So the period of time between the Mid-Month and End of Month Update varies from month to month from 10 days to 16 days. So there sometimes is a substantial change in the Next Month’s Outlook from the Mid-Month prediction. In such cases, we wonder if a change in the one-month outlook suggests that the three-month outlook would need to also be adjusted. This month I do not think that it is the case.