Let’s take a look at the Weather in April 2024 in the U.S. and Globally – Posted on May 20, 2024
Much of the information in this report comes from the monthly emails I receive from John Bateman. He does public outreach for NOAA and in particular NCEI. I could find the same information and more on the NCEI website but John Bateman produces a good summary so I use it or most of it. I also add additional information from NCEI or other NOAA websites. At the end of the article, I provide links that will get you to the full reports and much additional information.
Looking at the trend for April over time.
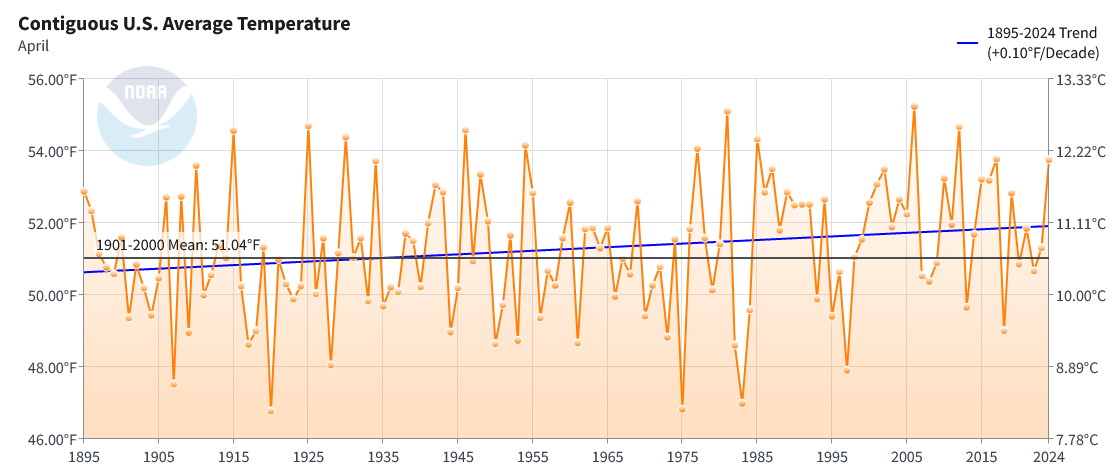
| This is the temperature trend for April in CONUS. |
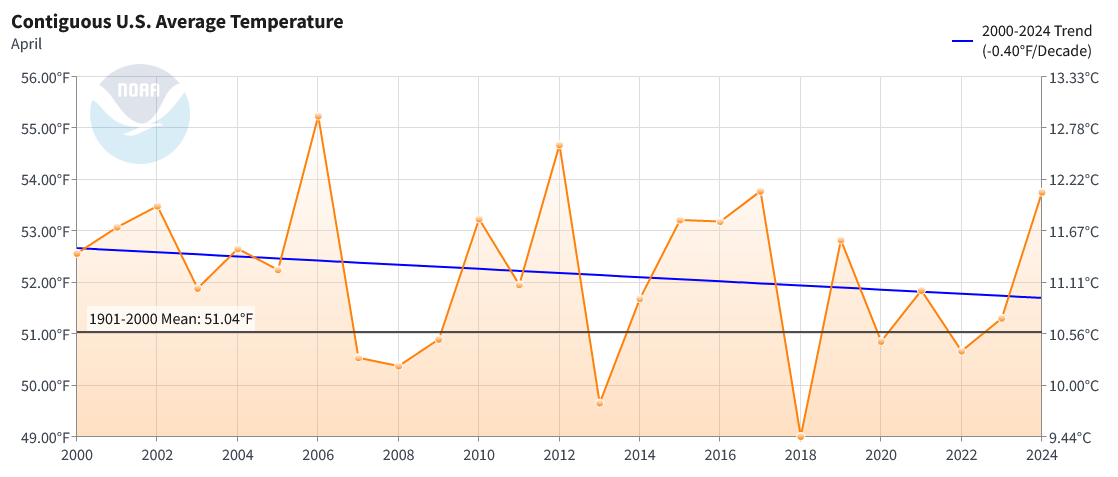
| But look at this the most recent 25 years. No increase but a decrease. Data can be misleading if you do not look at it carefully |
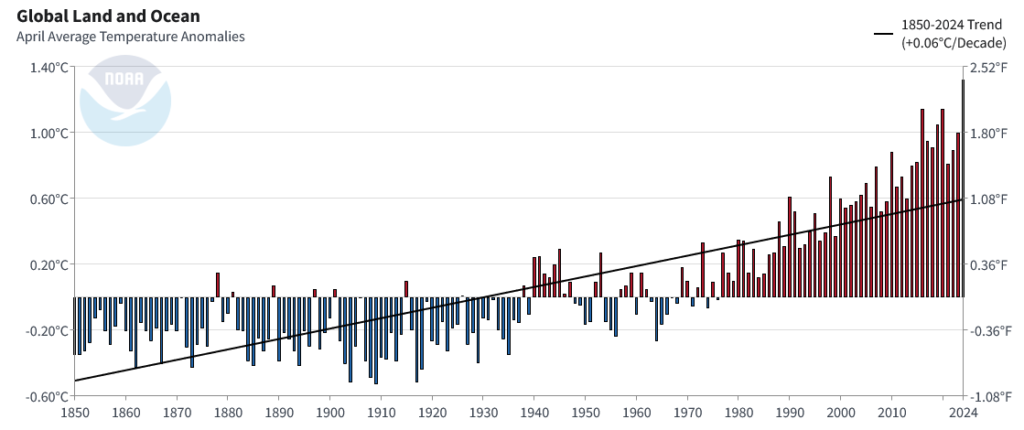
| The temperature for the world, land and water hit a new record. |
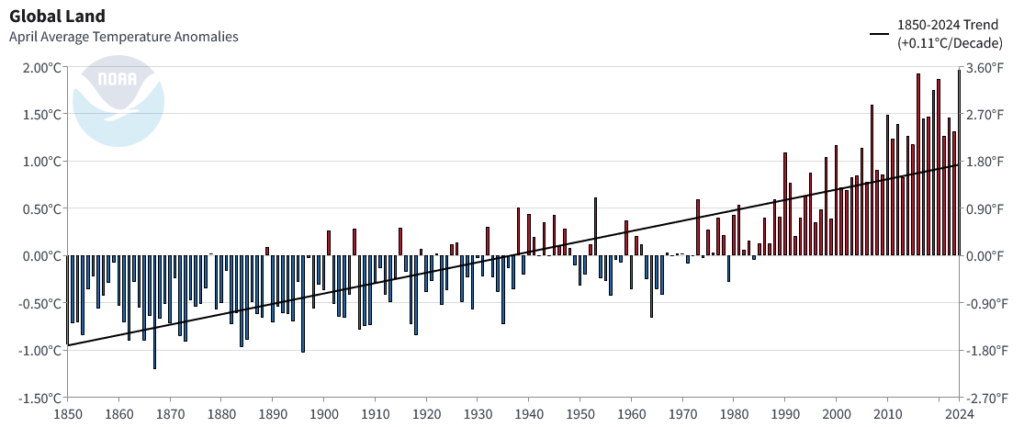
| The temperature for the world, land only also was a record. |
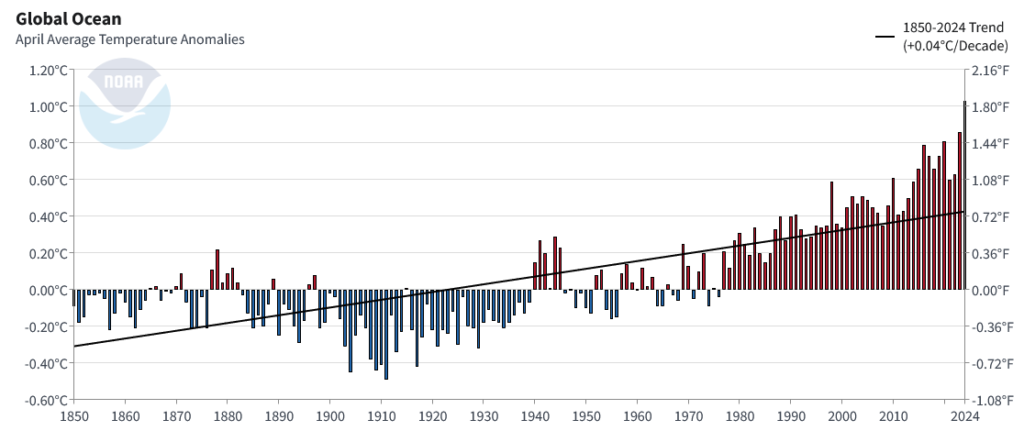
| The temperature for the world’s oceans also hit a record. Notice the slope is less. You can see the impact of ENSO in this graphic. |