NOAA Updates its April 2023 Weather Outlook – There are Significant Changes which are mostly Wetter – Posted on April 1, 2024
At the end of every month, NOAA updates its Outlook for the following month which in this case is April of 2024. We are reporting on that tonight.
There have been some significant changes in the Outlook for April and these are addressed in the NOAA Discussion so it is well worth reading. We provided the prior Mid-Month Outlook for April for comparison. It is easy to see the changes by comparing the Mid-Month and Updated Maps.
The article includes the Drought Outlook for April. NOAA also adjusted the previously issued Seasonal (AMJ) Drought Outlook to reflect the changes in the April Drought Outlook. We have included a map showing the amount of water in the snowpack waiting to be released in the Spring. We also provide the Week 2/3 Tropical Outlook for the World. We also include a very interesting CLIMAS Discussion.
The best way to understand the updated outlook for April is to view the maps and read the NOAA discussion. I have highlighted the key statements in the NOAA Discussion.
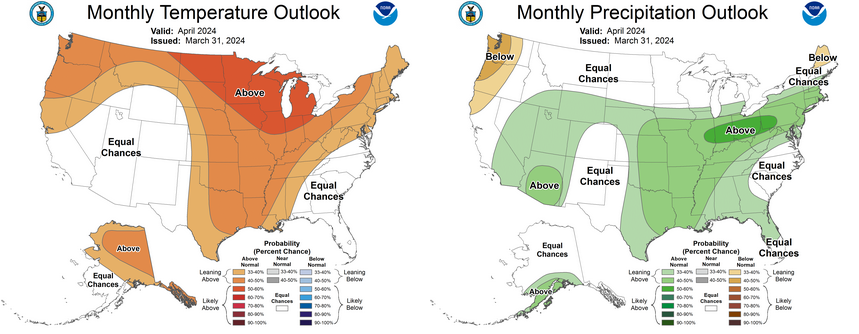
Here is the updated Outlook for April 2024.
For Comparison Purposes, Here is the earlier Mid-Month Outlook for April
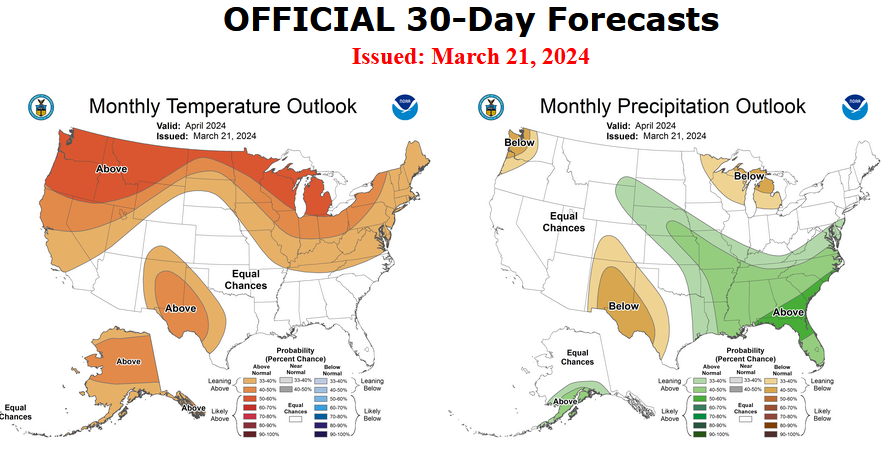
| There have been some significant changes. Remember, it is the top set of maps that are the current outlook for April. |
Combination of the Updated Outlook for April and the Three-Month Outlook
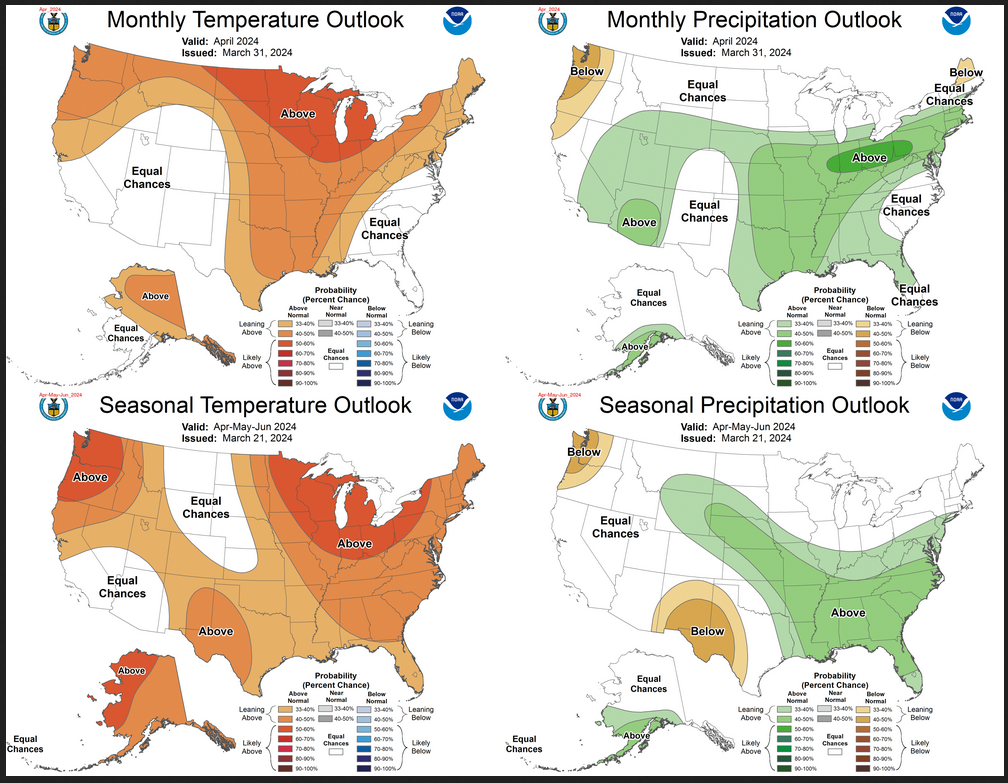
| The top row is the Updated Outlook for the new month. There is a temperature map and a precipitation map. The second row is a three-month outlook that includes the new month. I think the outlook maps are self-explanatory. What is important to remember is that they show deviations from the current definition of normal which is the period 1991 through 2020. So this is not a forecast of the absolute value of temperature or precipitation but the change from what is defined as normal or to use the technical term climatology. |
| The three-month map was issued on March 21, 2024. One expects some changes 10 days later. But the changes to both maps are fairly dramatic. This then gives us some reason to question the three-month AMJ temperature and precipitation Outlooks. |