25 Jun 2024 Market Close & Major Financial Headlines: Small Caps Opened Sharply Higher While The Dow Slid To Lows Seen Two Session Ago. Markets Closed Mixed.

Summary Of the Markets Today:

  • The Dow closed down 299 points or 0.76%,
  • Nasdaq closed up 1.26%,
  • S&P 500 closed up 0.39%,
  • Gold $2,332 down $12.80,
  • WTI crude oil settled at $81 down $0.86,
  • 10-year U.S. Treasury 4.230 down 0.018 points,
  • USD index $105.61 up $0.140,
  • Bitcoin $61,991 up $1,728 or 2.87%,

*Stock data, cryptocurrency, and commodity prices at the market closing.


Click here to read our current Economic Forecast – May 2024 Economic Forecast: No Real Change So Expect The Economy To Continue To Plod Along


Today’s Economic Releases Compiled by Steven Hansen, Publisher:

The Chicago Fed National Activity Index (CFNAI) three-month moving average, CFNAI-MA3, decreased to –0.09 in May 2024 from –0.05 in April. The CFNAI-MA3 is used for economic forecasting. Even with this month’s decline, the CFNAI-MA3 is trending up – A value below zero has been associated with the national economy expanding with below-average growth. An increasing likelihood of a recession has historically been associated with a CFNAI-MA3 value below –0.70. The CFNAI is the best coincident index out there.

The S&P CoreLogic Case-Shiller 20-City Composite posted a year-over-year increase of 7.2% in May 2024, dropping from a 7.5% increase in the previous month. Brian D. Luke, Head of Commodities, Real & Digital Assets at S&P Dow Jones Indices gave this analysis:

For the second consecutive month, we’ve seen our National Index jump at least 1% over its previous all-time high. 2024 is closely tracking the strong start observed last year, where March and April posted the largest rise seen prior to a slowdown in the summer and fall. Heading into summer, the market is at an all-time high, once again testing its resilience against the historically more active time of the year. Thirteen markets are currently at all-time highs and San Diego reigns supreme once again, topping annual returns for the last six months. The Northeast is the best performing market for the previous nine months, with New York rising 9.4% annually. Sustained outperformance of the Northeast market was last observed in 2011. For the decade that followed, the West and the South held the top posts for performance. It’s now been over a year since we’ve seen the top region come from the South or the West. Last month’s all-time high came with all 20 markets accelerating price gains. This month, just over half of our markets are seeing prices accelerate on a monthly basis. At 6.3% annual gains, the index has decelerated from the start of the year, with only two markets rising on an annual basis.

The Richmond Fed’s manufacturing activity slowed in June 2024. The composite manufacturing index decreased from 0 in May to −10 in June. Of its three component indexes, shipments fell notably from 13 to −9, new orders decreased from −6 to −17, and employment rose from −6 to −2. Manufacturing remains a soft spot in the current USA economy.

The Conference Board Consumer Confidence Index® dipped in June 2024 to 100.4 (1985=100), down from 101.3 in May. Dana M. Peterson, Chief Economist at The Conference Board had this to say:

Confidence pulled back in June but remained within the same narrow range that’s held throughout the past two years, as strength in current labor market views continued to outweigh concerns about the future. However, if material weaknesses in the labor market appear, Confidence could weaken as the year progresses. Consumers expressed mixed feelings this month: their view of the present situation improved slightly overall, driven by an uptick in sentiment about the current labor market, but their assessment of current business conditions cooled. Meanwhile, for the second month in a row, consumers were a bit less pessimistic about future labor market conditions. However, their expectations for both future income and business conditions weakened, weighing down the overall Expectations Index. The decline in confidence between May and June was centered on consumers aged 35-54. By contrast, those under 35 and those 55 and older saw confidence improve this month. No clear pattern emerged in terms of income groups. On a six-month moving average basis, confidence continued to be highest among the youngest (under 35) and wealthiest (making over $100K) consumers.

Here is a summary of headlines we are reading today:

Click on the “Read More” below to access these, other headlines, and the associated news summaries moving the markets today.

Today Through the Fourth Friday (22 to 28 days) Weather Outlook for the U.S. and a Six-Day Forecast for the World: posted June 25, 2024

This article focuses on what we are paying attention to in the next 48 to 72 hours. The article also includes weather maps for longer-term U.S. outlooks and a six-day World weather outlook which can be very useful for travelers.

First the NWS Short Range Forecast. The afternoon NWS text update can be found here after about 4 p.m. New York time but it is unlikely to have changed very much from the morning update. The images in this article automatically update.

Short Range Forecast Discussion
NWS Weather Prediction Center College Park MD
Valid 00Z Tue Jun 25 2024 – 00Z Thu Jun 27 2024

…Heat wave focus shifts to the Southeast, Mid-South, and
central/southern Plains into midweek…

…Severe storms and flash flooding possible for portions of the Upper
Midwest into Monday night, shifting a bit south Tuesday…

…Monsoon-like conditions persist for the Southwest/Four Corners Region…

A broad upper-level ridge building over the west-central U.S. will
continue to produce potentially hazardous heat over the next few days.
Forecast high temperatures will continue to soar into the upper 90s across
much of the Plains and Mississippi Valley and into southeastern parts of
the Lower 48, with low 100s possible over the central Plains. When
combined with the humidity, heat index values may reach as high as 110,
prompting Heat Advisories and some embedded Excessive Heat Warnings.
Meanwhile, low temperatures will mostly remain in the mid- to upper 70s,
bringing little relief from the heat overnight. The arrival of this more
intense heat early in the Summer season leads to a higher level of
heat-related stress, especially for those outdoors and without reliable
air conditioning available. While the north-central U.S. can expect some
relief from the heat Tuesday and especially Wednesday behind a cold front,
the Southern Plains to Mid-South to Southeast will maintain potentially
dangerously hot conditions through the period, with a brief period of heat
returning to the Middle Mississippi/Ohio Valleys on Tuesday and
Mid-Atlantic on Wednesday.

To the north, an upper-level shortwave and accompanying surface frontal
system will move along the northern tier of the central U.S. towards the
Upper Midwest. Deep moisture flowing northward ahead of the system will
bring increasing storm chances through tonight. Hot temperatures along
with the plentiful moisture will lead to strong to extreme instability,
prompting an Enhanced Risk of severe weather (level 3/5) from the Storm
Prediction Center. Tornadoes and large hail are possible with the storms,
but the primary threat is a corridor of very high wind across southern
Wisconsin and surrounding states. Additionally, a Marginal to Slight Risk
of excessive rainfall causing flash flooding is in place for portions of
the Upper Midwest with locally heavy downpours. The low system will
continue eastward on Tuesday, with a cold front pushing southeastward into
the Midwest/Great Lakes region. Storms developing along and ahead of the
front could tend to repeat over the same areas as storm motions become
more parallel to the increasingly east-to-westward oriented front. This is
prompting a larger Slight Risk of flash flooding for portions of the
Middle Mississippi Valley with a Slight Risk of severe weather aligned in
a similar area for Tuesday into Tuesday night. By Wednesday, the
southeastward progression of the front will produce thunderstorm chances
from the Lower/Middle Mississippi Valley into the Tennessee and Ohio
Valley to the Mid-Atlantic and Northeast.

Daily shower and thunderstorm chances continue over portions of the
Southwest/Four Corners Region as an influx of ample tropical moisture
brings monsoon-like conditions. Some locally intense downpours are
possible and may lead to isolated instances of flash flooding, for broad
Marginal Risks in the Excessive Rainfall Outlook (ERO). Through Monday
evening, more focused rainfall may be possible in southeast Arizona, which
may cause more scattered instances of flash flooding especially for urban
areas around Tuscon. Then by Wednesday, rainfall may be particularly
concerning over portions of New Mexico that are sensitive to additional
rainfall due to recent burn scars, prompting an embedded Slight Risk there
in the Day 3 ERO. The higher moisture, cloud cover, and storms will keep
temperatures around average, with 80s and 90s in the Four Corners region
and 100s to 110 for the Southwest. Forecast high temperatures are
generally above average by 5-10 degrees elsewhere in the West, with 60s
and 70s along the immediate Pacific Coast, 70s and 80s in the Pacific
Northwest, and low to mid-90s for the Great Basin. Highs in the low to
mid-100s for portions of interior central California and the 110s for the
western Mojave/Sonoran Deserts have prompted heat-related advisories and
warnings.

Elsewhere, areas of showers and storms may continue into this
evening/tonight in the vicinity of a surface low slowly pushing away from
northern New England. Farther south, additional storms are possible ahead
of a cold front over portions of the Southeast. Diurnal sea breeze-related
storms are also expected over Florida Monday and Tuesday. Welcome relief
from the weekend’s heat is present in the Mid-Atlantic, with highs
generally in the 70s and 80s. Temperatures will gradually rise across the
Eastern Seaboard Tuesday and Wednesday, with highs in the upper 80s to
90s.

To get your local forecast plus active alerts and warnings click HERE and enter your city, state or zip code.

Learn about wave patterns HERE.

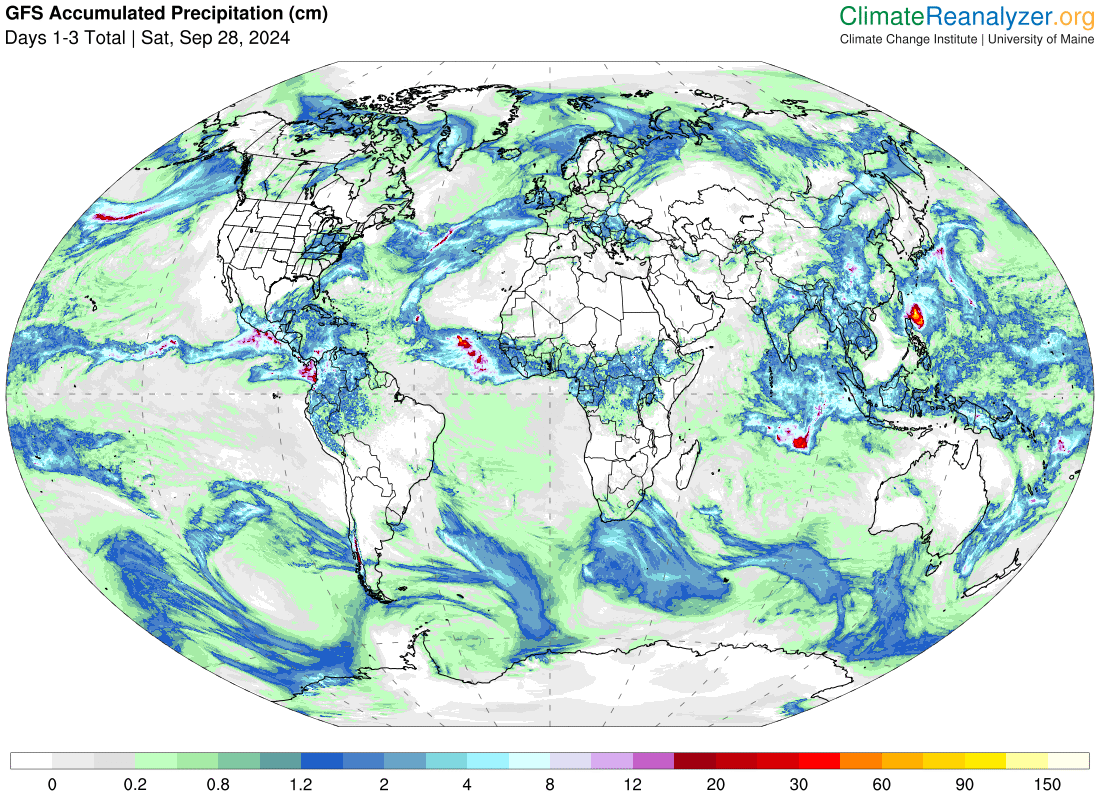
Then, looking at the world and of course, the U.S. shows here also. Today we are looking at precipitation.

Please click on “Read More” below to access the full Daily Report issued today.

24 Jun 2024 Market Close & Major Financial Headlines: Wall Street Markets Opened Mixed, Bitcoin Tumbles, Small Caps Trend Downward And Close At Session Lows

Summary Of the Markets Today:

  • The Dow closed up 261 points or 0.67%,
  • Nasdaq closed down 1.09%,
  • S&P 500 closed down 0.31%,
  • Gold $2,346 up $14.30,
  • WTI crude oil settled at $82 up $0.99,
  • 10-year U.S. Treasury 4.244 down 0.013 points,
  • USD index $105.48 down $0.320,
  • Bitcoin $59,288 down $3,883 or 6.15%

*Stock data, cryptocurrency, and commodity prices at the market closing.


Click here to read our current Economic Forecast – May 2024 Economic Forecast: No Real Change So Expect The Economy To Continue To Plod Along


Today’s Economic Releases Compiled by Steven Hansen, Publisher:

The Dallas Fed Manufacturing Outlook Survey‘s production index inched up to 0.7 from -2.8 in May 2024. The near-zero reading signals little change in output after a slight decline over the prior period. The new orders index remained slightly negative, though it has moved up steadily over the past few months to -1.3 in June from -11.8 in March. The capacity utilization index slipped to -4.8 from -2.0, while the shipments index moved back into positive territory, climbing six points to 2.8. Overall, manufacturing in the U.S. remains in the doldrums.

Here is a summary of headlines we are reading today:

Click on the “Read More” below to access these, other headlines, and the associated news summaries moving the markets today.
Today Through the Fourth Friday (22 to 28 days) Weather Outlook for the U.S. and a Six-Day Forecast for the World: posted June 24, 2024

This article focuses on what we are paying attention to in the next 48 to 72 hours. The article also includes weather maps for longer-term U.S. outlooks and a six-day World weather outlook which can be very useful for travelers.

First the NWS Short Range Forecast. The afternoon NWS text update can be found here after about 4 p.m. New York time but it is unlikely to have changed very much from the morning update. The images in this article automatically update.

Short Range Forecast Discussion
NWS Weather Prediction Center College Park MD
Mon Jun 24 2024
Valid 12Z Mon Jun 24 2024 – 12Z Wed Jun 26 2024

…Heat wave focus shifts to the Southeast, Mid-South, and
central/southern Plains early this week…

…Severe storms for portions of the Upper Midwest on Monday, with an
increasing flash flooding threat for the Midwest Tuesday…

…Monsoon-like conditions persist for the Southwest/Four Corners Region…

As an upper-level trough moves over the northeastern U.S., bringing relief
from the heat over the weekend, a broad upper-level ridge will build over
the central/western U.S., shifting the focus for the ongoing heat wave to
the Southeast, Mid-South, and central/southern Plains early this week.
Forecast high temperatures will continue to soar into the upper 90s over
the region, with low 100s possible over the central Plains. When combined
with the humidity, heat index values may reach as high as 110, prompting
widespread Heat Advisories. Meanwhile, low temperatures will mostly remain
in the mid- to upper 70s, bringing little relief from the heat overnight.
The arrival of this more intense heat early in the Summer season leads to
a higher level of heat-related stress, especially for those outdoors and
without reliable air conditioning available.

To the north, an upper-level shortwave and accompanying surface frontal
system will move along the northern tier of the central U.S. towards the
Upper Midwest during the day Monday. Deep moisture flowing northward ahead
of the system will bring increasing storm chances by later Monday
afternoon and into Monday evening. Hot temperatures along with the
plentiful moisture will lead to strong to extreme instability, prompting a
Slight Risk of severe weather (level 2/5) from the Storm Prediction
Center. Very large hail and significant damaging winds can be expected
with any storms, and possibly a tornado. A potentially higher threat of
damaging winds exists if enough storms develop and evolve into an
organized convective system. Locally heavy downpours can also be expected,
with an isolated risk of flash flooding especially if storms are able to
become more organized and widespread. The system will continue eastward on
Tuesday, with a cold front pushing southeastward into the Midwest/Great
Lakes region. Storms developing along and ahead of the front will tend to
repeat over the same areas as storm motions become more parallel to the
increasingly east-to-westward oriented front. This will bring a greater
chance of flash flooding compared to Monday, with a Slight Risk of
Excessive Rainfall (level 2/4) in effect. Some severe storms will again be
possible, with a Slight Risk in place for the threat of large hail and
damaging winds.

Daily shower and thunderstorm chances continue over portions of the
Southwest/Four Corners Region as an influx of tropical moisture brings
Monsoon-like conditions. Some locally intense downpours are possible and
may lead to isolated instances of flash flooding. The highest confidence
in storm coverage exists over portions of southeast Arizona where a Slight
Risk of Excessive Rainfall is in effect. A few more scattered instances of
flash flooding will be possible here, especially for urban areas around
Tuscon. The higher moisture, cloud cover, and storms will keep
temperatures around average, with 80s and 90s in the Four Corners region
and 100s to 110 for the Southwest. Forecast high temperatures are
generally above average by 5-10 degrees elsewhere in the West, with 60s
and 70s along the immediate Pacific Coast, 70s and 80s in the Pacific
Northwest, and low to mid-90s for the Great Basin. Highs in the low to
mid-100s for portions of interior central California and the 110s for the
western Mojave/Sonoran Deserts have prompted heat-related advisories and
warnings.

Elsewhere, areas of showers and storms will continue in the vicinity of a
surface low and cold front pushing through Upstate New York and New
England into early Monday afternoon. Storm chances should taper off as the
system clears the coast Monday evening. Further south, additional storms
will be possible ahead of a cold front over portions of the Southeast.
Diurnal sea breeze-related storms are also expected over Florida Monday
and Tuesday. Welcome relief from the heat will come to the Mid-Atlantic,
with highs generally in the 70s and 80s. Temperatures will return closer
to average Tuesday, with highs in the upper 80s to low 90s.

To get your local forecast plus active alerts and warnings click HERE and enter your city, state or zip code.

Learn about wave patterns HERE.

Then, looking at the world and of course, the U.S. shows here also. Today we are looking at precipitation.

Please click on “Read More” below to access the full Daily Report issued today.

Today Through the Fourth Friday (22 to 28 days) Weather Outlook for the U.S. and a Six-Day Forecast for the World: posted June 23, 2024

This article focuses on what we are paying attention to in the next 48 to 72 hours. The article also includes weather maps for longer-term U.S. outlooks and a six-day World weather outlook which can be very useful for travelers.

First the NWS Short Range Forecast. The afternoon NWS text update can be found here after about 4 p.m. New York time but it is unlikely to have changed very much from the morning update. The images in this article automatically update.

Short Range Forecast Discussion
NWS Weather Prediction Center College Park MD
Sun Jun 23 2024
Valid 12Z Sun Jun 23 2024 – 12Z Tue Jun 25 2024

…Heat wave focus shifts from the Mid-Atlantic to portions of the
Southeast/Southern Plains by Monday…

…Widespread storms will bring the threat of flash flooding, damaging
winds, and tornadoes to New England Sunday…

…Severe storms for portions of the Upper Midwest on Monday…

…Monsoon-like conditions persist for the Southwest…

Broad long-wave upper-level ridging over the East Coast and western U.S.
Sunday will keep hot Summer temperatures in the forecast for much of the
country. Highs are forecast into the upper-90s from the Mid-Atlantic to
the Southeast/Lower Mississippi Valley/Southern Plains and west through
the High Plains into the Great Basin and California. Humidity helping to
push heat index values into the low 100s as well as warm low temperatures
generally in the mid-70s, providing little relief from the heat overnight,
will make this heat most dangerous for portions of the Mid-Atlantic,
Southeast, Lower Mississippi Valley, and Southern Plains, with
heat-related advisories and warnings in effect for some areas. Numerous
record-tying/breaking highs are possible for the Mid-Atlantic. In the
West, heat-related advisories/warnings are also in effect where
temperatures will push past 100 over northern Utah and portions of
central/southern interior California. An approaching upper-level
trough/surface cold front later Sunday will bring temperatures down closer
to average Monday for the Mid-Atlantic, while the Southeast/Lower
Mississippi Valley/Southern Plains continue to simmer. The upper-level
ridge over the West will also begin to move eastward over the central
U.S., bringing highs into the upper 90s and low 100s more broadly over the
Central/Southern Plains.

The noted upper-level trough and accompanying surface low pressure/frontal
system pushing eastward will bring storm chances from New England
southwestward through the Mid-Atlantic into the Upper Ohio/Tennessee
Valleys Sunday with moderate to locally heavy rainfall possible. The
greatest chance for some potentially more significant rainfall will fall
ahead of the surface low track over northern New England where anomalously
high moisture values and strong forcing could lead to downpours upwards of
2″/hour. A Slight Risk of Excessive Rainfall (level 2/4) is in effect for
the risk of some scattered instances of flash flooding. In addition,
strengthening upper-level and low-level winds as well as strong
instability given the high moisture and warming temperatures will promote
some more intense thunderstorms. The Storm Prediction Center has added an
Enhanced Risk of severe weather (level 3/5) over central New England where
these conditions are most favorable for the threat of damaging winds and a
few tornadoes. A broader Slight Risk (level 2/5) is in place across the
region and southwest through the northern Mid-Atlantic into the Upper Ohio
Valley for a more isolated threat of damaging winds. The system is
expected to reach the coast by Monday morning, bringing drier conditions
into the day Monday, though some storms may linger over northern New
England.

To the West, an upper-level shortwave/surface frontal system moving
eastward along the northern tier of the West/southern Canada Sunday will
approach the Upper-Midwest by Monday afternoon. Warm, moist air flowing
northward ahead of the system will help to lead to the chance for some
storms along and ahead of an eastward moving cold front. A Slight Risk of
severe weather remains in place for portions of northern
Minnesota/Wisconsin for the threat of some damaging winds and large hail.
The chance for some more widespread/organized convection and locally heavy
downpours may lead to an isolated instance or two of flash flooding as
well. Monsoon-like conditions will persist over the Southwest through at
least Monday, with daily shower and thunderstorm chances. Anomalously high
moisture over the region will lead to some locally heavy downpours and an
isolated risk for flash flooding. Daily storm chances will also persist
over Florida and south Texas.

To get your local forecast plus active alerts and warnings click HERE and enter your city, state or zip code.

Learn about wave patterns HERE.

Then, looking at the world and of course, the U.S. shows here also. Today we are looking at precipitation.

Please click on “Read More” below to access the full Daily Report issued today.

Our Report on the JAMSTEC Three-Season Forecast – Posted on June 22, 2024

The Japan Agency for Marine-Earth Science and Technology, or JAMSTEC, is a Japanese national research institute for marine-earth science and technology

From the JAMSTEC Discussion:

“The most recent observations indicate that the El Niño is now almost over, and there are weak signs of a La Niña. The SINTEX-F ensemble mean predicts that a La Niña Modoki will develop in the boreal autumn. However, there is a large uncertainty in the occurrence timing and amplitude.”

Although it is a World forecast, it includes a forecast for North America since North America is part of the World. One might try to compare it to the NOAA Outlook we published yesterday which can be accessed HERE.

First, we take a look at the forecasted sea surface temperature anomalies (SSTA). JAMSTEC starts by forecasting the SSTA and Nino 3.4 Index on the first day of the month and from there it usually takes their models about two weeks to produce their seasonal forecast. I received it from JAMSTEC on May 14 close to when NOAA issued their Seasonal Update this month.  The JAMSTEC model runs are based on conditions as of June 1, 2024. The NOAA Seasonal Outlook is based on conditions closer to the time when it was issued.

We do not have a full three-season forecast from JAMSTEC this month. We have forecast maps for  JAS, SON and DJF so it is really an eight-month forecast as JAS and SON overlap a bit. For each of these three-month Outlooks, I also show the corresponding NOAA Outlook. The two are remarkably similar which is very unusual.

We also have single-month forecasts for July, August and September 2024. I have a single-month outlook for July from NOAA but not single-month outlooks for August and September so I did not show those comparisons.

Let’s take a look.

This shows their forecast of sea surface temperature anomalies at three points in time. Blue is cold and is associated with La Nina if it occurs in the Nino 3.4 measurement areas.  You no longer can see the El Nino tongue of warm water extending from Peru to the west in the JAS image but look at that blob of cool (anomaly) water to the west i.e. by this point in time this has Modoki characteristics that impact the Walker circulation. SON  and DJF also show La Nina but are increasingly to the west and may not be in the Nino 3.4 measurement area.  I have written about that before. It raises questions about the reliability of our current approach to thinking about the ENSO Cycle. This is covered in another article that can be accessed HERE. But JAMSTEC is showing a relatively normal ocean off the coast of much of the U.S. coasts which probably explains their forecast.

Of interest also is the cold water of the West Coast of the U.S. and the warm water between Africa and the north coast of South America.

JAMSTEC uses the same definition of Normal (climatology) as NOAA. JAMSTEC does a better job at characterizing La Ninas and El Ninos than NOAA. JAMSTEC provides me with a lot of other information that I do not include in my articles to keep them to a manageable size for readers. That material is the atmospheric pressure patterns.

Some Readers will have to click on “Read More” to read the rest of the article which you need to read to see the forecasts. I can only include a certain amount of material in the lede.

Today Through the Fourth Friday (22 to 28 days) Weather Outlook for the U.S. and a Six-Day Forecast for the World: posted June 22, 2024

This article focuses on what we are paying attention to in the next 48 to 72 hours. The article also includes weather maps for longer-term U.S. outlooks and a six-day World weather outlook which can be very useful for travelers.

First the NWS Short Range Forecast. The afternoon NWS text update can be found here after about 4 p.m. New York time but it is unlikely to have changed very much from the morning update. The images in this article automatically update.

Short Range Forecast Discussion
NWS Weather Prediction Center College Park MD
Sat Jun 22 2024
Valid 12Z Sat Jun 22 2024 – 12Z Mon Jun 24 2024

…Heat wave focus shits from the Midwest/Ohio Valley into the
Mid-Atlantic states this weekend...

…Heavy rain and flash flooding concerns across the Upper Great
Lakes/Mississippi Valley Saturday and northern New England Sunday…

…Heat building across the West this weekend, monsoon-like conditions for
the Desert Southwest…

A heat wave will continue over much of the eastern U.S. south of a
quasi-stationary boundary and under the influence of longwave ridging
aloft this weekend. Forecast high temperatures Saturday will generally be
in the mid- to upper 90s from the central/southern Plains to the East
Coast. These temperatures remain the most anomalous and dangerous for
early Summer over portions of the Midwest/Ohio Valley east to the
Mid-Atlantic. Heat-related advisories and warnings are in place as
humidity will bring heat index values as high as the mid-100s. A potent
upper-level shortwave will help to finally push the boundary southward
Sunday, bringing welcome relief to much of the Midwest/Ohio Valley, while
the Mid-Atlantic continues to simmer. Numerous record-tying/breaking highs
are possible. In addition, overnight low temperatures will remain to the
mid- and even upper 70s, providing little relief from the heat overnight.
The combination of this heat coming early in the Summer season and
persisting over several days increases the level of heat stress for those
without reliable air conditioning.

Widespread showers and thunderstorms will continue to the north along the
quasi-stationary boundary draped from New England west through the Great
Lakes and into the Upper Mississippi Valley. Plentiful moisture will
increase the chance for locally heavy downpours. The highest chance for
potentially significant heavy rainfall will be along the boundary ahead of
an upper-level wave over portions of the Upper Great Lakes/Upper
Mississippi Valley Saturday. Ongoing organized storms from overnight
Friday as well as the risk for more widespread, organized storms into the
day Saturday has prompted a Moderate Risk of Excessive Rainfall (level
3/4) over southern Wisconsin and northeastern Iowa for the threat of
scattered to numerous instances of flash flooding. A broader Slight Risk
(level 2/4) covers the region. In addition, a few storms may be severe,
with a Slight Risk of severe weather (level 2/5) issued by the Storm
Prediction Center for the threat of some damaging winds and a few
tornadoes. A locally higher threat for heavier downpours will also exist
over southern New England, with a Slight Risk in place. The noted more
potent upper-level shortwave arriving Sunday will help to push the
boundary south and eastward, bringing higher storm chances more broadly
across New England and southwestward though the Mid-Atlantic/Ohio
Valley/Tennessee Valley. Stronger, very moist low-level flow interacting
with the boundary over northern New England will bring the greatest chance
for heavy downpours and scattered flash flooding, with another Slight Risk
in place. A Slight Risk for severe weather also covers much of the same
region and southwestward into the northern Appalachians/Upper Ohio Valley,
where damaging winds and a few tornadoes will once again be the main
threats.

Upper-level ridging will begin to build over the western and then central
U.S. following the shortwave passage, bringing rising temperatures across
this region as well. Forecast highs Saturday across much of the interior
Pacific Northwest, Great Basin, and California will be in the mid-90s to
low 100s. Locally higher temperatures into the mid-100s have prompted
heat-related advisories and warnings for the central California Valleys
into portions of southern California. The focus over the northern tier
will begin to shift eastward with the ridge on Sunday, with cooler highs
in the Pacific Northwest but temperatures soaring into the mid- and upper
90s over much of the central/northern High Plains. Conditions will remain
hot from central to southern California. Temperatures will still be hot
but closer to average for the Desert Southwest as Monsoon-like conditions
remain over the region. Highs Saturday and Sunday will range in the mid-
to upper 100s, with scattered showers and storms bringing the threat for
some locally heavy downpours and an isolated risk for flash flooding.
Elsewhere, a pair of waves of low pressure passing over portions of the
Southeast/Florida as well as south Texas will bring daily shower and storm
chances.

To get your local forecast plus active alerts and warnings click HERE and enter your city, state or zip code.

Learn about wave patterns HERE.

Then, looking at the world and of course, the U.S. shows here also. Today we are looking at precipitation.

Please click on “Read More” below to access the full Daily Report issued today.

21 Jun 2024 Market Close & Major Financial Headlines: Small Caps Open Lower, Nvidia Struggles, Dow Trades Closely Along The Unchanged Line, Markets Closed Mixed

Summary Of the Markets Today:

  • The Dow closed up 16 points or 0.04%,
  • Nasdaq closed down 0.18%,
  • S&P 500 closed down 0.16%,
  • Gold $2,335 down $34.10,
  • WTI crude oil settled at $81 down $0.65,
  • 10-year U.S. Treasury 4.255 up 0.001 points,
  • USD index $105.82 up $0.23,
  • Bitcoin $64,193 down $648 or 1.00%,
  • Baker Hughes Rig Count: U.S. -2 to 588 Canada +6 to 166

*Stock data, cryptocurrency, and commodity prices at the market closing.


Click here to read our current Economic Forecast – June 2024 Economic Forecast: Our Index Marginally Weakened And There Is Another Indicator Warning Of A Recession


Today’s Economic Releases Compiled by Steven Hansen, Publisher:

Existing-home sales slightly declined in May 2024 as the median sales price climbed to a record high. Total existing-home sales – completed transactions that include single-family homes, townhomes, condominiums and co-ops – year-over-year, sales waned 2.8%. The median existing-home price for all housing types in May was $419,300, the highest price ever recorded and an increase of 5.8% from one year ago ($396,500). I am surprised at the strength of the existing home market given the high mortgage rates which make home ownership unaffordable. NAR Chief Economist Lawrence Yun’s view:

Eventually, more inventory will help boost home sales and tame home price gains in the upcoming months. Increased housing supply spells good news for consumers who want to see more properties before making purchasing decisions. Home prices reaching new highs are creating a wider divide between those owning properties and those who wish to be first-time buyers. The mortgage payment for a typical home today is more than double that of homes purchased before 2020. Still, first-time buyers in the market understand the long-term benefits of owning.

The Conference Board Leading Economic Index® (LEI) for the U.S. decreased by 0.5 percent in May 2024 to 101.2 (2016=100), following a 0.6 percent decline in April. Over the six-month period between November 2023 and May 2024, the LEI fell by 2.0 percent—a smaller decrease than its 3.4 percent contraction over the previous six months. Per Justyna Zabinska-La Monica, Senior Manager, Business Cycle Indicators, at The Conference Board:

The U.S. LEI fell again in May, driven primarily by a decline in new orders, weak consumer sentiment about future business conditions, and lower building permits. While the Index’s six-month growth rate remained firmly negative, the LEI doesn’t currently signal a recession. We project real GDP growth will slow further to under 1 percent (annualized) over Q2 and Q3 2024, as elevated inflation and high interest rates continue to weigh on consumer spending.

Here are some of headlines we are reading today:

Click on the “Read More” below to access these, other headlines, and the associated news summaries moving the markets today.

NOAA Updates its Seasonal Outlook on June 20, 2024 – Similar to the Outlook Issued last Month – Posted on June 21, 2024

On the third Thursday of the month right on schedule NOAA issued their updated Seasonal Outlook which I describe as their Four-Season Outlook because it extends a bit more than one year into the future. The information released also included the Mid-Month Outlook for the following month plus the weather and drought outlook for the next three months.  I present the information issued by NOAA and try to add context to it. It is quite a challenge for NOAA to address the subsequent month, the subsequent three-month period as well as the twelve successive three-month periods for a year or a bit more.

With respect to the long-term part of the Outlook which I call the Four-Season Outlook, there is a rapid transition from Neutral to LaNina. So getting the timing right is challenging. We are now in ENSO Neutral. La Nina is the likely scenario for this summer almost to the end of the forecast period. The Outlook beyond June has not been significantly changed from what was issued last month. This suggests increasing confidence in the outlook.  The forecast is a canonical La Nina plus trends.

First, Let’s Take a Look at the (mid-month) Outlook for July

It will be updated on the last day of June.

The top row is what is now called the Mid-Month Outlook for next month which will be updated at the end of this month. There is a temperature map and a precipitation map. The second row is a three-month outlook that includes next month.  I think the outlook maps are self-explanatory. What is important to remember is that they show deviations from the current definition of normal which is the period 1991 through 2020.  So this is not a forecast of the absolute value of temperature or precipitation but the change from what is defined as normal or to use the technical term “climatology”.

Notice that the Outlook for next month and the three-month Outlook are somewhat different, especially about precipitation.  This tells us that August and September will be different than July to some extent.

The expansion of the area impacted by drought is extensive.

The full NOAA Seasonal Outlook extends through July/August/September of 2025 (yes that is more than a year out). All of these maps are in the body of the article. Large maps are provided for July and the three-month period July/August/September.  Small maps are provided beyond that through July/August/September of 2025 with a link to get larger versions of these maps.

NOAA provides a discussion to support the maps. It is included in the body of this article. In some cases, one will need to click on “read more” to read the full article.  For those on my email list where I have sent the url of the article, that will not be necessary.